Climate Change and its Impacts on Water Resources and Extreme Events in Washington State
|
|
|
- Brittney McDowell
- 5 years ago
- Views:
Transcription

1 February 2015

2 Climate Change and its Impacts on Water Resources and Extreme Events in Washington State Regional Historical Trends Climate Change Projections


3

4

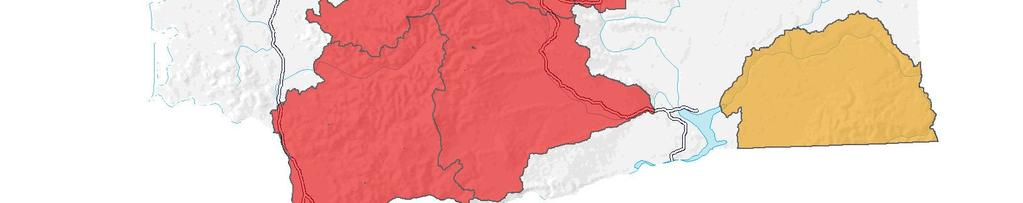
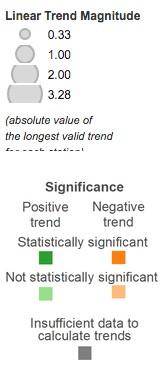
5 Temperature Trends Squares aren t significant linear trends; circles are significant at 95% Abatzoglou et al (J. Climate)

6

7 Check out the new trend analysis tool:

8
9 Total Winter Snowfall (inches) at Snoqualmie Pass 900 El Nino La Nina
10 Northern Cascade Mountains of WA

11 Snow Water Equivalent (SWE) for 1 April Mote et al. (2016)
12 60-Year Trends for the Top Precipitation Events along the West Coast of North America Top 60 Top 20 Aberdeen Forks Mass et al. (2011)
13
14 Rain-dominant

15 I DON T CARE WHAT THEY SAY, THIS GLOBAL WARMING SCARE IS JUST A BUNCH OF LOONY LEFT-WING ENVIRONMENTAL ANTI-GROWTH HYPE! SO, IS THIS YOUR FIRST WINTER HERE IN SEATTLE?
16 2018

17 Modeled Change in Temperature by the Middle of the 21st Century Dec-Jan-Feb Jun-Jul-Aug


18 Modeled Change in Precipitation Nov-Dec-Jan Jun-Jul-Aug


19


20
21 P C 2020s Season Changes relative to mean 2040s Wetter winters Drier summers (slide courtesy of Ingrid Tohver - UW CIG) 2080s 21 WACCIA (CIG

22 Expected Transitions in Watershed Types Hamlet et al. 2013

23 Tohver et al. 2014

 (1980-1999)")
24 Modeled Changes in Atmospheric River Frequency RCP 8.5: ( ) ( ) * Payne and Magnusdottir (2015)

25 RCP8.5 Simulations: Slight weakening of low-level onshore flow into the Pac NW; Equatorward broadening of zonal flow maxima in lower and upper-troposphere Payne and Magnusdottir (2015)

26 Climate Change Time of Emergence for the Pacific Northwest When is the earliest change expected for monthly streamflow metrics? Total Streamflow Decreasing Increasing Choose Streamflow Metric: Dataset Emissions Scenario 2071 Resilience2076 Model Agreement Maximum Daily Streamflow CMIP3 High Emissions Less resilient 25% Total Streamflow CMIP5 Low Emissions More resilient 50% 75% Month July Show history When will the climate change signal in July streamflow exceed the interannual variability?
27 Ecosystem Concerns Water and Air Temperature Impacts Aquatic Migration Invasive Species Sea Level Rise/Saltwater Intrusion Riverine Habitat
28 Final Remarks Record temperature anomalies occurred during in the western US. Future decades will feature not just warmer temperatures but probably also wetter winters and slightly drier summers Relative to historical norms, Pacific NW stream flows are generally expected to be greater in winter and lower in summer. Extreme events (ARs) liable to include greater moisture contents. Will overall water supply or water quality be a bigger issue?
29 HadSST (Degrees C) Sea Surface Temperature (SST) Anomalies Offshore the Pacific NW N, W

30

31 Marlier et al. (2017)

32 August Mean Air Temperatures (fill) and Maximum Summer Stream Temperatures (dots)

33 Trends in Fraction of Snow versus Rain in Winter ( )
34 S Precipitation Trends ( ) significant linear trends; circles are significant at 95% Abatzoglou et al (J. Climate)
35 References US Bureau of Reclamation (2016): SECURE Water Act Section 9503(c) Reclamation Climate Change and Water Available at US Environmental Protection Agency (2016): Climate Impacts in the Northwest. Available at 2 US Geological Survey (2009): Climate Change and Water Resources Management: A Federal Perspective. Available at Dettinger, M., B. Udall and A. Georgakakos (2015): Western water and climate change. Ecological Applications, 25(8),

36
37 Potential Evapotranspiration (pet) Bond and Bumbaco (2015)

38 G. Mauger K. Bumbaco
39 Snow Dominant