Approach to Climate Change and Development of System Resiliency
|
|
|
- Reginald Casey
- 5 years ago
- Views:
Transcription
1 Massachusetts Water Resources Authority Presentation to American Council of Engineering Companies of Massachusetts Approach to Climate Change and Development of System Resiliency David W. Coppes Chief Operating Officer May 31, 2018

2 MWRA Service Area MWRA provides wholesale water and wastewater services to over 2.5 million customers in 61 communities On average, MWRA delivers about 200 million gallons per day to its water customers MWRA collects and treats an average of 350 million gallons of wastewater per day, with a peak capacity of 1.2 billion gallons 2
3 Two Pronged Approach to a Long Term Concern Adaptation: Understand the Potential Impacts Mitigate Impacts Create Resiliency Mitigation: Reduce Greenhouse Gases Contribute to the Common Good Reduce Costs Improve Environmental Footprint Improve Public Perception 3
4 Large Reservoir + More Precipitation = Plenty of High Quality Water 4


5 2016: MWRA in position to help communities in need 5


6 Drinking Water System Is In Good Shape Quabbin Reservoir, Belchertown 65 miles west of Boston Elevation 528 feet Wachusett Reservoir, Clinton 35 miles west of Boston Elevation 395 feet Water treatment plant is in Marlborough 85% of water delivered by gravity Lowest elevation of a water tank is 192 feet above sea level 6

7 Significant Investment in Dams: Able to Handle Flooding All MWRA dams, dikes, spillways and appurtenances are inspected routinely by licensed dam safety engineers and are in good condition Since 2006, MWRA has spent over $21 million on dam safety projects 7

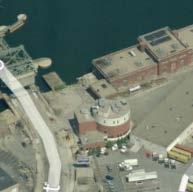
8 Adaptation For Sea Level Rise In The Design of Deer Island WWTP 8

9 Adaptation For Sea Level Rise In The Design of Deer Island Deer Island plant fully protected 100-year flood 1.9-foot sea level rise Wave runup of 14 feet on east side and 2 feet on west side On-site power plant ensures uninterrupted power supply Nut Island headworks in Quincy similarly designed for sea level rise 9

10 A Rising Sea Impacts The Hydraulics Of The Outfall Tunnel The effluent from the sewage treatment plant is discharged by gravity to the 9.5 mile outfall tunnel To maintain hydraulic capacity, tunnel diameter was up-sized from 24 feet to feet 10

11 Sea-Level Rise Is Already With Us: January and March 2018 Storm/Extreme High Tide Events 11


12 Hurricane Sandy Impacts On NY/NJ Water Utilities: What WE want to avoid! Many water utilities lost power due to lack of generators NYC water was safe to drink, but surrounding counties in NY and NJ had do not use advisories, or boil water notices Passaic Valley was forced to release billions of gallons of raw or partially treated sewage into New York Bay over several weeks 12


13 21 Of MWRA Coastal Sewer Facilities Are Within 15 Feet Of Mean Sea Level 13
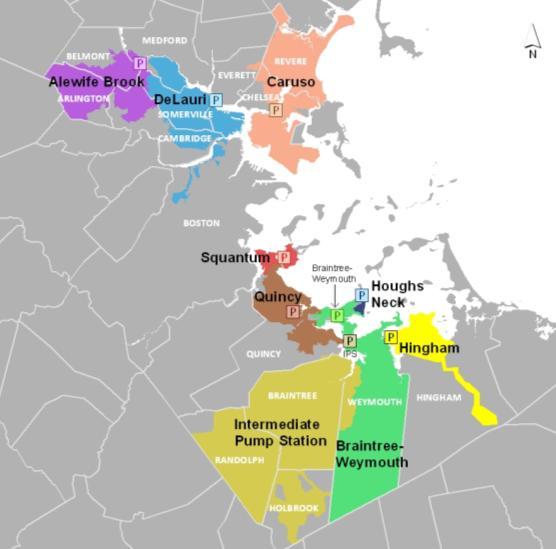


14 Areas Potentially Affected By Loss Of Coastal Pump Stations 14

15 Impact of Global Warming: 100 Year Storm and Sea Level Rise In Year My Office Data sources: Flooded area IPCC, ground elevations determined by LIDAR. 15
16 Benchmarks For Evaluating Facilities 100 year flood as determined by FEMA (current regulatory requirement). 100 year flood + 2.5ft (NYC DEP, BHA). Additionally Hurricane flooding levels as determined by FEMA s SLOSH model (current evacuation planning recommendation) were reviewed. Wave action (for facilities adjacent to FEMA Hazard Zone VE) was reviewed. 16


 High Facilities that")

17 How Do Facilities Measure Up? Minimal Facilities that have a very low likelihood of flooding Maximum Facility that floods in a 100 year event Low High Facilities that that are within only have 1 foot flooding of flooding potential in a in 100 one year of the event Hurricane or essential Scenarios facility that (Categories floods in a 100 1,2,3, year and plus 4 as 2.5 determined ft event by the SLOSH model) High Facilities that are within 1 foot of flooding in a 100 year event or essential facility that floods in a 100 year plus 2.5 ft event Moderate Facilities that flood or are within 1 foot of flooding in a 100 year plus 2.5ft 17


18 Facilities Impact Summary 6 Sewer Facilities Likely Affected by a 100 Year Event. 9 Sewer and 3 Administration Facilities Likely Affected by a 100 Year feet Event. 7 Sewer Facilities Likely Affected by Hurricane Only. 5 Sewer Facilities Very Unlikely to be Affected. No Water Facility At Risk of Service Disruption. 18


19 Chelsea Screenhouse - Vulnerabilities Southwest Facility View Backup Generator 19

20 Impacted Areas in Chelsea: January and March 2018 Storm Events and Extreme High Tides Eastern Avenue 20

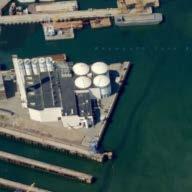
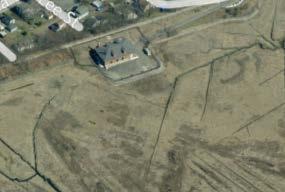
21 Model Representation of Impacted Area Chelsea Creek Headworks and Chelsea Screen House 21

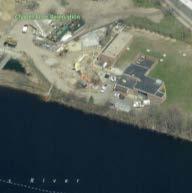
22 Model Representation of Impacted Area Braintree Weymouth Replacement Pump Station 22

23 Going Forward Short-term At-risk buildings fitted with temporary flood barriers. Long-term Future rehabilitation contracts taking sea level rise into account. Move important equipment to higher elevations. 23

24 Flood Barrier Installation 24


25 Example: Alewife Pumping Station Modifications Underway Flood logs (exterior) Flood logs (interior) Watertight hatch Flood logs (interior) 25


26 Example: Alewife Pumping Station Modifications Underway Raise elevation of critical equipment, both inside and outside of facility 26
27 Two Pronged Approach to a Long Term Concern Adaptation: Understand the Potential Impacts Mitigate Impacts Create Resiliency Mitigation: Reduce Greenhouse Gases Contribute to the Common Good Reduce Costs Improve Environmental Footprint Improve Public Perception 27
28 Two Pronged Approach to a Long Term Concern Adaptation: Understand the Potential Impacts Mitigate Impacts Create Resiliency Mitigation: Reduce Greenhouse Gases Contribute to the Common Good Reduce Costs Improve Environmental Footprint Improve Public Perception 28
29 Two Pronged Approach to a Long Term Concern Adaptation: Understand the Potential Impacts Mitigate Impacts Create Resiliency Mitigation: Reduce Greenhouse Gases Contribute to the Common Good Reduce Costs Improve Environmental Footprint Improve Public Perception 29

30 Renewable Energy at Deer Island Deer Island currently self-generates approximately 27% of its electricity needs and more than half of the Island s energy demand is provided by on-site, renewable generation with more to come. 30

31 Methane Utilization At Deer Island Deer Island utilizes 98% of the methane generated to power a steam turbine generator and backpressure turbine for plant heat and hot water Avoids purchase of about 5MG in fuel oil annually Approximately 33 MkWh/yr electricity production Over $3.6M/yr electricity savings and revenue 31


32 Hydroelectric Power Cosgrove, Oakdale, Loring Rd, Deer Island Over 8MW Capacity Approximately 23 MkWh/yr electricity production Over $1.8M/yr savings and revenue 32


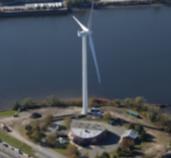
33 Wind Power Deer Island, Charlestown (DeLauri Pump Station) 2.8 MW Capacity Over 5 MkWh/yr electricity production Approximately $575,000/yr savings and revenue 33


34 Solar Power Deer Island, CWTP Over 1200 kw Capacity Over 1.4 MkWh/yr electricity production Approximately $242,000/yr savings and revenue 34
35 Our Mission in Short Adequate, Reliable Supply of High Quality Drinking Water Environmentally Responsible Collection, Treatment and Disposal of Wastewater Drink with Confidence Flush with Pride All Accomplished Affordably Under All Circumstances 35