Mumbai: Urban Reconstruction or
|
|
|
- Ronald Alexander
- 5 years ago
- Views:
Transcription


1 Mumbai: Urban Reconstruction or Environmental Destruction Hugh Byrd Anindita Mandal School of Architecture and Planning, The University of Auckland New Zealand
2 Population and Density 15. Rio de Janeiro 14. Beijing 13. Osaka 12. Jakarta 11. Buenos Aires 10. Shanghai 9. Delhi 8. Dhaka 7. Kolkata 6. Los Angeles 5. Mumbai 4. New York 3. Mexico City 2. Sao Paulo 1. Tokyo New York 90. Los 50. Tokyo 38. Osaka 29. Singapore 27. Mexico 25. Sao Paolo 17. Jakarta 12. Beijing 10. Shanghai 5. Shenzhen 4. Lagos 3. Karachi 2. Kolkata 1. Mumbai 2,050 2,750 4, ,400 8,350 8,400 9,000 10,500 11,500 13,400 17,150 18,150 18,900 23,900 29, Population (in millions) By Population (number of people) ,000 40,000 Density (people per sq km) By Population Density 5 Second largest of Asia s mega-cities in terms of population With an average population density of 29,650 per sq km it is one of the most crowded cities in the world 2 However, the redevelopment proposals for the city promote further densification. Reference: 4 Adapted from World Urbanisation Prospectus The 2001 Revision (United Nations) 5

 7 Greater Mumbai (438 sq km)")


3 Mumbai Mumbai Map of India 6 MMR extends over an area of 4355 sq km 2 Map of Mumbai Metropolitan Region (MMR) 7 Greater Mumbai (438 sq km) consists of two distinct regions: Mumbai Metropolitan Region Mumbai City district i 1. lies between and Map of Greater Mumbai 8 (wards A-G) North latitude and and 2. Mumbai Suburban Mumbai lies on the west coast of India East longitude District (wards H-T) Reference: 6 Bureau of Indian Standards. (2005). National Building Code of India. 7 MMRDA Planning Team. ( ). Regional Plan for Mumbai Metropolitan Region. Mumbai: MMRDA 8
 in Mumbai is 20% 12, much higher than")

. City goes on a borewell-digging spree, Times of India. 12 Singh, Mamata R., V. Upadhyay, and Atul K. Mittal. 2010.")
4 Infrastructure Water: Sources of water supply are located about 100 km outside city limits in the form of lakes 9 supply of water for only a few hours in the day Connections to any new tower, clusters or townships being suspended 10 level of underground water is falling and bore wells have to be dug to greater depth 11 Unaccounted for Water (UFW) in Mumbai is 20% 12, much higher than cities across the country and the world RWH made mandatory to new development having plot area 300 sq m and above from 2007 Electricity: Maharashtra, having the highest consumer base in the country 13, tops the list for more deficit compared to other states Consumption of electricity is growing faster than production capacity,, leading to electricity blackouts on a regular basis 14, 15 Reference: 9 MCGM. "Greater Mumbai City Development Plan." Mumbai, (2005 to 2025). 10 Sen, Somit. "No Water for New Mumbai Towers." Times of India 12 December 2009, sec. Times City. Print. 11 Lewis, C. (2010, 4 June). City goes on a borewell-digging spree, Times of India. 12 Singh, Mamata R., V. Upadhyay, and Atul K. Mittal Addressing Sustainability in Benchmarking Framework for Indian Urban Singh, Mamata R., V. Upadhyay, and Atul K. Mittal Addressing Sustainability in Benchmarking Framework for Indian Urban Water Utilities. Journal of Infrastructure Systems (March): BS Reporter. "Mumbai Facing Power Shortage." Business Standard (17 October, 2006). 14 "Looking to Power the State Forward." Report. DNA (Daily News & Analysis) 5 July Rediff News. "Can Mumbai Escape Power Cuts?" Rediff News (Business Standard) 03 April 2007.
 is disposed of as mere dumping and levelling")


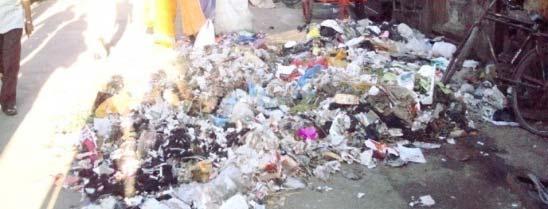
5 Infrastructure Solid Waste Management: Most of collected solid waste (7,025 MT/D) is disposed of as mere dumping and levelling at the landfill sites 9 landfill sites have almost outlived their carrying capacity 9 Allotted site likely to be inadequate for the projected solid waste generation 9 Drainage: flooding and water logging during heavy rains and high tides 9 discharge of large amount of untreated sewage into creeks 9, resulting li in degradation of coastal water quality, contamination of the adjoining beaches and seafronts 16 dilapidated condition resulting in leaks and contamination of ground water and piped water supply 9 Reference: 16 Kumar, Rakesh, Jayshree Subramaniam, and Dhanyakumar Patil. "Water Quality Modelling of Municipal Discharges from Sea Outfalls, Mumbai." Environmental Monitoring and Assessment 62 (2000): MCGM. "Greater Mumbai City Development Plan." Mumbai, (2005 to 2025).


.")


6 Infrastructure Food: reduced agricultural productivity 20 due to an increasing shortage of availability of productive land 16,9 and water for irrigation 21 transportation t ti of food from outside the city and storage, requires considerable amount of energy and space Transport: 85% of Mumbai s travel demand is still carried out through mass transport systems 32 - Trains : 53% - Buses : 35% use of personalised vehicles has been rising 9 slow traffic and environmental pollution 18 linked to increasing respiratory problems 19 in the city more emphasis is given to infrastructure development that promotes use of private vehicles without due consideration to pedestrians 17 References: 9 MCGM. "Greater Mumbai City Development Plan." Mumbai, (2005 to 2025). 16 Bhaskar, RN. "Food Security - Ii: Why Food Prices Will Keep on Rising." DNA (Daily News & Analysis) 2 September 2010, sec. Money. 17 Bombay First. Transportation. Strategy Paper 18 Dhakras, B. S. (2004). Study of Parameters in the Development of Sustainable Transportation System : A Case Study of Mumbai, India. Master of Civil Engineering, The University of Toledo, Toledo 19 Lewis, Clara, and Malathy Iyer Asthma is top killer of Maha women: Survey. Times of India, 28 March. 20 Renton, Alex. "Food, Famine & Climate Change: India's Scorched Earth." The Observer (Observer Food Monthly).11 October (2009). 21 Tiwari, P., & Kawakami, T. (2001). Modes of Commuting in Mumbai: A Discete Choice Analysis. Paper presented at the The Applied Regional Science Conference
 = about 275 sq km 9")


.")

7 Density Population of Mumbai = about 12 million 9 Developable land = 63% of 438 sq km (total area) = about 275 sq km 9 Population density = 43,700/sq km 9 Built-up area = 265 sq km 9 Developable land remaining = 10 sq km 9 This suggests congested living conditions and constrained land availability for further development and dgrowth. Households in Mumbai consume an average of 2.9 square meter of floor space per person which is one of the lowest residential floor areas per person in the world 42 It has a negative effect on the health of the inhabitants and the city should aim at least doubling it 22 Compared to crowding within dwellings, higher household/population density has fewer negative impacts 23 Reference: 22 Bertaud, A. (June 2004). Mumbai FSI conundrum: The perfect storm: the four factors restricting the construction of new floor space in Mumbai. Retrieved from 23 Dave, S. (2010). High Urban Densities in Developing Countries: A Sustainable Solution? Built Environment, Vol 36, No 1(The Compact City Revisited), MCGM. "Greater Mumbai City Development Plan." Mumbai, (2005 to 2025).
 and linking it to redevelopment program, opening up mill and port lands, relaxing")

. 24 MCGM. (2007). Development Control Regulations for Greater Bombay,1991.")
8 Potential for future development Increasing the availability of land by 9 increasing Floor Space Index (FSI) and linking it to redevelopment program, opening up mill and port lands, relaxing Coastal Regulation Zones (CRZ) II and III for Mumbai, building the trans-harbor link MHADA A identified ifi d old and dilapidated id d buildings, called Cessed Buildings, in the Island City 9 C-Ward Island City References: 9 MCGM. "Greater Mumbai City Development Plan." Mumbai, (2005 to 2025). 24 MCGM. (2007). Development Control Regulations for Greater Bombay,1991. Mumbai: Government Central Press.


9 Potential for future development In addition to FSI required to rehabilitate the existing occupiers 24 Individual redevelopment of plots: 50% incentive FSI Composite redevelopment of 2-5 plots : 60% incentive FSI 6 or more : 70% incentive FSI Proposal is architecturally based and promote the demolition of large areas of low rise development in the city in favour of high rise development with open area around them 25 C-Ward Island City References: 24 MCGM. (2007). Development Control Regulations for Greater Bombay,1991. Mumbai: Government Central Press. 25 Nandy, M. (2010, 7 September). Real estate funds seek to tap urban redevelopment segment, livemint.com, p. 6. Retrieved from
10 Objectives of the research Analyse the problems faced by mega cities in the developing countries of the tropics, particularly Mumbai Analyse the options currently existing for accommodating future population Derive optimum densities based on infrastructure, urban planning principles and the needs of the city Identify areas with high redevelopment potential Derive optimum mix of uses Derive the correct built-form Derive the architectural/planning interventions needed for a sustainable built environment
11 Methodology Comparative Ecological Footprint Analysis: energy and land required for the production of energy (for transportation and various residential uses), collection of water, disposal wastes, in addition to the land required for the physical development, will be measured in KWhr/m 2 and hectares and expressed in land area equivalent per household per year. Derived from PhD thesis of Sumita Ghosh (2004) 37 which analysed four residential zones of Auckland Reference: 37 Ghosh, S. (2004). Simple sustainability indicators for residential areas of New Zealand. Thesis (PhD, Architecture)-- University of Auckland, 2004.


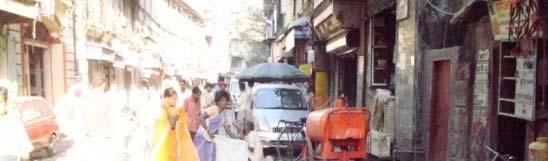

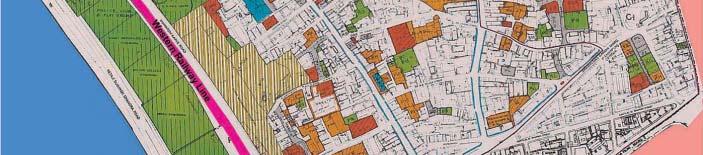
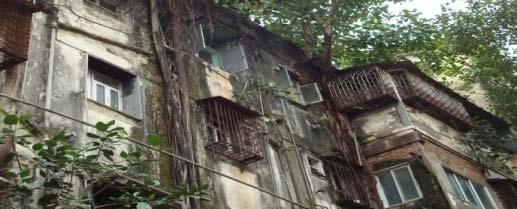

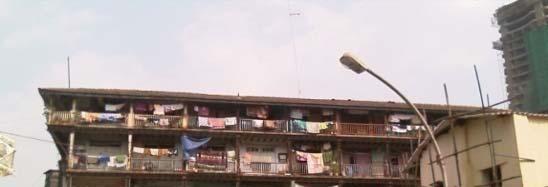


12 Study Area C-ward : - one of the oldest urbanised areas of Mumbai - highest population density in the city - maximum number of dilapidated building - failing infrastructure C-Ward

![Tenement Size 13 sq m (140 sq ft) 27.8 sq m (300 sq ft) 47 sq m (500 sq ft) 75 sq m (750 sq ft) Existing development Population (approx) 1030 people [2] 1305 people [3] - 27% increase No.](/docs-images/94/120133205/images/13-1.jpg "Of Storeys 2-6 30 Notes: [1] Considering incentive of 55% on built-up area required to rehabilitate existing users [2] Considering an average tenement size to be 140 sq ft (13 sq m) and average")
13 Preliminary Study - 1 Selection of typical cluster based on the detail of data already collected for its built form and density Bulk of hypothetical building designed based on the requirements and Development Control Rules of Mumbai Existing Potential Land Area 3725 sq m 3725 sq m FSI Built-up Area sq m sq m [1] - 155% increase Avg. Tenement Size 13 sq m (140 sq ft) 27.8 sq m (300 sq ft) 47 sq m (500 sq ft) 75 sq m (750 sq ft) Existing development Population (approx) 1030 people [2] 1305 people [3] - 27% increase No. Of Storeys Notes: [1] Considering incentive of 55% on built-up area required to rehabilitate existing users [2] Considering an average tenement size to be 140 sq ft (13 sq m) and average household density to be 4.5 persons [3] Considering an average tenement size for rehabilitation to be 27.8 sq m, and additional built up area used for tenement sizes of 47 sq m and 70 sq m; average household density to be 4.5 person Proposed development
14 Preliminary Study - 1 Existing Potential Car Parking < (approx) Estimated CO 2 produced by Cars >2340 Kg/year Kg/year - 71% - 88% increase Amenity Open Space None 930 sq m Roof Area 3375 sq m 385 sq m % reduction Energy Consumption - 50% increase [4] Water Use - 80% increase [5] Existing development RWH potential - 90% decrease [6] Trees [7] CO 2 Sequestering Potential Kg/year 1081 Kg/year % deficit 87-94% deficit Food consumption - 27% increase Notes: [4] Excluding Air conditioning, which is expected to increase (uptake in the existing clusters is approx. 10% of households) [5] Duetoacombinationofanassumed take-back (increased use of water due to improved bathing facilities), watering of trees and other landscaped areas and for washing the increased number of cars [6] Due to significantly reduced roof area [7] At the rate of 5 tree per 100 sq m or part thereof of the said recreational space to be grown within the entire plot (as per DCR for Greater Mumbai, 2007) Proposed development
15 Observations: Preliminary Study - 1 A typical development with increased density (27%) would mean more than double the energy consumption, double the use of water, reduce the amount of rainwater that could be collected or Existing development returned to the ground and reduce the scope for collecting solar energy, causing further strain on the already overloaded infrastructure Encourage a increase in the number of private vehicles, without providing an opportunity to increase road width Proposed development
 3814 persons Estimated Water Requirement 125,289 320,185 m 3 Car Parking 76-267 Estimated CO 2")
 (13.")
 (32.08%) 3852 sq m 5460 sq m unpaved (38.52%) (54.")
![60%) Medium Rise Development Notes: [2] Rainwater from roof top only has been collected for domestic use, whereas](/docs-images/94/120133205/images/16-4.jpg "rainwater falling on paved areas can be used to recharge underground water.")
16 Preliminary Study - 2 Land Area Proposed Built-up Area 10,000 sq m sq m Open Space Required 1733 sq m (20%) Population (approx) 3814 persons Estimated Water Requirement 125, ,185 m 3 Car Parking Estimated CO 2 produced by Cars 17,962 63,103Kg/year No. of Trees (min. required) 87 CO 2 Sequestering Potential 1993 Kg/year 11 05% 0.5 Type of development Medium Rise High Rise No. Of Storeys Roof Area 3264 sq m 1311 sq m (32.64%) (13.11%) Total Rain Water Harvested 5,587.6 m 3 1,845.6 m 3 RWH potential % % High Rise Development Open Space paved 2884 sq m 3208 sq m (28.84%) (32.08%) 3852 sq m 5460 sq m unpaved (38.52%) (54.60%) Medium Rise Development Notes: [2] Rainwater from roof top only has been collected for domestic use, whereas rainwater falling on paved areas can be used to recharge underground water. Total rainwater collected is the total of rainwater collected over the 12 months that is calculated using the formulae
 Population (approx) 3814 persons Estimated Water Requirement 125,289 320,185 m 3")
 87 CO 2 Sequestering Potential 1993 Kg/year 11 05% 0.")
 (13.11%) Total Rain Water Harvested 5,587.")
 (32.")
 Medium Rise Development Notes: [2] Rainwater from roof top only has been collected for")
17 Preliminary Study - 2 Land Area Proposed Built-up Area 10,000 sq m sq m Open Space Required 1733 sq m (20%) Population (approx) 3814 persons Estimated Water Requirement 125, ,185 m 3 Car Parking Estimated CO 2 produced by Cars 17,962 63,103Kg/year No. of Trees (min. required) 87 CO 2 Sequestering Potential 1993 Kg/year 11 05% 0.5 Type of development Medium Rise High Rise No. Of Storeys Roof Area 3264 sq m 1311 sq m (32.64%) (13.11%) Total Rain Water Harvested 5,587.6 m 3 1,845.6 m 3 RWH potential % % High Rise Development Open Space paved 2884 sq m 3208 sq m (28.84%) (32.08%) 3852 sq m 5460 sq m unpaved (38.52%) (54.60%) Medium Rise Development Notes: [2] Rainwater from roof top only has been collected for domestic use, whereas rainwater falling on paved areas can be used to recharge underground water. Total rainwater collected is the total of rainwater collected over the 12 months that is calculated using the formulae
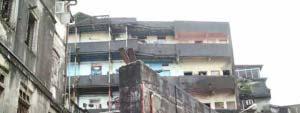
18 Observations: Preliminary Study - 2 Medium rise development has greater potential for rainwater harvesting, electricity generation shading open area High rise development has greater potential ti for CO 2 sequestering ground water recharge High Rise Development Medium Rise Development
19 Methodological Concerns the main driver of environmental impact of human activity is the affluence, although increase in population also has a substantial impact on the environment through energy use and CO2 emissions 38 Vehicular ownership Wider and better roads and more parking space, along with the growing affluence of the people is likely to increase the number of cars owned in the area, but it is difficult to predict the trend. Air-conditioning The level of air-conditioning use in any new development can only be speculated at present but requires further research Water consumption It is difficult to assess the increased use of water due to improved bathing facilities, watering of trees and other landscaped areas and for washing the increased number of cars. Reference: 38 Ranjan, Alok An empirical analysis of environmental impact. In Environmental concerns and sustainable development: Some perspectives from India edited by G. Somayaji and S. Somayaji. New Delhi: TERI Press
20 Thank You