Clean Energy Legislative Academy July 25, 2018
|
|
|
- Cameron Mason
- 5 years ago
- Views:
Transcription
1 Clean Energy Legislative Academy July 25, 2018
2 Energy Policy Overview 1. Trends in emissions 2. Trends in energy generation and consumption 3. State policy trends 4. Energy Economic Development 5. Our 4 Breakout Sessions storage, EVs, grid modernization, renewables 6. CNEE Resources
3 Trends in Emissions
4 1990
5 National Trends in Common Pollutants US EPA Percent Change in Emissions 1990 vs 2016 Sulfur Dioxide -89 Carbon Monoxide -66 Nitrogen Oxides (NOx) -59 Volatile Organic Compounds (VOC) -42 Direct PM2.5-25

6 Avoided Health Impacts Source: US EPA
7 Year 2020 direct cost of compliance by source category (billions of 2006 dollars) Source: US EPA

8 Source: US EPA

9 Source: US EPA


10 Source: US EPA
11
12 Source: US EPA & EIA
13

14

15

16
17
18
19 Thank you. Questions?
20 Trends in Energy Generation & Consumption Tom Plant

21 Electricity has followed a pattern of resource ages
22 Renewables and natural gas comprise most of the capacity additions through the projection period in the Reference case Annual electricity generating capacity additions and retirements (Reference case) gigawatts history projections additions retirements solar wind oil and natural gas nuclear other coal U.S. Annual Energy Outlook (2018) 22

23 TOP STATES FOR SOLAR GROWTH Source: Renewables on the Rise Report, 2018
24 TOP STATES FOR WIND GROWTH Source: Renewables on the Rise Report, 2018

25 TOP STATES EFFICIENCY GROWTH Source: Renewables on the Rise Report, 2018

26
27
28 Energy-related carbon dioxide emissions mirror the trends in energy consumption across cases Energy-related carbon dioxide emissions by sector (Reference Case) billion metric tons of carbon dioxide history projections Energy-related carbon dioxide emissions by fuel (Reference case) billion metric tons of carbon dioxide history projections electric power transportation petroleum natural gas 1.5 industrial 1.5 coal residential 0.0 commercial
 billion kilowatthours 450 400 350 300 250 200 150 100 50 0 2017 history projections 2010 2020 2030 2040 2050 Texas Western Interconnection Eastern Interconnection Utility-scale Small-scale")
29 Projected solar PV cost competitiveness results in growth of solar generation in the Reference case in all interconnection regions Solar photovoltaic electricity generation by region (Reference case) billion kilowatthours history projections Texas Western Interconnection Eastern Interconnection Utility-scale Small-scale 29

30 Source: Dr. Richard Perez, U. of Albany


31
32 Utilities get about 90% of their cost recovery from the states and only 10% from Washington. If you want to implement innovative policy, focus on what happens in the states. ~ CEO of a Western Utility
33 Trends in State Energy Policy
34 WA: 15% x 2020* OR: 50%x 2040* (large utilities) CA: 50% x 2030 NV: 25% x 2025* Renewable Portfolio Standard Policies / February 2017 UT: 20% x 2025* AZ: 15% x 2025* MT: 15% x 2015 CO: 30% by 2020 (IOUs) * NM: 20%x 2020 (IOUs) ND: 10% x 2015 SD: 10% x 2015 KS: 20% x 2020 OK: 15% x 2015 MN:26.5% x 2025 (IOUs) 31.5% x 2020 (Xcel) IA: 105 MW MO:15% x 2021 WI: 10% 2015 IL: 25% x 2026 MI: 15% x 2021* IN: OH: 12.5% 10% x x NY:50% x 2030 VA: 15% x 2025 NC: 12.5% x 2021 (IOUs) SC: 2% 2021 DC ME: 40% x 2017 NH: 24.8 x 2025 VT: 75% x 2032 MA: 15% x 2020(new resources) 6.03% x 2016 (existing resources) RI: 38.5% x 2035 CT: 27% x 2020 NJ: 20.38% RE x % solar by 2027 PA: 18% x 2021 DE: 25% x 2026* MD: 25% x 2020 DC: 50% x 2032 HI: 100% x 2045 Renewable portfolio standard Renewable portfolio goal * Extra TX: 5,880 MW x 2015* U.S. Territories NMI: 20% x 2016 Guam: 25% x 2035 PR: 20% x 2035 USVI: 30% x 2025 credit for solar or customer-sited renewables Includes non-renewable alternative resources 29 States + Washington DC + 3 territories have a Renewable Portfolio Standard (8 states and 1 territories have renewable portfolio goals)

35 Resources for RPS Compliance are shifting from Wind to Solar From 2017 Renewable Portfolio Standards Status Report Lawrence Berkeley National Lab

36 Strategen consulting, llc: Evolving the RPS: A Clean Peak Standard for a Smarter Renewable Future
37
38 Strategen consulting, llc: Evolving the RPS: A Clean Peak Standard for a Smarter Renewable Future

39 Shared Renewables In 2010 there were only 2 shared renewable projects in the US In 2016 there were 100 in 26 states 49% of households and 48% of businesses are unable to host solar. Opens the market to all utility customers including renters Offers low cost power for low income programs

40 Performance Based Regulation Hawaii Utility compensation based on: Stability and affordability of electric rates Reliability Customer Satisfaction and Engagement Public access to utility system information Integration of renewable resources Expansion of customer sited resources Competitive procurement of resources
41 Changing Dynamics Corporate Procurement VW Settlement
42
43 VW Settlement - $15 Billion State Allocations for Environmental Remediation $2.7 National Investment in EV Infrastructure, education/awareness $1.2 Customer Buyback $10.3 National/ California Investment $2.0 California Investment in EV Infrastructure, education/awareness, green cities $0.8
44 State Allocations State $Millions Alaska 7.5 Arkansas Colorado Florida Georgia Illinois 97.7 Iowa Kentucky Maine Minnesota Montana 11.6 Nebraska Nevada New Jersey New Mexico 16.9 North Carolina $2.7 B Distributed to States for Remediation Up to 15% of allocation in each state can be spent on light duty vehicle EV Infrastructure 85% is spent on heavy duty vehicle emissions reductions (can include electrification, diesel upgrades, natural gas, etc ) Ohio Texas Utah Virginia 87.59
45 Possible Questions How can states leverage the EA investment? Are these investments a part of commission planning? Are PUCs empowered to consider Electric Vehicles?
46 Economic Development from the New Energy Economy Suzanne Tegen
47 United States Electricity
48 United States Electricity Prices
49 Jobs in Power Generation
50 Jobs in Fuels

51 Jobs in Energy Efficiency 2.25 million workers spent some or all of their time working with EE technologies and services n 2017.
52 Energy projects produce an economic ripple effect.


53 Economic Ripple Effect from Jobs and Economic Impacts from the JEDI Model Wind Energy JEDI Model Version W e Project Development & On-site Labor Impacts Construction workers Management Administrative support Cement truck drivers Road crews Maintenance workers Legal and siting Local Revenue, Turbine, & Supply Chain Impacts Blades, towers, gearboxes Boom truck & management, gas and gas station workers; Supporting businesses, such as bankers financing the construction, contractor, manufacturers, and equipment suppliers; Utilities; Hardware store purchases and workers, spare parts and their suppliers Induced Impacts Jobs and earnings that result from the spending supported by the project, including benefits to grocery store clerks, retail salespeople, and child-care providers Construction Phase = 1-2 years Operational Phase = 20+ years Source: National Renewable Energy Laboratory 53
54 Free Tool That Estimates Jobs: NREL s Jobs and Economic Development Impacts Models Land-based wind Jobs and Economic Development Impacts (JEDI) model first developed in 2004 to estimate impacts from wind energy development and operations. Models available for solar, geothermal, biomass, biogas, ethanol, wind, and many other resources. JEDI is meant to be easy to use yet economically sound, and produces gross, not net, impacts. Default data used for general estimates. Model users can update data with their own to provide estimates that more closely reflect specific projects. The JEDI model s outputs are reported in full-time equivalent (FTE) jobs. Onsite impacts are validated periodically (e.g., Billman and Keyser, 2013). Installed costs and O&M costs are updated annually. Search NREL JEDI model or go to nrel.gov/analysis/jedi/


55 Project Development & Onsite Labor Impacts Sample job types o Truck driving o Crane operation, hoisting, rigging o Management, support o Earth moving o Panel installation o Cement pouring o Siting Photo: GRID Alternatives Photo Credit: NREL Photo Credit: Suzanne Tegen Photo from Sally Wright, Renewable Energy Research Lab - Umass, NREL


56 Local Revenues, Turbine, Module, & Supply Chain Impacts Sample Job Types o Steel mill jobs, parts, services o Equipment manufacturing and sales o Module, blade and tower manufacturers o Property taxes, financing, banking, accounting Photo from istock NREL Image Gallery Photo from istock Photo from istock Photo from istock


57 Induced Impacts are real Money spent in the local area on goods and services from increased revenue, including: hotels, sandwich shops, grocery stores, clothing, other retail, public transit, cars, restaurants, and medical services. Photo from istock Photo from istock Photo from istock Photo from istock Photo from istock

58 Jan and Virgil Kochis, Rush Creek Wind Farm Landowners 58

59 Example from Colorado: Rush Creek Wind Farm Multiplier Effect on Colorado On-site Impacts Construction Phase FTE jobs $26.8 million- $35.6 million in economic output Operational Phase jobs $1.9 million- $2.2 million/year in economic output Local Revenue, Turbine and Supply Chain Impacts Construction Phase 1,843-2,616 jobs $412.7 million -$564.2 million in economic output Operational Phase jobs $22.2 million-$23.3 million/year in economic output Induced Impacts Construction Phase 840 jobs-1,166 jobs $128.7-$178 million in economic output Operational Phase jobs $8.8 million-$9.3 million/year in economic output Construction Phase: 18 months Operational Phase: 25 years NREL 59

60 Rush Creek Wind Farm Multiplier Effect: 4-county Impacts On-site Regional Impacts Construction Phase FTE jobs $1 million-$1.3 million added to GDP Operational Phase jobs ~$1 million/ year in economic output Regional Revenue, Turbine and Supply Chain Impacts Construction Phase jobs $67.9 million-$107.3 million in economic output Operational Phase jobs ~$7 million/year in economic output Induced Regional Impacts Construction Phase jobs $7 million-$7.1 million in economic output Operational Phase 7 jobs $1.1 million/year in economic output Construction Phase: 18 months Operational Phase: 25 years NREL 60

61 Wind Energy Supports Landowners Financially Wind energy is seen as another cash crop: $267 million in landowner lease payments in 2017 across U.S. $1.8 million to region = annual estimated landowner lease payments from Rush Creek. Annual land lease payments are per turbine or percentage of gross sales from generation - whichever is higher. Additional income provides stability for farmers and ranchers. Farms and ranches near Rush Creek are primarily for dryland farming of wheat, corn, millet, and beef cattle. Turbine payments help offset decrease in farm revenues during drought and other hard years. Rush Creek Wind Farm, 2018 NREL 61

62 Wind Power Allows the Next Generation to Stay on the Farm Tucker Family, Oklahoma Wind energy is helping me pass our fourth-generation farm to our son. I ve been nothing but happy with my turbines and the whole process, said David Hanson, a landowner that hosts 3 Lakefield Wind turbines on his property. (Minnesota)

63 Cash Crop for Farmers and Ranchers 70 percent of the revenue from wind energy goes to landowners who live in counties with below average incomes, providing a welcome source of new income (2015). Landowners with wind turbines on their property invest twice as much money into their farms for things like home improvements, outbuildings, and equipment, than landowners who lived in townships without windfarms. They also purchase more farmland and plan for their farm to continue in the future. (Mills, 2014) Photo: Red River Mutual Source: NREL 63
64 Economic Development Impacts from Clean Energy Construction jobs in rural areas Long-lasting, well paying operations jobs in rural areas Manufacturing, supply chain, logistics jobs Domestic manufacturing content is high for wind power Indirect jobs (steel, cement, trucking, business services) Increased revenue for local businesses Land-owner payments for leased land and good neighbor payments Property tax revenue for rural counties (for schools, roads, etc.) Rural areas can save schools, keep young people American energy independence Cleaner air, cleaner water, less pollution, fewer asthma cases
65 References and Resources on Energy Economics and Clean Energy WINDExchange Jobs and Economic Development Impacts models: U.S. Energy and Employment Report (2018) by NASEO and the Energy Futures Initiative: Wind on the Wires Clean Transportation Deployment Renewable Energy Integration and Optimization (REopt): Advanced Vehicles and Alternative Fuels Laws and Incentives by State:

66 Thank you. Center for the New Energy Economy
67 OUR 4 BREAKOUT SESSIONS Electrification of Transportation Energy Storage Mainstreaming Renewables Grid Modernization
68
69 Utility Planning Horizon

70 TOP STATES EV SALES

71 TOP STATES PUBLIC CHARGING INFRASTRUCTURE
72 Projected Energy Storage Utility Acquisition Horizon
73 First Quarters of Energy Storage

74 LEADING STATES FOR ENERGY STORAGE
75 Mainstreaming Renewables
76 Number of States* MT ND* OK* SD* TX WI ME CO CT KS* MD MA NM WA MI MO NC PA SC* IN* MN NH UT* VA* DE IL OH RPS Target Dates 10 5 NJ CA NY DC VT RI OR HI 0 * States with a voluntary goal. Target Year

77 LEADING STATES - PERCENTAGE OF RENEWABLE ENERGY
78 10 or more actions in Q Grid Modernization 2017 Grid Modernization DC No action in actions in Q actions in Q actions in Q3 2017
79 Grid Modernization Most Common Types of Policies in 2017
80 CNEE Resources
81 Over 2,600 Energy Bills LEGISLATION ENACTED BY YEAR AND TOPIC Transportation Regulatory Natural Gas Development Infrastructure Financing & Financial Incentives Energy Efficiency Emissions Electricity Generation Economic Development
82

83
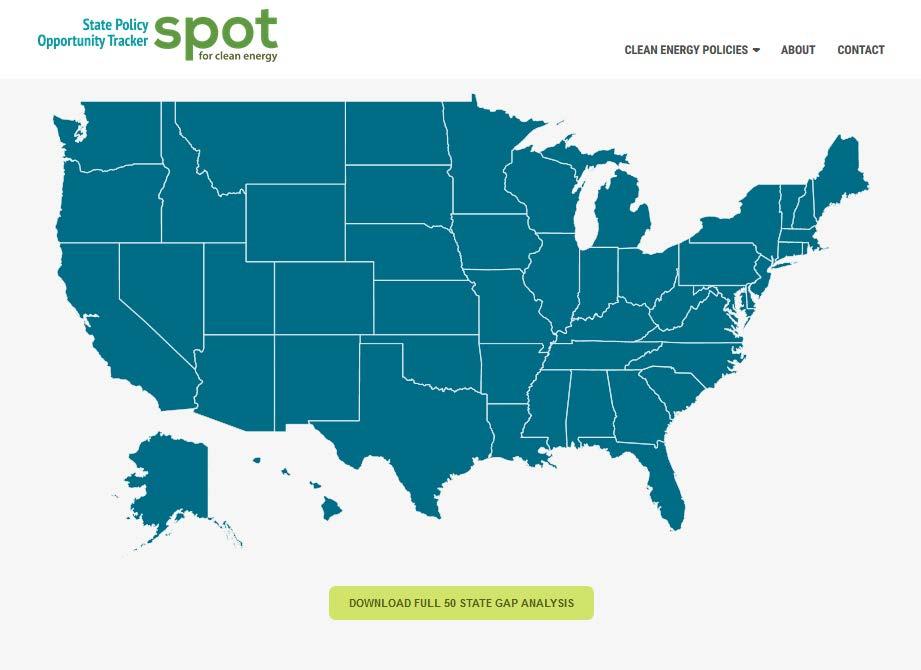


84 SPOTforCleanEnergy.org


85 itunes Amazon Online
86 Thank you!