Creating Sustainable Neighborhoods
|
|
|
- Lizbeth Tucker
- 5 years ago
- Views:
Transcription
1 Creating Sustainable Neighborhoods Reducing GHG Emissions & Meeting Consumer Demand through Community Planning & Land Use Regulation Jeffrey P. LeJava, Esq. Senior Staff Attorney & Adjunct Professor Land Use Law Center at Pace Law School
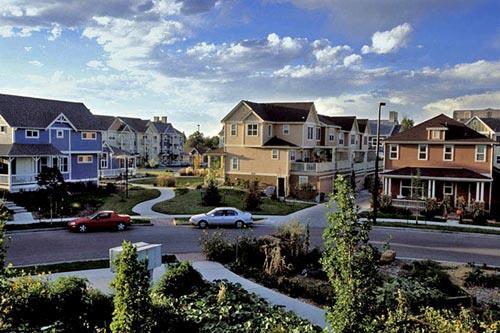
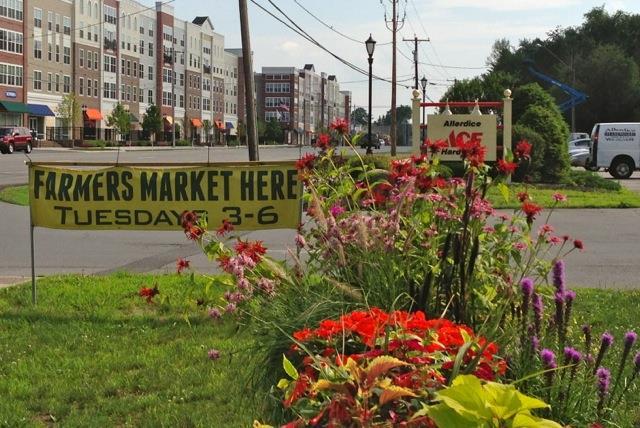
2 What is a sustainable neighborhood? Compact, walkable (pedestrian-oriented) with mixed uses Transit-oriented (or at the very least transportation efficient) Variety of housing options Energy efficient Integrates natural features & processes Promotes use of renewable energy Encourages local food production Economically resilient & equitable (i.e., it s Smart Growth)


3 Bethesda, MD


4 Mashpee Commons, Cape Cod, MA


5 Greater water conservation Lower household water costs Improved air quality Fewer vehicle miles travelled Greater economic efficiencies: lower infrastructure costs Energy savings lower household energy costs Personal and Community Benefits of Sustainable Neighborhoods


6 Climate Change Changing Demand Two issues are pushing us towards sustainable neighborhoods


7 Including 2013, 9 of the 10 warmest years in the 134-year period of record have occurred in the 21 st century Sea levels are rising around the world The world s oceans are acidifying Communities are having to adapt - Sidney, New York Climate Change is Occurring Now

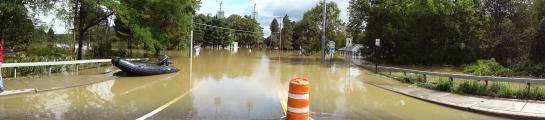

8 Sydney, NY

9 Between now and 2040, the U.S. will add an additional 70 million residents that must be housed and feed 66% of buildings on ground by 2050 will be built between now and then 39% of our carbon emissions come from buildings according to DOE estimates while 33% emanate from transportation The Built Environment & GHG Emissions
10 Compact, walkable development Is 35% to 40% more energy efficient than conventional development Reduces VMTs between 10% and 40% depending upon the number of units in a community that are located in sustainable neighborhoods Example savings 600 units Reduces GHG emissions by 17.6 MTCDE per year Reduces VMT per year by 1,191,360 miles

11 Changing Demand = Changing Demographics & Changing Preferences

12 Number of Seniors by Decade Source: Arthur C. Nelson, Metropolitan Research Center, University of Utah

13 Changing Demographics Household Type HH with Children 45% 33% 27% HH without Children 55% 67% 73% Source: Arthur C. Nelson, Metropolitan Research Center, University of Utah.


14 Millennial generation 2/3 wish to live in walkable places and town centers, whether in the inner city or in suburbs. A third will pay more for walkability, and half will trade space for it. Changing Preferences
 In 2012 average cost of car ownership: $9,000 (AAA) On")
15 Why Do New Households Want to Live in Sustainable Neighborhoods? Housing and Transportation Affordability Families can save $10,118/year using transit (American Public Transit Association) In 2012 average cost of car ownership: $9,000 (AAA) On average, housing and transportation costs consume 59% of residents income for the 25 largest metropolitan statistical areas


16 How are sustainable neighborhoods realized?

17 Incorporating compact, mixed use, transitoriented development into long range comprehensive plans Comprehensive Planning


18 Highlands at Morristown, NJ
19 Infill Development

20 Adoption of Downtown Overlay District that: Seeks to shape new development and renovation of existing projects which promote increased health, safety, comfort and convenience Establishes requirements regulating: Mixed uses Design requirements that foster TND Reduced parking requirements Works in conjunction with downtown design guidelines Malta, Saratoga County, NY
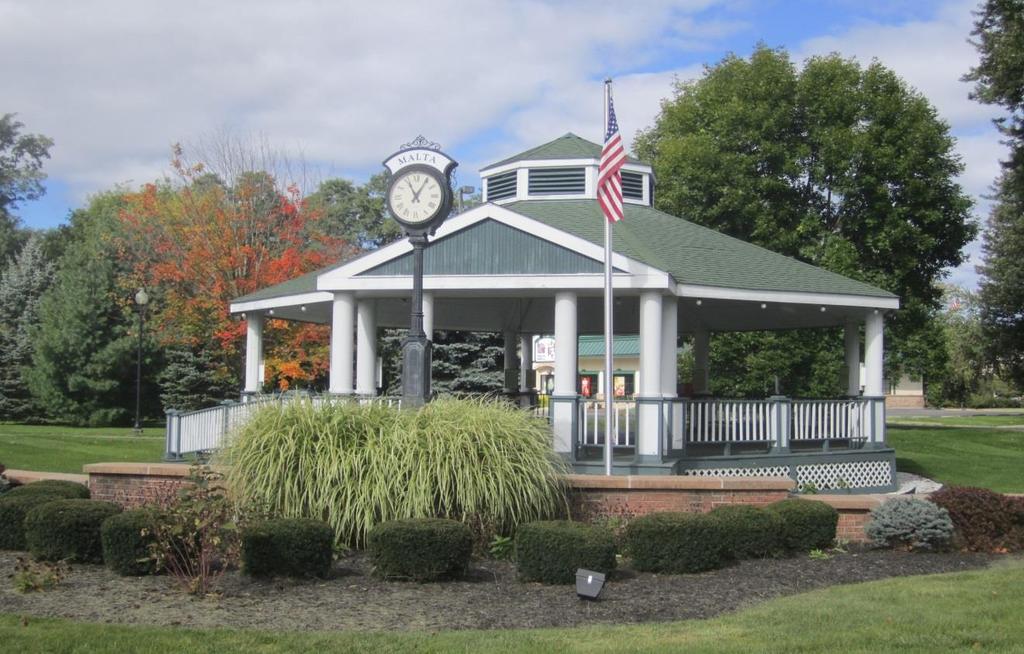


21 Malta, NY


22 Bonus density zoning awarded 10% bonus in residential units New homes must meet Energy Star standards Blooming Grove, NY Case Study


23 Implementing Design: Complete Streets Complete Streets seek to safely and comfortably accommodate all users of roadways, including pedestrians, cyclists, and public transit riders. All modes of travel are keep in mind as facilities are planned, designed and constructed. Goal is to establish a comprehensive, integrated, connected network for all modes of transportation, including encouraging street connectivity. Complete Street policies often include the latest and best street design criteria and guidelines while being context sensitive and flexible.


24 Zoning In Renewable Facilities Reduce barriers o Except from height limitations Special use permits o Roof top wind turbines o On site solar arrays Accessory Use provisions o Add turbines and solar to list of permitted accessory uses

25 Where do you start?
26 Audit local plans and land use regulations

27

28

29

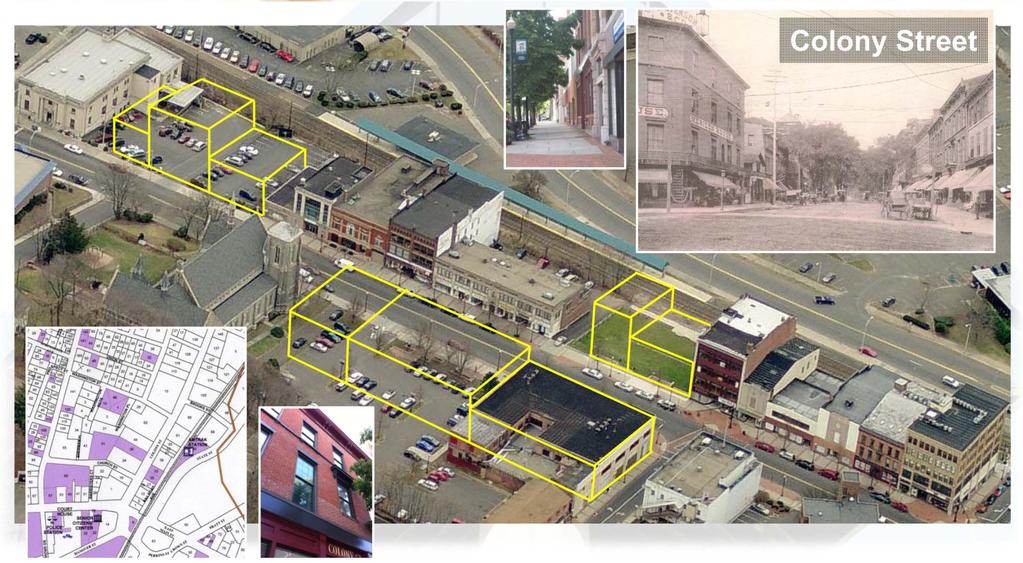
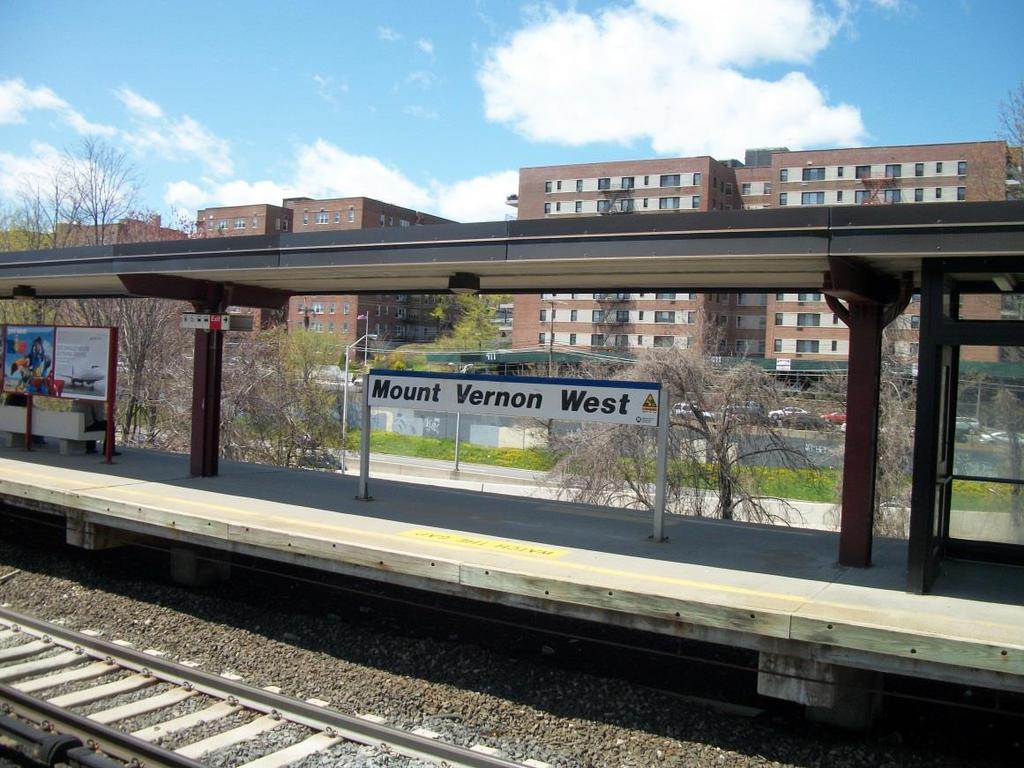
30

31

32

33

34
35 Introduction and Users Manual Table of Contents I. Integrating LEED-ND into Local Plans II. III. IV. Incorporating LEED-ND into Traditional Zoning Code Elements Incorporating LEED-ND into Site Plan and Subdivision Regulations Incorporating LEED-ND into Supplemental Development Standards V. Including LEED-ND in Non- Regulatory Initiatives VI. Project Streamlining and LEED-ND Incentives & Assistance
36 Introduction and Users Manual Three Ways to Use the Manual 1. Audit & amend existing plans & codes 2. Establish a new comprehensive approach 3. Target specific areas


37 Incorporating LEED-ND into Traditional Zoning Code Elements Use, Density, and Bulk & Area Requirements Parking & Loading

38 Mount Vernon, NY


39 Case Study: Draft Mixed Use (MX) District Target Area: Mount Vernon Avenue corridor and South West Street Medium density, commercial development within ½ mile of Mount Vernon West Metro-North RR Station Currently zoned: Industrial Commercial Business Neighborhood Business Apartment House Surrounded by residential uses
40 Case Study: Draft Mixed Use (MX) District DRAFT Use Requirements Multifamily dwellings Community purpose buildings Business, professional or governmental offices Stores and shops exclusively for sales at retail or the performance of customary personal services Museums and/or art galleries Hotels and motels Bars Bakeries, retail Restaurants Banks Theaters and/or concert halls Animal hospitals Schools, day-care centers, nursery schools (special use permit)

 Live-work spaces")
41 Case Study: Draft Mixed Use (MX) District Evaluation Using: TGM Strategy 2.1 Mixed Uses NPDc3, Mixed-Use Neighborhood Centers & LEED-ND Diverse Use Appendix Additional uses identified from LEED-ND criteria: Food retail (supermarkets, food stores with produce, farmers market) Community-serving retail (clothing, hardware, pharmacy) Services (hair care) Civic and community facilities (adult/senior care, family entertainment, government offices that serve public on-site, social services) Live-work spaces Produce gardens, green houses On-site renewable energy generation systems
42 Case Study: Draft Mixed Use (MX) District DRAFT Building Height Requirement o shall not exceed 42' feet in MX-42 o shall not exceed 90' feet in MX-90

43 Case Study: Draft Mixed Use (MX) District Evaluation Using: TGM Strategy 2.10 Taller Building Heights NPDp1 & NPDc1, Walkable Streets Minimum building height-to-street-width ratio of 1:3 Building height meets LEED-ND criteria: Existing street widths Mount Vernon Ave: ~62 ft Macquesten Pkwy N: ~113 ft S West St: ~34 ft Minimum building heights to meet 1:3 ratio Mount Vernon Ave: 21 ft Macquesten Pkwy N: 38 ft S West St: 11 feet
44 Case Study: Draft Mixed Use (MX) District DRAFT Density Requirements o Undecided o Existing Apartment House District (RMF-15) minimum lot size: 15,000 ft 2 minimum lot area/du: 2,250 ft 2 for the first two units 660 ft 2 for each additional unit o Existing Neighborhood Business (NB) 1.0 FAR

45 Case Study: Draft Mixed Use (MX) District Evaluation Using: TGM Strategy 2.8 Greater Development Densities NPDp2 & NPDc2, Compact Development within a half-mile of heavy rail: >12 du/ acre of buildable land > 0.80 FAR Minimum densities meet LEED-ND criteria: minimum lot size & minimum lot area/du convert to ~19 du/acre & ~66 du/acre maximum FAR is 1.0

46 Case Study: Draft Mixed Use (MX) District DRAFT Setback Requirements Front Yard Setback - front property line Secondary Front Yard Setback - secondary front property line Side Yard Setback - side property line Rear Yard Setback - rear property line - possible buffer
47 Case Study: Draft Mixed Use (MX) District Evaluation Using: TGM Strategy 2.11 Reduced Building Setbacks NPDp1 & NPDc1, Walkable Streets 18 to 25 feet from property lines on pedestrian realm Building façades within 1 ft of sidewalk along mixed-use and nonresidential streets Setbacks meet LEED-ND criteria: At property lines Potential buffer in rear of property between mixed uses and residential neighborhood will not interfere with pedestrian realm
48 Gentrification & displacement Density myth Creating critical mass for livability (center of activity) Political challenges Challenges to address

49 Creating Sustainable Neighborhoods Thank you! Jeffrey P. LeJava, Esq. Senior Staff Attorney & Adjunct Professor Land Use Law Center at Pace Law School