NaGISA and DIWPA ---- as examples for strategic implementation plan of globalscale and long-term biodiversity monitoring program
|
|
|
- Scott Patterson
- 5 years ago
- Views:
Transcription
1 NaGISA and DIWPA ---- as examples for strategic implementation plan of globalscale and long-term biodiversity monitoring program Yoshihisa Shirayama Field Science Education and Research Center, Kyoto University
2 GEO and Biodiversity Biodiversity is the most difficult target to carry out long-term global-scale observation Impossible to apply satellites Impossible to apply monitoring censers Heavily dependent on human power Specialized knowledge to identify species is prerequisite
3 Key issue International collaboration Participation of none scientists Commitment of governmental body
4 DIWPA: DIVERSITAS in Western Pacific and Asia

5 14 Steering Committee Members Charters 400 members from 41 countries Secretary Office C/o Center for Ecological Research Kyoto University

6 DIWPA-IBOY ( ) Promoting standardized sampling & monitoring of ecosystems and biodiversity Forest ecosystems Fresh water ecosystems Coastal marine ecosystems Island ecosystems Protocol manuals DIWPA website
7 DIWPA future direction: Partnership with global-change programs Biodiversity/ecosystem changes feeds back to global environments New unifying projects: Carbon and Biodiversity (Relating to REDD in GEOSS) Landscape change and biodiversity (Relating to monitoring in GEOSS)

8 Mount Kinabalu (4095m) in Borneo Air Dryness Daily evaporative demand Ea and Rainfall (mm/day) m m 1998 Running day from 1996 Evaporation Rainfall m m Leaf litter Fl/Fr litter Twig litter Running day from Data source K. Kitayama
 Starting")

9 Lake Biwa: Long-term monitoring with biological archives (specimens) Starting from 1914 Over 3000 specimens from aquatic ecosystems Lake Biwa The Kyoto University Museum
10 Data source N. Okuda Decadal changes in trophic levels of three functional feeding groups in fishes Trophic level (a) Planktivorous fish Gymnogobius isaza Gnathopogon caerulescens Plecoglossus altivelis altivelis (b) Benthivorous fish Rhinogobius sp. Biwia zezera Pseudogobio esocinus esocinus (c) Carnivorous fish Opsariichthys uncirostris uncirostris Cottus reinii s10s 20s 30s 40s 50s 60s 70s 80s 90s 2000s Eutrophication * * * * * * * * * * * * Biological invasion
11 Use of stable isotopes and radiocarbon for ecosystem monitoring Study of carbon cycling using 14 C Mainly Chronology Environmental science under global warming Carbon turnover e.g. Organic and inorganic carbon transfer from terrestrial to aquatic ecosystems. Raymond, P.A. (2005) Nature 436:
12 Food web structure using carbon and nitrogen stable 14 C( ) isotopes and radiocarbon C( ) in atmospheric CO 2 The Bomb carbon pulse year 14 C dating using bomb pulse Photosynthesis Food web Grazing food chain Detritus food chain Grazing food chain Detritus food chain Trophic level 4 3 Depending on the current year photosynthesis Depending on photosynthesis 10 years ago Decomposition process Soil organic matter Static food web years old Food web considering carbon age

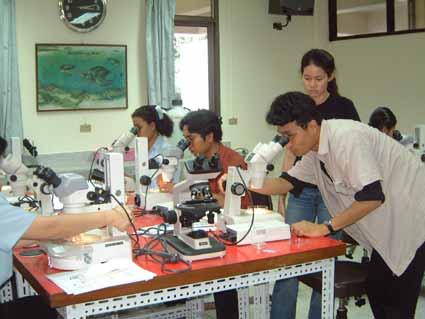
13


14 Natural Geography In Shore Areas Natural Geography In Shore Areas nagisa is the Japanese word for the area where the ocean meets the shore, it implies the whole shore ecosystem

15 Natural Mission Geography Statement In Shore Areas To discover, describe and record the biodiversity of the worlds costal zones and the changes in it over time

16 Project Description A collaborative initiative aimed at establishing an initial baseline of biodiversity in the near shore Promoting wide-scale, standardized sampling To highlight patterns and changes in biodiversity of the worlds coast Dedicated to involving local researchers and communities To create a capable foundation for long-term coastal monitoring programs


17 From 1 m Basic Idea of NaGISA Sampling Even closer coastal biota following the same protocol Why the same protocol? From 10 cm
 protocol as simple as possible to")

18 Protocol habitat: macroalgae (hard bottom), seagrass bed (soft bottom) protocol as simple as possible to let non-scientists and developing country people to join to sample for a long time to monitor environmental change


19 Problems to be overcome Need many sampling sites Participation of citizens


20 Joint sampling with developing country scientists


21 Lacking of specialists in taxonomy Training parataxonomists through workshop 1st workshop on Polychaetes held in September, workshops have been held

22 Supervising identification


23 Global Scope Global Scope

24 Global Scope of Project 2 Global Scope of Project 2 NaGISA Sites HNS Sites Sites
 Enhance global taxonomic studies Accelerate the study of")
25 NaGISA Deliverables Scientific Provide basic information: a global pattern of biodiversity based on comparable data The frame work for a long term monitoring program for biodiversity (invasive species) Enhance global taxonomic studies Accelerate the study of Meiofauna
 available through NaGISA online and OBIS for researchers, decision makers, stake-holders and the general public (management success,")
26 NaGISA Deliverables Education Taxonomic and para-taxonomic training Enhance public awareness of marine organisms and marine diversity Make pertinent timely information (data) available through NaGISA online and OBIS for researchers, decision makers, stake-holders and the general public (management success, sustainability)
27 Work Locally Study Globally ata becomes available for research, education and ecision making around the world Internet participants NaGISA server OBIS users
28 NaGISA

29

30 OBIS Datapoints

31
32 Numbers of species Total OBIS Total world % in OBIS Vertebrata 13,887 14,272 97% vertebrates Nematoda 2,004 4,200 48% round worms Cnidaria 3,516 7,598 46% anemones+corals+ Annelida 2,594 8,080 32% worms * Other 629 2,197 29% other Tunicata 241 1,286 19% tunicates Crustacea 5,584 30,472 18% crustaceans Mollusca 5,708 32,813 17% molluscs Pycnogonida % sea spiders * Echinodermata 802 6,700 12% echinoderms Bryozoa 528 5,700 9% mat animals * Nemertea 115 1,250 9% ribbon worms * Porifera 310 6,000 5% sponges Platyhelminthes 0 6,795 0% flatworms *


33 Maximizing Coral Reef Biodiversity 1880 by conserving sites with long-term optimal temperature & ph conditions for calcification
34 Conclusion Global-scale, long-term monitoring of biodiversity can be implemented by international collaboration Current data will serve as a baseline for monitoring change of biodiversity Database is essential to utilize the data obtained Analyses of data will contribute prediction of ecosystem change in the future
35 Thank you