Eliza Moore Environmental Scientist Narragansett Bay Commission
|
|
|
- Asher Lamb
- 5 years ago
- Views:
Transcription
1 Eliza Moore Environmental Scientist Narragansett Bay Commission

2 Bacterial contamination Metals in sediments Loss of wetlands, habitat, & eelgrass Excessive nutrient loads Dissolved oxygen impairments hypoxia and anoxia
 Other factors contributing to hypoxia: Weather - hot, calm summer periods Stratification Freshwater flows Reduce anthropogenic nitrogen to reduce hypoxia?")
3 Phytoplankton & algae blooms Blooms collapse, decomposition consumes dissolved oxygen (DO) Hypoxia (<2.9 mg/l DO) Anoxia (0.0 mg/l DO) Other factors contributing to hypoxia: Weather - hot, calm summer periods Stratification Freshwater flows Reduce anthropogenic nitrogen to reduce hypoxia? Fish kill in Greenwich Bay 2003 accelerated plans by RIDEM to initiate N reductions at WWTFs
4 2005 TN limits (May October): Bucklin Point - 5 mg/l and 1,293 lbs/day Field s Point - 5 mg/l and 2,711 lbs/day Require major WWTF modifications to achieve! 2006 Consent Agreement (CA): Bucklin Point - what could be achieved with the current system? 8.5 mg/l, measure and report lbs/day Field s Point - plan and implement new construction 18.2 mg/l, measure and report lbs/day Both plants to meet 5 mg/l TN by 2014
 Upgrade to meet 5 mg/l complete in 2014, permit in effect on July 15 th, 2014. 2014 seasonal average = 4.")
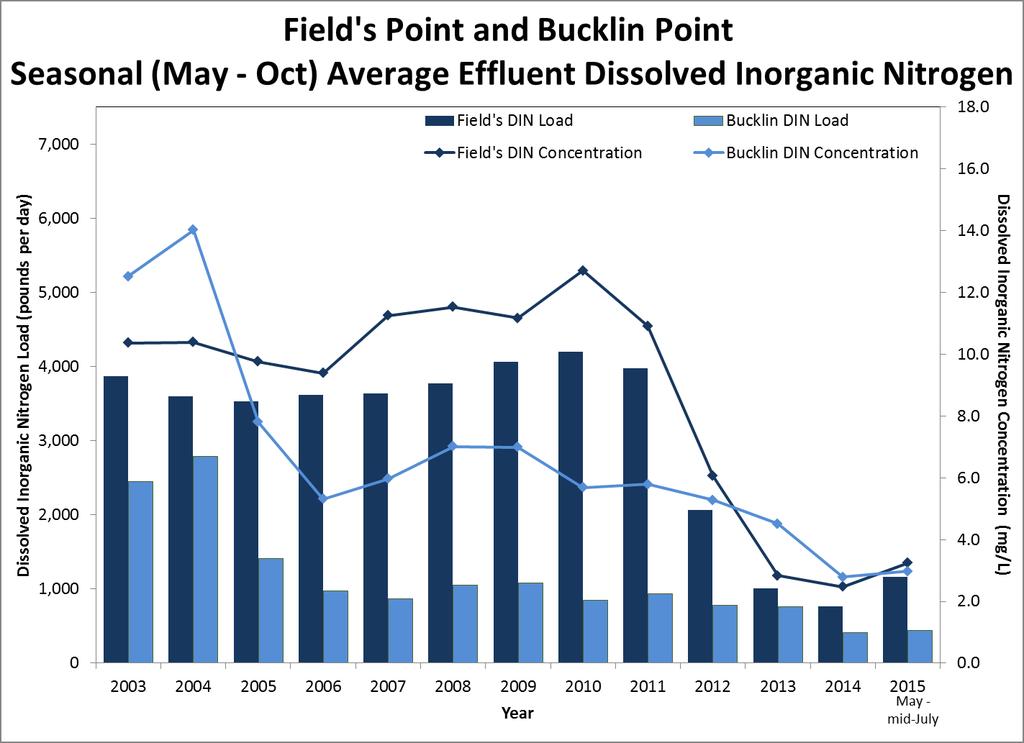
5 Bucklin Point Biological Nutrient Removal Upgrade to meet seasonal 8.5 mg/l TN in 2005/ $8.3M (out of total $59M plant upgrades) Upgrade to meet 5 mg/l complete in 2014, permit in effect on July 15 th, seasonal average = 4.0 mg/l Reduced 2,319 lbs TN/day vs Nitrogen Upgrade Cost ~$13 Million


6 Field s Point Biological Nutrient Removal Integrated Fixed Film Activated Sludge (IFAS) Largest in the world achieving such a low effluent limit! Construction completed in mg/l Permit limits in effect on May 1, seasonal average = 3.4 mg/l Reduced 4,782 lbs TN/day vs Nitrogen Upgrade Cost ~$31 million
7 Organic Nitrogen Dissolved Inorganic Nitrogen (DIN) Particulate Organic Nitrogen (PON) Diss. Organic Nitrogen (DON) Ammonia (NH4 + ) Nitrite (NO 2- ) Nitrate (NO 3 - ) Total Dissolved Nitrogen (TDN) Total Nitrogen (TN) DIN is the most bio-available form of N for use in primary production by plants & algae

8
9
10 5 mg/l 8 mg/l NBC Field s Point Cranston NBC Bucklin Point West Warwick East Greenwich Warwick Warren Smithfield (10 mg/l) East Providence (5.9 mg/l) Northbridge (max. extent) Woonsocket (3 mg/l) Burrillville (max. extent) UBWPAD North Attleborough Attleboro Grafton Uxbridge **Not all facilities currently meeting these limits - Construction ongoing**

11 Nitrogen Reductions Realized
12


13 NBC monitoring program one of the most extensive in the region Provides data & sound science needed to address regulatory mandates, protect ratepayers Nutrients are monitored in the upper bay and tributary rivers, including major rivers at the state border

14 57 MGD Blackstone River Basin 679 MGD Pawtuxet River Basin 271 MGD 30 MGD 80 MGD Taunton River Basin 363 MGD Major sub-watersheds WWTFs Urban Agricultural Industrial Rural/Residential East Greenwich Basin 18 MGD* 57 MGD * Estimates from Kincaid

15 Measured bi-monthly at 15 sites in RI & MA Total N loading USGS river flow data Rivers with flow data: Blackstone River Moshassuck River Woonasquatucket River Pawtuxet River Taunton River Ten Mile River Palmer River*

16 Relatively high DIN concentrations at Ten Mile River and Pawtuxet River. Moderately high DIN at Blackstone River and Taunton River

17 Highest loads Blackstone River Taunton River and Pawtuxet Rivers also substantial Ten Mile River - high concentration, but low flow Moshassuck and Woonasquatucket low flow & concentration


18 NBC = 17% DRY Weather Days <0.1 inch of rain over prev. 3d NBC = 24% WET Weather Days

19 Since 2007 Nutrients measured bi-monthly Surface & bottom Collect at various stages of the tidal cycle throughout the year Nutrient suite includes: Nitrite/nitrate Nitrite Total Dissolved Nitrogen Ammonia Orthophosphate Silicate Chlorophyll a Total Suspended Solids Determine impact of NBC s BNR systems & inform stakeholders


20 Nitrogen TMDL not yet developed for Narragansett Bay

21 May October 2014 Rainfall Total: inches Station DIN (mg/l) Good <0.1 Fair Poor >0.5 DIN (mg/l) Phillipsdale Landing India Point Park Edgewood Yacht Club Pomham Rocks Pawtuxet Cove Bullock's Reach Conimicut Point EPA CCR Category

22

23 Total Nitrogen Loading and Rain
24 Hypoxia and rainfall correlated Hypoxia and DIN not correlated Rainfall increases point source and non-point source loads Rainfall contributes to stratification Hypoxia and Rainfall
25 Where Do We Go From Here? Will point-source reductions in nitrogen load lead to reduced hypoxia? 5-10 year delay in environmental response to N reductions & some area plants still coming online Hypoxia impacted by many environmental factors in addition to anthropogenic eutrophication What are the next steps?
26 NBC Load to Upper Bay *Projected loadings based on average flow Concentration (mg/l) Loading (lbs/day) Percent Reduction from 2003 Loading Field's Point ,834 (projected) 5 mg/l 5.0 1,756 70% (projected) 3 mg/l 3.0 1,054 82%
27 NBC Load to Upper Bay *Projected loadings based on average flow Concentration (mg/l) Loading (lbs/day) Percent Reduction from 2003 Loading Field's Point ,834 (projected) 5 mg/l 5.0 1,756 70% (projected) 3 mg/l 3.0 1,054 82% Bucklin Point ,908 (projected) 5 mg/l % (projected) 3 mg/l %
28 NBC Load to Upper Bay *Projected loadings based on average flow Concentration (mg/l) Loading (lbs/day) Percent Reduction from 2003 Loading Field's Point ,834 (projected) 5 mg/l 5.0 1,756 70% (projected) 3 mg/l 3.0 1,054 82% Bucklin Point ,908 (projected) 5 mg/l % (projected) 3 mg/l % Combined NBC 2003 FP: 15.7 BP: ,741 (projected) 5 mg/l 5.0 2,528 71% (projected) 3 mg/l 3.0 1,517 83%
29 NBC Load to Upper Bay *Projected loadings based on average flow Concentration (mg/l) Loading (lbs/day) Percent Reduction from 2003 Loading Field's Point ,834 (projected) 5 mg/l 5.0 1,756 70% (projected) 3 mg/l 3.0 1,054 82% Bucklin Point ,908 (projected) 5 mg/l % (projected) 3 mg/l % Combined NBC 2003 FP: 15.7 BP: ,741 (projected) 5 mg/l 5.0 2,528 71% (projected) 2014 Conc. FP: 3.4 BP: 4.0 1,812 79% (projected) 3 mg/l 3.0 1,517 83% Upgrade to 3 mg/l TN may reduce ~295 Pounds of Nitrogen per Day
30 Average Nitrogen Loading at Field s Point vs. Estimated Greenhouse Gas Emissions (Electricity Use)
 prohibitive Dissolved Organic Nitrogen impairs WWTF s ability to reliably")
31 Water Environment Research Foundation Report 2011 Nitrogen removal to 3 mg/l = negative sustainability impacts for small water quality improvements CO2 emissions and costs (capital and operational) prohibitive Dissolved Organic Nitrogen impairs WWTF s ability to reliably achieve low TN.

 to")
32 Looking Ahead WWTF upgrades have substantially reduced point-source nitrogen loadings DIN in the upper Bay fair-good in 2014 Impacts on hypoxia to-be-determined with more time Further reductions by WWTFs may have diminishing returns Increasing financial and environmental cost Non-point sources of nitrogen become more significant Alternate approaches to reducing nitrogen impacts Address non-point sources through fertilizer/stormwater controls Restoration of shellfish (oyster reefs) to increase resilience

33 NBC Environmental Monitoring and Data Analysis crew NBC Laboratory Policy, Planning, & Regulation staff