Energy Efficiency: What is The Role of a City? January Barry Hooper, Green Building Coordinator San Francisco Department of the Environment
|
|
|
- Justin Pitts
- 5 years ago
- Views:
Transcription

1 Energy Efficiency: What is The Role of a City? January 2014 Barry Hooper, Green Building Coordinator San Francisco Department of the Environment
2 Agenda Impetus for Action Energy Efficiency: California looms large SF Policy Framework Existing Commercial Buildings ordinance: Early results Resources


3
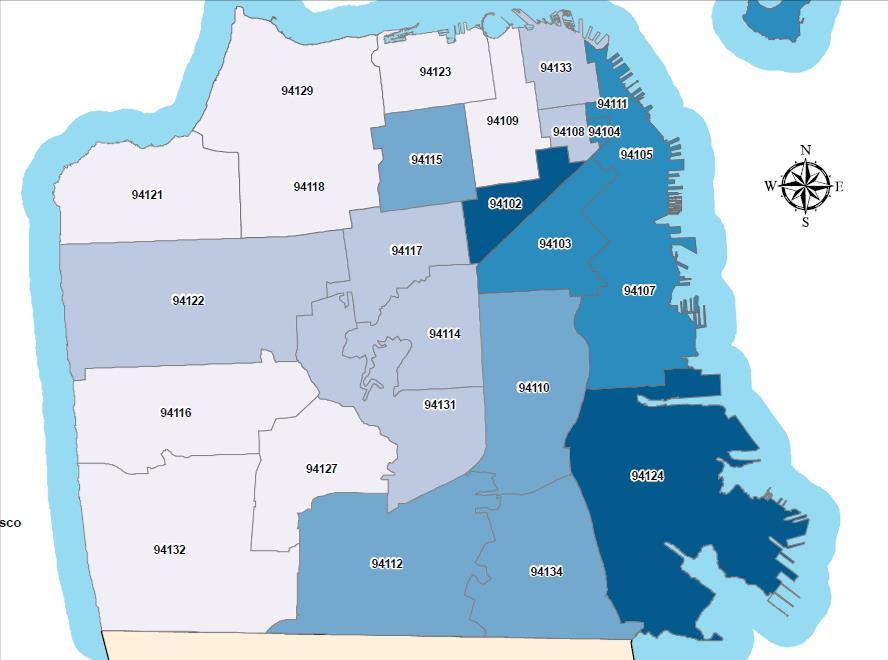
4 Sources: (2010) PG&E, Hetch Hetchy Water and Power, CA. Dept of Transportation, MTC, Muni, BART GHG Emissions from San Francisco Waste 4% Residential 21% Transport 43% Buildings 53% Commercial 26% Municipal 6%


5 Efficiency Investment by City-run Program Installed 10,500 efficiency projects $3,287 average annual cost savings Paid over $37 million in incentives Reduced 91,000 tons of annual carbon emissions Equivalent to: Annual savings powering 44,000 homes in San Francisco
6 Tools for New Construction and Alterations

: LEED")
7 Commitment in City Facilities First Municipal Green Building Ordinance 1999 Municipal Green Building Ordinance Chapter 7 Environment Code (9/04): LEED Silver

8 Priority Permit Incentive Environmental Review and Building Permit Standard Timeframe 0 LEED Platinum/ZNE/Passive House/Living Building 6-9 months 0 1 month

9 tinyurl.com/cazneplan CA Goals: Zero Net Energy for All new residential by 2020 All new commercial by % of existing commercial by 2030
 Image courtesy: USGBC CA Source: Governor Brown Executive Order B-18-12 tinyurl.com/govgreenorder tinyurl.")
10 State of California Facilities All new facilities ZNE by 2025 By 2018, cut energy purchases 20% for existing buildings 3 ZNE pilots launched in 2013 New building Major renovation Existing building (no renovation) Image courtesy: USGBC CA Source: Governor Brown Executive Order B tinyurl.com/govgreenorder tinyurl.com/cagbaction

11 Zero Net Energy: Difficult But Achievable ARUP (2012) Technical Feasibility of Zero Net Energy Buildings in California tinyurl.com/arupznefeasibility

 LEED CI is common Retrofit on resale, green labels in")
12 San Francisco Building Energy Efficiency Policies New Construction Alterations Existing Homes Existing Commercial Scale <1% per year <1% per year 360k homes ~200M sq ft of buildings larger than 10k sq ft Rebates $ $ $ $$$ Policy Tool Outcomes T24 Energy Code +15% (Path to Zero Net Energy) Motivated market. >40% of rentable office = LEED EB O&M T24 Energy Code (Path to zero) LEED CI is common Retrofit on resale, green labels in County records 1% of units are green certified Greatest Opportunity
13
14
15


16

17 Scope Existing Commercial Composition Owners Representatives Property Managers Contractors Operators Engineers Architects Finance Utilities The Task Cost effective energy savings Minimum costs Measureable
18 Stakeholders Primary Observation What Is Measured Gets Managed. - Peter Drucker

19 Existing Commercial Buildings Ordinance All commercial buildings must have: A Benchmark An Action Plan Transparency
20 Existing Commercial Buildings Ordinance 3 year phase-in: Mandatory: Benchmarking + limited public disclosure (annual) Energy audit or retrocommissioning (every 5 years) Voluntary: Capital improvements Operations and calibration Tenant engagement Financing & incentives Policy as Customer Relationship Management
21 Private Sector Building Stock Affected Buildings Floor Area 10% 43% 32% 11% 25% Aggregate Energy Use (PG&E Proxy Benchmark) 79% 9% 9% 7% Building Size (square feet) >50k 25k - 50k 75% 10k-25k 0-10k sq ft
22 Does Energy Benchmarking Work?


23 Municipal Facilities SFPUC Report: 446 buildings, 26 agencies, 46M sq ft 79% outperform national median Qualify for ENERGY STAR: 11 of 33 ratable buildings 42 of 109 schools 5 sites rank in bottom 25% compared to national peers Carbon reduction: 5% since % since 2009

24 Does Benchmarking Save Energy? EPA Study: 35,000 buildings that benchmarked for 4 years Average benefits: 2.4% annual energy use reduction 7% average savings over 4 years Buildings with the lowest scores improved the most. Source: US EPA 2012 Data Trends: Benchmarking and Energy Savings
25 Early Observations from benchmarking San Francisco Median office ENERGY STAR score is >80 93% of floor area reporting a score >75 has been 3 rd party verified via Audit ENERGY STAR certification LEED EB Non-Refr. Warehouse 3% Retail 4% Floor area reporting to date by sector: All Other 9% Office 69% Hotel 15%

26 Audit Requirements Benchmark 10k to 50k sq ft >50k sq ft


27 New(er) Buildings By benchmarking and identifying inefficiencies through an audit, we maximized savings without sacrificing our customers experience. Peter Koehler General Manager InterContinental San Francisco

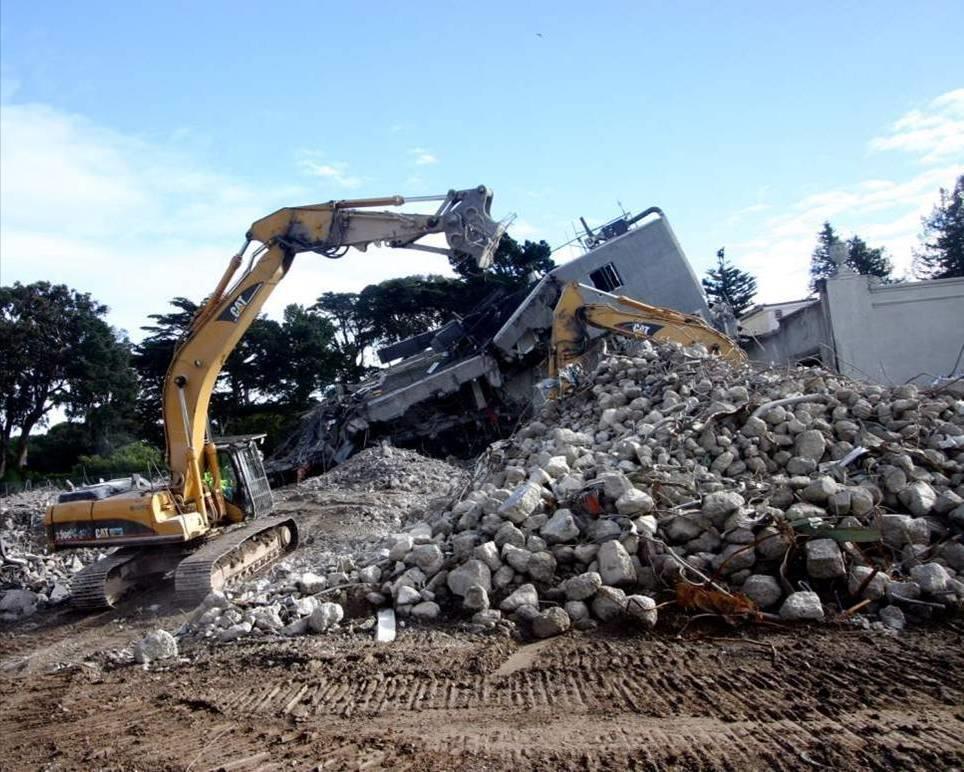
28 Historic Buildings 290,000 sq ft historic landmark Level 2 Audit in Q Updated lighting and HVAC controls $1.2M estimated lifetime savings Sources: Carbon Lighthouse, Flood Building management Image : Joe Mabel


29 Pier 1: Prologis Headquarters $1.4 million investment Positive cash flow 32% energy cost reduction 30 jobs $3.7M in economic activity Projects Completed: Retrocommissioning Lighting 200kW photovoltaic array
30 Audits: Uncovering Value The first 120 Level II audits: 50,000 $50,000,000 40,000 $40,000,000 Not Yet Implemented 30,000 $30,000,000 Implemented 20,000 $20,000,000 Assumptions: 6% discount rate 10,000 $10,000,000 0% utility cost escalation - Annual Electric Savings (MWh) $- Net Present Value Period = Expected Useful Life

31 Lessons Learned Patience Quality inventory of building stock Utility and state regulator support Market segmentation Communication Incentives/buy-in
32 Key Challenge: Access to Data Source: Institute for Market Transformation
 Manage compliance data Benchmark buildings Audit: Same resources under development DOE SEED database Building Performance Database Building Energy Data Exchange")
33 Resources Purpose Tool Source Review other cities policies Model policy Policy maps Reports summarizing benefits Benchmark: Fact sheets, policy design guide and sample language SEE Action Work Group (US DOE) Manage compliance data Benchmark buildings Audit: Same resources under development DOE SEED database Building Performance Database Building Energy Data Exchange Specification ENERGY STAR Portfolio Manager US Dept of Energy EERE Program
34 Learn more San Francisco Green Building Code Existing Commercial Buildings Policy Central Corridor EcoDistrict Barry Hooper Ph: (415) San Francisco Dept of Environment California: CA Zero Net Energy Strategic Plan ARUP Zero Net Energy Study California Executive Order B CA Green Building Action Plan tinyurl.com/cazneplan tinyurl.com/arupznefeasibility tinyurl.com/govgreenorder tinyurl.com/cagbaction

35
36 Summary of Existing Commercial Buildings Ordinance Applies to: Requires Energy Benchmarking Audit/Retrocommissioning Non-residential buildings with 10,000 square feet or more of conditioned space All energy used by the building, and basic descriptive characteristics. May be done in-house. Assessment by a qualified professional identifying cost-effective opportunities to save energy. (May alternately be retrocommissioning.) Tool: ENERGY STAR Portfolio Manager ASHRAE Procedures for Audits Level 2 for 50k sq ft Level 1 for <50k sqft Frequency: Annually, starting: Every 5 years >50k sq ft: Oct k-50k sq ft: April k-25k sq ft: April 2013 Due dates assigned over 3 years Exemptions New or unoccupied buildings, (De Facto: whole building transaction in prior calendar year) Buildings that are new, unoccupied, in financial distress, earned LEED EB, or earned ENERGY STAR 3 of the past 5 years
37 Relation to California Law SF ECB Ordinance California AB1103 Requires Benchmark and Audit Benchmark only Trigger Tool Data required Annual Transaction (sale, lease, refinance of entire building) ENERGY STAR Portfolio Manager Monthly energy consumption for the entire building and Basic characteristics (size, occupancy, use, hours of operation) Data Disclosed Disclosure : Summary of annual energy performance: 1 to 100 rating Energy use per sq ft per year GHG emissions from operations Public All Counterparty in transaction (available to CEC)

38
39 A Map to Frame Discussion About Energy Data Office Building Block Group House Block City/Region Space B D Seconds Months Year Time A C
40 Utility Data Access Policies Supporting Benchmarking Utility ConEdison (NY) Minimum meters to share whole building monthly data with owner 2 (i.e. no threshold) City with Benchmarking Policy NYC Avista Utilities (WA) 2 Seattle Seattle City Light (WA) 2 Seattle Commonwealth Edison (IL) 4 Chicago Austin Energy (TX) 4 (4/80 rule) Austin Puget Sound Energy (WA) 5 Seattle Pepco (DC) 5 DC Colorado PUC (CO) 15/15 rule (Boulder?) Pacific Gas & Electric 100% consent required San Francisco