City Development Plan ( ) SAHARSA
|
|
|
- Godfrey Green
- 5 years ago
- Views:
Transcription


1 Urban Development and Housing Department Government of Bihar City Development Plan ( ) SAHARSA CDP Prepared By: LEA Associates South Asia Pvt. Ltd., New Delhi Support Programme for Urban Reforms in Bihar (A Government of Bihar Initiative) Supported by DFID, United Kingdom
2
3


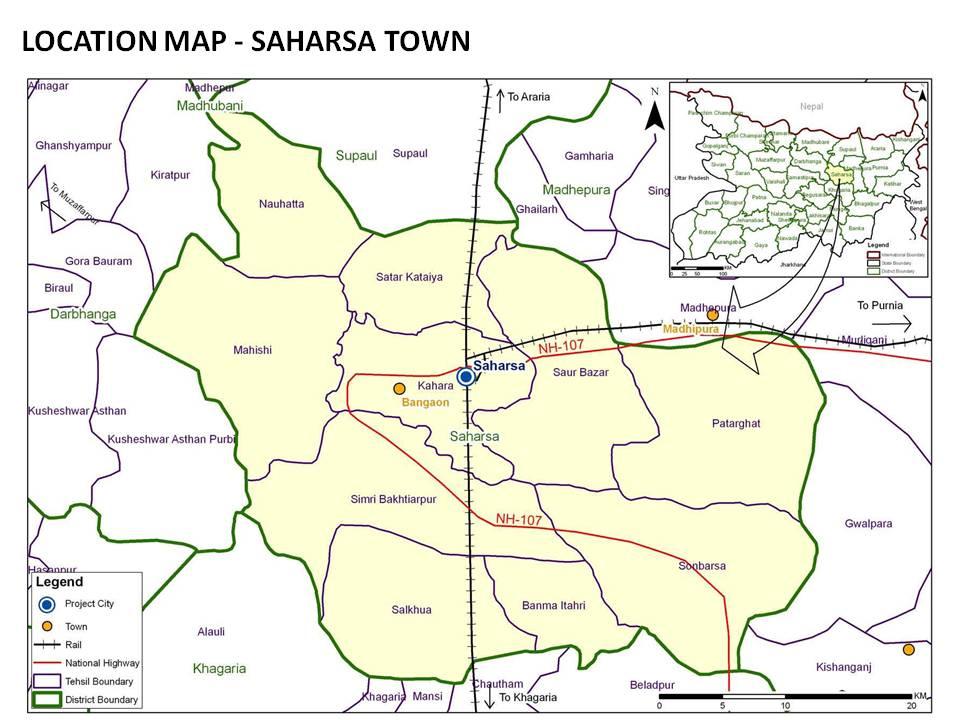
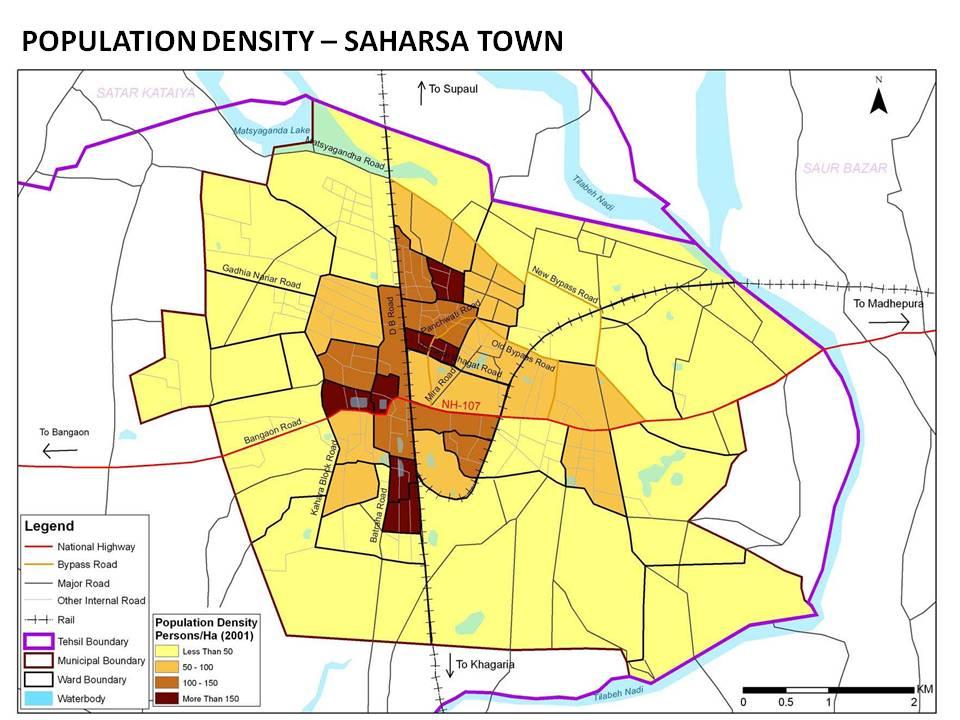
4 Overview Saharsa is a district headquarters and the only urban centre in the district. It serves multiple functions of an administrative city and a centre for trade and commerce especially for agriculture produce. The city is located at a distance of 240 km north east of the State capital of Patna. Geographically, it is located at North latitude & East longitude on alluvial plains of River Tilawe. It is well connected with the rest of the country through rail and road networks. National Highway 107 cuts across the city in east- west direction. Location of Saharsa District Saharsa is a Nagar Parishad covering sq km. The town is divided into 40 wards. The population of the town was 1.25lakhs as per Census 2001 this was 14% of the district population. The average population density of the town is 83 persons per hectare. Saharsa ranks eighteenth in terms of urbanization in the state with the rate of urbanization being 8.3%. The competitive advantage of Saharsa lies in its being a major distribution centre for agricultural produce it has potential to be developed as a logistic hub and food park. The beautification of the Matsyagandha Lake will generate additional income. Saharsa could be developed as a training centre for processing of makhana, milk and jute products. EXE CDP Prepared By: LEA Associates South Asia Pvt. Ltd., New Delhi Page 1 of 15
5 CITY VISION The vision for Saharsa was derived on the basis of the status assessment of the city, stakeholder consultations and focused group discussions. Participatory consultations during the visioning process concluded that there is need to revive growth and improve the overall quality of life of its citizens. The identified Vision is as follows: To develop Saharsa as a centre for agro produce trade and processing. The identified vision forms the basis of sector-specific strategies adopted in framing the action plan. Demography The population of Saharsa has been projected for the horizon period-2031 by studying the following aspects: (a) State trends in urban growth; (b) Migration characteristics of population into urban areas; (c) District level and city migrant population characteristics; (d) Economic opportunities in the city; and (e) Regional potential of the city. The projection of population has been done by various methods (Table E-2). The ratio method has been adopted due to its growth rate being similar to the projected urban population growth rate of the state by the Census of India. The population of Saharsa is projected to be 1.96 lakhs in Population Projection Arithmetic Increase Geometric Mean Method Component Method Ratio Method EXE Page 2 of 12 CDP Prepared By: LEA Associates South Asia Pvt. Ltd., New Delhi
6 A) Water Supply Sector Assessments & Growth Strategies Ground water is the main source of water in Saharsa. The town has 900 hand pumps to supply water to about 98.4% of the population. Piped water supply covers a small part of the town 1.56% - and caters to select offices in the Collectorate and the Sadar Hospital. This facility is provided by the PHED. It is estimated that the per capita supply is 20 lpcd with about 4 hours of supply per day. The iron content on the ground water is above permissible limits (3.0-5 ppm). Strategies: The CDP suggests: Comprehensive plan for water supply Explore options for PPP in implementation Encourage rain water harvesting for recharge of ground water Introduce water resource management for maintenance of surface water bodies To address this issue, the Nagar Parishad has installed 81 public hand pumps under the Iron Removal Programme of Water does not attract a separate charge. Detailed Project for Phase 1 New source development and intake work Raw water transport main (20 km) Water treatment plant for 37 MLD Clear water pumping station and pumping main Clear water transport main (40 km) Master reservoir 3.1 ML Overhead Tank 11.1 ML Water distribution networks of 315 km and 86,950 households Grand Total Investment Requirements (In Rs. Crores) Phase II Phase I Phase III Rs crores B) Sewerage and Sanitation Saharsa has no system for wastewater management. It is estimated that the town generates about 16.28MLD sewage. All wastewater including effluents from septic tanks are discharged into storm water drains that finally flow into the River Tilawe. Septic tanks and soak pits are the prevalent methods of disposal. 64% of households in the town have access to toilets; 22% practice open defecation and 14% have access to dry toilets. Strategies: The key strategies in the CDP are: Prepare a sewerage plan and explore scope for involving the private sector Encourage low cost sanitation and promote safe sanitation practices Assessment of need for community toilets, especially in poor communities Involve private sector in construction and maintenance of community toilets Restrict black water disposal into water bodies EXE Page 3 of 12 CDP Prepared By: LEA Associates South Asia Pvt. Ltd., New Delhi
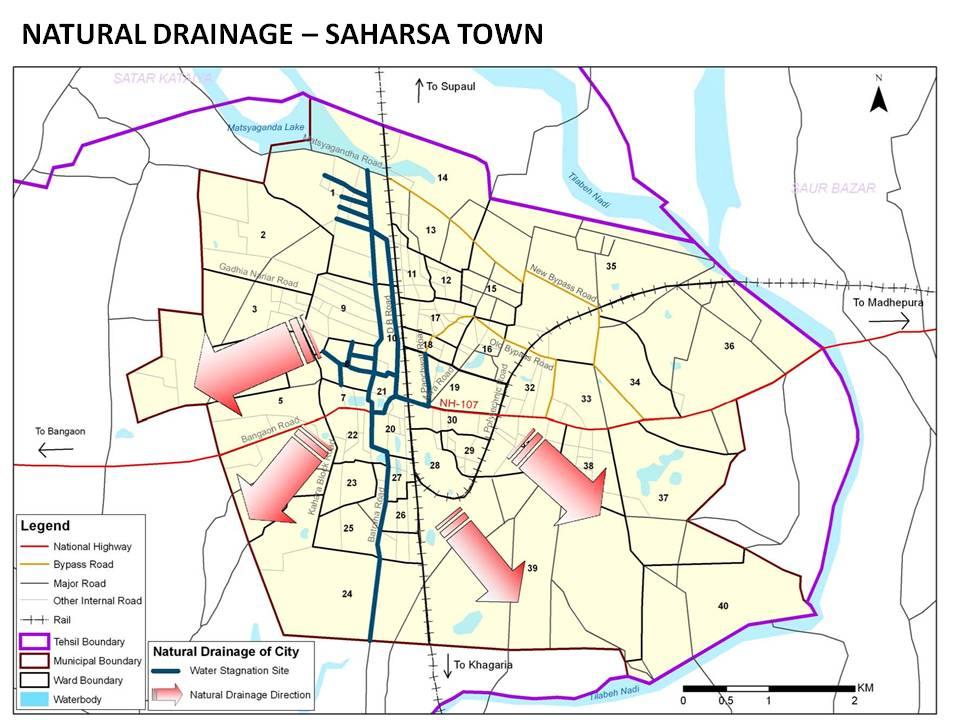
7 The town has four community toilets with an average of 10 seats each. The present system is inadequate and poses a potential threat to overall health and hygiene. Detailed Project for Phase 1 Laying of 315km of pipelines Provision of sewage pumping station 25 MLD Provision of 25MLD STP and treated water storage reservoir Household connections 89,950 households Grand Total Investment Requirements (In Rs. Crores) Phase II Phase I Phase III Rs crores C) Storm Water Drainage The drainage system in general is inadequate. Saharsa town has only 13 kms with road side drains covering only 5.4% of the city. 7.5km of drains are pucca but open; 2.5km of drains are pucca and covered and 3km drains are kutcha open drains. The town is divided into two drainage zones east and west for Strategies: The key strategies in the CDP are: Implementation of DPR prepared by PHED Extension of coverage of drainage in new colonies and uncovered areas De-silting of nallahs and roadside open drains Preparation of an inventory of water logging prone areas administrative purposes with the Saharsa-Madhepura railway line forming the physical division. The drains in the east zone discharge into the River Tilawe while those in the west zone discharge into fields and ditches. Water logging is a problem in the town with the most frequent water logged areas being Prashant Talkies, Bus Stand, Gandhi Path, D.B. Road, Bengali Bazar, Basti Colony, Kachari Dhala and the western part of the town surrounding the Mehi Ashram. Although Saharsa has an approved DPR for Storm Water Drainage, implementation is delayed. Detailed Project for Phase 1 Construction of new drains 231 km De-silting of existing drains 13 km Grand Total Investment Requirements (In Rs. Crores) Phase II Phase I Phase III Rs crores D) Solid Waste Management It is estimated that Saharsa generates about 60 tonnes of waste per day of which only 50% (40 tonnes) is collected. It is estimated that Saharsa will generate about tonnes in EXE Page 4 of 12 CDP Prepared By: LEA Associates South Asia Pvt. Ltd., New Delhi
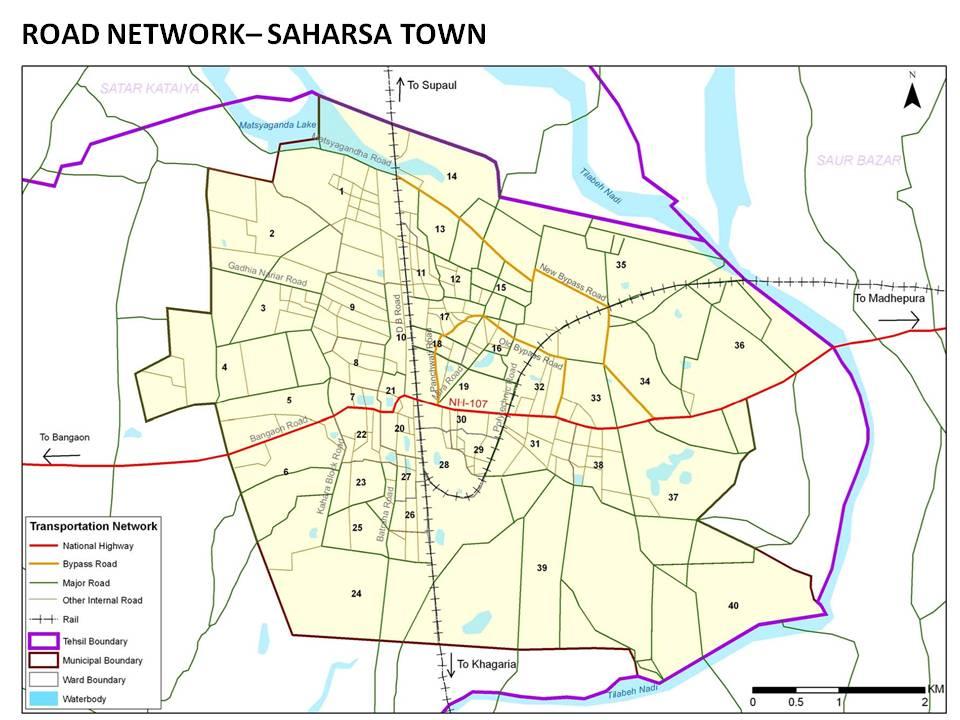
8 Collection of wastes is mainly through street sweepings and secondary collections from 225 secondary collection points in the town of these, only 160 points have either steel or a concrete container. The waste from main roads is collected on daily while that from the ward roads is collected on a weekly basis. The ULB has not identified any sites for disposal of wastes and most of it is dumped along the roads and in low lying areas of the town. Strategies: The key strategies in the CDP are: Follow MSW Handling Rules 2000 Preparation of a comprehensive plan for solid waste management Promote door to door collection with private sector participation Develop a sanitary landfill site for disposal of wastes Create awareness about safe handling of waste Detailed Project for Phase 1 Litter dustbin of 25L capacity; 557 of 50L capacity; 279 of 240L capacity; 57 of 1100L capacity Containerized mechanized tri-cycles 2301 Pick up vehicles 106 Equipments for secondary collection 32 containers of 4 cu.m.; 16 containers of 2 cu.m.; 12 tipper vehicles Land development for SWM site Supply of equipments for SW collection and safety items Grand Total Investment Requirements (In Rs. Crores) Phase II Phase I Phase III Rs crores E) Roads, Traffic, and Transportation Saharsa town has 236km of roads including all major and internal roads. The NH 107 traverses the town in an east to west direction and connects the town with other urban centres of the state. About 30% of the rods (71km) of roads are kutcha. The other main roads in the town include the M.D. Road and the Bypass Road. The traffic is heterogeneous and the town has 4346 Strategies: The key strategies in the CDP are: Preparation of an integrated transport plan Widening and strengthening of all main roads Provision of foot paths and street lights along main roads Improvement of junctions and provision of signals and signages Construction of ROBs at major crossings Upgrading infrastructure in Refugee Colony bus stand registered vehicles. Traffic congestion and jams are common not only on account of narrow width but also due to absence of road over bridges at rail crossings in the town. Intra city transport is mainly by way of cycles and auto rickshaws while, for inter-city transport, there are 80 State Transport buses. EXE Page 5 of 12 CDP Prepared By: LEA Associates South Asia Pvt. Ltd., New Delhi
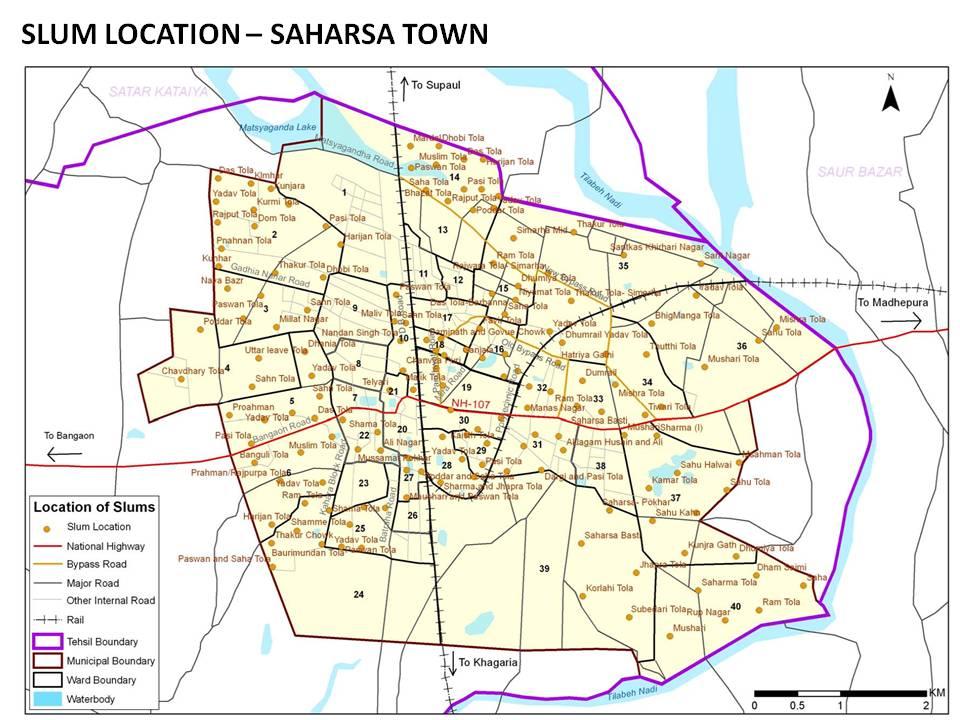
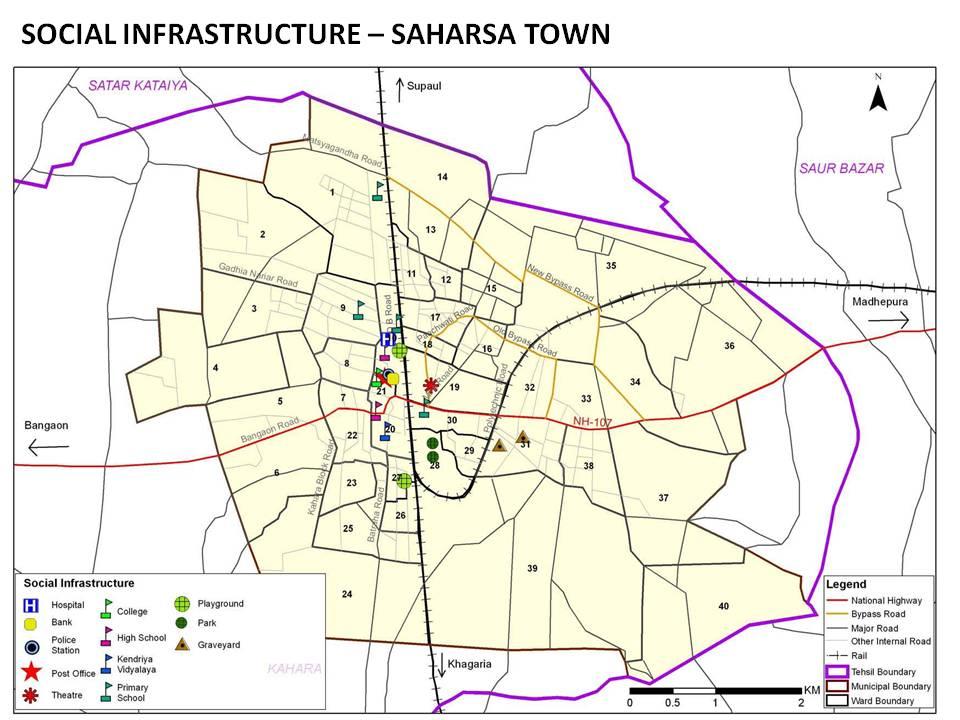
9 Detailed Project for Phase 1 Upgradation of roads km Widening and strengthening of roads 11.90km Construction of new roads 18.9km Construction of ROB s 4 Improvement of junctions 6 Construction of pedestrian walkways 30.70km Construction of bus stand Development of parking lots in designated areas Provision of street lighting Grand Total Investment Requirements (In Rs. Crores) Phase II Phase I Phase III Rs crores F) Street Lighting and Fire Fighting The town has 1275 street light poles with most being non-functional. G) Housing and Urban Poverty Saharsa has 101 slums with 8410 households. It is estimated that 22% of the towns population lives in slums. 90% of roads in slums are kutcha. Hand pumps are the main source of water with one hand pump serving about 80 households. Access to toilets is very limited with some dry latrines being present open defecation is the norm. There is no drainage in the slums. Under the IHSDP programme there are plans to construction 800 houses. Strategies: The key strategies in the CDP are: Design and implementation of slum improvement programmes Assessment of infrastructure needs in slums Development of model rehabilitation colonies with private sector participation Encourage community participation in slum development Detailed Project for Phase 1 Investment Requirements (In Rs. Crores) Phase II Phase I Phase III Construction of 1000 EWS housing units under IHSDP Provision of infrastructure facilities in slums Grand Total Rs crores H) Social Infrastructure An assessment of social infrastructure in Saharsa was done. The District Hospital (Sadar Hospital) is located in the town. It is a 207 bed facility and managed by 17 doctors, 19 paramedics, 20 Nurses and 2 ANMs. EXE Page 6 of 12 CDP Prepared By: LEA Associates South Asia Pvt. Ltd., New Delhi
10 The town has 42 primary schools, 22 middle schools, 6 high schools and 4 colleges. There are 3 parks, 1 playground, 1 stadium, 1 Town Hall and 1 community hall. These facilities are inadequate for the town. Strategies: The key strategies in the CDP are: Provision of water and sanitation facilities in schools and hospitals Increase healthcare accessibility to poor Construction of additional schools and vocational training institutes Involving private sector in development and maintenance of parks, play grounds Investment Requirements (In Rs. Crores) Phase I Phase II Phase III Detailed Project for Phase 1 Construction of schools 12 primary schools; 1 middle schools; 4 high schools Construction of dispensaries 4 Construction of libraries Construction of 4 community halls Development of 36 housing cluster level parks and 12 neighbourhood level parks Grand Total Rs crores I) Local Economy It is estimated that the workforce participation in the town is 24%. Main workers account for 76%. Saharsa is the largest distribution centre for agricultural produce - vegetable and fruits like litchi, makhana, mango, sugarcane, maize and basmati rice. The ULB estimates that the Strategies: The key strategies in the CDP are: Promotion of makhana, jute and milk processing through training, facilitating access to finance, infrastructure etc. Promotion of agriculture based trade Development of a logistics hub and food park town has more than 1000 shops and offices. It is also estimated that there are about 500 informal shops contributing 20-30% of the economy. The ULB has issued 350 licenses for various shops and about 150 trade licenses. The main markets of the town include Refugee Bazar, Bengali Bazar, D. B. Road Bazar, Hatia Gachi Bazar and Purvi Bazar. Most of the economic activities are unorganized adding to the overall haphazard development in the town. Detailed Project for Phase 1 Renovation and extension of Krishi Mandi Development of food park Grand Total Investment Requirements (In Rs. Crores) Phase II Phase I Phase III Rs crores EXE Page 7 of 12 CDP Prepared By: LEA Associates South Asia Pvt. Ltd., New Delhi
11 J) Urban Heritage and Tourism The Matsyagandha Lake, the Bara Pokhar, other ponds, the Matsyagandha Temple and some festivals including the Kosi Mahotsav contribute to tourism in Saharsa. The annual tourist in-flow is a meager 0.92% of the total tourists in the state with the highest inflows recorded in Strategies: The key strategies in the CDP are: Development of tourist facilities and infrastructure Cleaning and maintenance of water bodies and green areas December. Although tourism is not an important sector at this stage, there is potential to develop the Matsyagandha Lake and associated infrastructure especially for the Kosi Mahotsav. Detailed Project for Phase 1 Provision of tourist infrastructure; beautification of heritage & tourist spots; water front development of the Matsyagandha Lake; construction of Welcome Park; construction of Open Air Theatre and services for Kosi Mahotsav Grand Total Investment Requirements (In Rs. Crores) Phase II Phase I Phase III Rs crores The Saharsa Nagar Parishad has shown an increase in income from Rs lakhs in to Rs lakhs in The estimated income for was Rs lakhs. The total expenditure too has been increasing from Rs lakhs in to Rs lakhs in The estimated expenditure in was Rs lakhs. Grants and subsidies comprise 79% of the total revenue income. The 5-year Financial Position of the Local Body Key Findings: The key findings in municipal finance identified in the CDP are: Revenue income registered a 108% growth 27% is average increase in contribution of own sources to total income High dependency on grants and subsidies 43% Poor collection ratio of property tax 4.16% average contribution of property tax to municipal income was 5.67%. Establishment accounted for an average 41% of the revenue expenditure in the last 5 years. Revenue Receipts Income from Tax Sources (In Rs. Lakhs) Source 5-Year average (FY to FY ) Property Tax Latrine Tax Education Tax Health Tax Street light Tax Percentage to Total Revenue Income EXE Page 8 of 12 CDP Prepared By: LEA Associates South Asia Pvt. Ltd., New Delhi
12 Other Taxes Total Tax Income Income from Non-Tax Source (In Rs. Lakhs) Income from properties Development Charges Sewer Charges Other Charges Total Non-Tax Income Revenue Expenditure Revenue Expenditure (In Rs. Lakhs) Item 5-Year average (FY to FY ) Percentage to Total Revenue Expenditure Establishment Operation and Maintenance Debt Servicing Total Revenue Expenditure Capital Expenditure (In Rs. Lakhs) Construction works and PWD Others Total Capital Expenditure Key Parameters Indicators Average Per Capita Revenue Income Per Capita Revenue Expenditure Income Generated internally Dependency on Grants Operating Ratio (Revenue Expenditure /Revenue Income) Capital Utilization Ratio Establishment cost as % of Revenue Expenditure Establishment cost as % of Revenue Income Rs Rs Rs Rs Rs Rs Rs Rs Rs Rs Rs Rs % 20% 31% 34% 15% 27% 25% 35% 44% 35% 78% 43% % 47% 71% 69% 24% 59% 77% 44% 51% 45% 20% 47% EXE Page 9 of 12 CDP Prepared By: LEA Associates South Asia Pvt. Ltd., New Delhi

13 Capital Investment Plan (CIP) The total funding over the life of the CDP period, i.e. up to year 2030, is estimated at Rs crores. Sector-wise details of the investments have been defined for the entire period. The scheduling or phasing of the CIP is based on the analysis of fiscal resources for new investments and O&M, technical capacity for construction and the choice of specific improvements to be taken up over the CDP period. About 23% of capital investment is envisaged for water supply; 19.64% for storm water drainage and 12% for sewerage and sanitation. Sectors Investment Required (In Rs. Crores) Phase I Phase II Phase III Total Sectoral Distribution (%) Water Supply Sewerage & Sanitation Storm water drainage Solid Waste Management Urban Transport Social Infrastructure Slum improvement Heritage and Tourism Capacity Building Urban Environment Economic Development Total Phase-wise Distribution (%) EXE Page 10 of 12 CDP Prepared By: LEA Associates South Asia Pvt. Ltd., New Delhi

14 Financial Operating Plan (FOP) The FOP has been prepared for short term (Phase I), medium term (Phase II) and long term (Phase III). This is in line with the town s vision and approach to development and priorities and action plans approved by stakeholders. The FOP has been prepared by projecting the finances based on trends discussed previously and with various assumptions and options. Implementation Options are taken as (i) Option 1: Cost summary Normal; (ii) Option 2: Cost summary with select infrastructure and (iii) Option 3: Cost summary without social infrastructure. Funding options are taken as (i) Option 1: Loan (20%); Grant (70%); ULB contribution (10%); (ii) Option 2: Loan (10%); Grant (80%); ULB contribution (10%) and (iii) Option 3: Loan (0%); Grant (100%); ULB contribution (0%). New loan assumptions are taken assuming 15 years tenure, with interest rate at 9%, moratorium at 2 years and repayment period of 13 years. The six comparative scenarios of the FOP with select social infrastructure facilities are shown below. TE/TR: Total recurring expenditure to total recurring income DS/TR: Total debt services by the ULB in proportion to its total recurring income Inference when investments are not incorporated: Scenarios 1, 2 and 4 Financial status improves with introduction of management and reform measures Average TE/TR which is 0.81 at the base case improves to 0.77 with introduction of management measures; this further improves to 0.61 with introduction of reform,measures Performance of the ULB improves with introduction of new investments in the proposed phasing Inference when investments are incorporated: Scenarios 3, 5 and 6 Different options of capital expenditure (with and without select social infrastructure) have been considered In this case TE/TR is always less than 1 and improves from 0.76 in the worst case to 0.58 in the best case A planned system of implementing suggested reforms and works will help in making the ULB financially strong and sustainable EXE Page 11 of 12 CDP Prepared By: LEA Associates South Asia Pvt. Ltd., New Delhi
15 Overall Assessment An overall assessment of the existing service delivery levels on various indicators. It is observed that in Saharsa town most of the service levels are Below Average and Alarming. Parameter Indicators Category Colour Code for Status 1 Status of Coverage of Water Supply Less than 10% Infrastructure and Service Connections Per Capita Availability of Water Less than 40 lpcd Delivery Levels Continuity of Water Supply Less than 1 hr Coverage of Individual Toilets 51 to 60% Door to Door Collection of SWM Less than 20% Collection Efficiency of Solid Waste 41 to 60% 2 Financial Management Operating Ratio Less than 1 Growth in Revenue Income Above 15% 3 Poverty Level % of Below Poverty Line (BPL) Population 4 Organization Staffing pattern, availability of Structure sufficient staff, competency level of existing staff for implementing proposed projects 5 Leadership Leadership quality, awareness and understanding regarding urban sector, proactive approach for implementing reform measures 6 Economic Development Potential Potential for Development, linkages to the state capital and other cities, status of existing infrastructure 7 Environment Sustainability Status of Environment, quality of water, air 8 Participation Level of Participation from Citizen/Citizen Forums/Welfare Association in municipal affairs 9 Compliance with Reforms Status of reform implementation and preparedness for implementation 21 to 40% Observation Based Observation Based Observation Based Observation Based Observation Based Consultant s Analysis Legend Alarming Average Below Average Good EXE Page 12 of 12 CDP Prepared By: LEA Associates South Asia Pvt. Ltd., New Delhi

16
17
18
19
20
21
22