A Geospatial Coastal Resilience Assessment for the Contiguous U.S.
|
|
|
- Bethany Montgomery
- 5 years ago
- Views:
Transcription


1 A Geospatial Coastal Resilience Assessment for the Contiguous U.S. Greg Dobson, Ian Johnson, Kim Rhodes UNC Asheville s NEMAC Mandy Chesnutt National Fish and Wildlife Foundation NFWF Greg Dobson gdobson@unca.edu UNC Asheville s NEMAC Helping people understand and reach decisions in a changing world.

2 Background Information August 2013: DOI selected NFWF to administer its Hurricane Sandy Coastal Resiliency Program Projects that reduce communities vulnerability to coastal storms and related threats by strengthening natural lands that also benefit fish and wildlife With funding from DOI and NFWF, over $100 million was awarded to 54 projects
3 Project Objectives Identify areas on the landscape where implementation of conservation actions will have maximum benefit for human community resilience AND fish and wildlife habitat Account for coastal and inland storm events Regional assessments create a contiguous and standardized data set for US coastlines Targeted watershed assessments identify projects that build community and ecological resilience at local levels

4 Project Regions
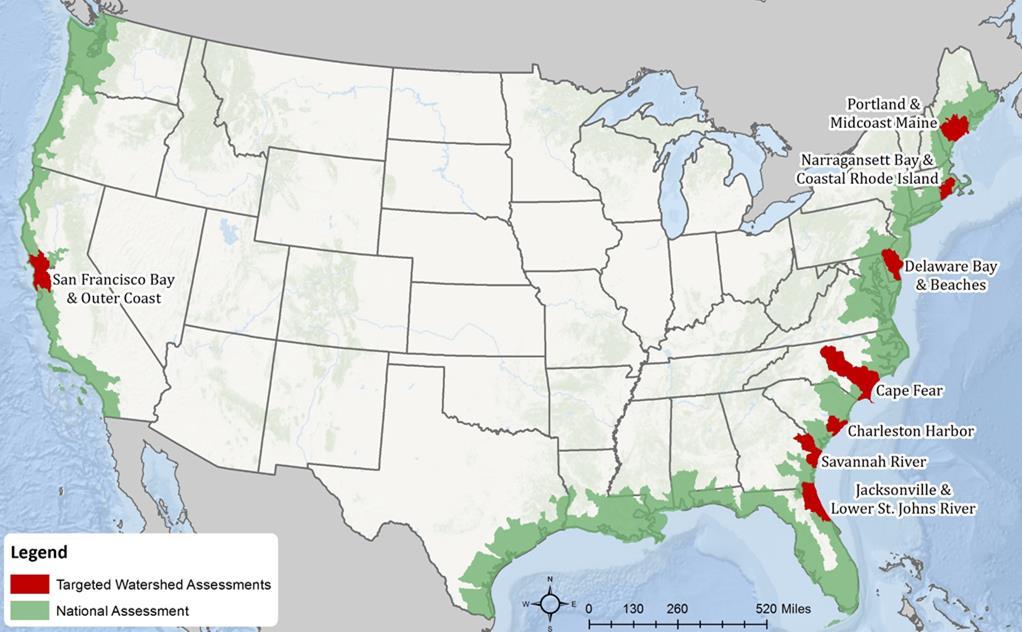
5 Targeted Watersheds
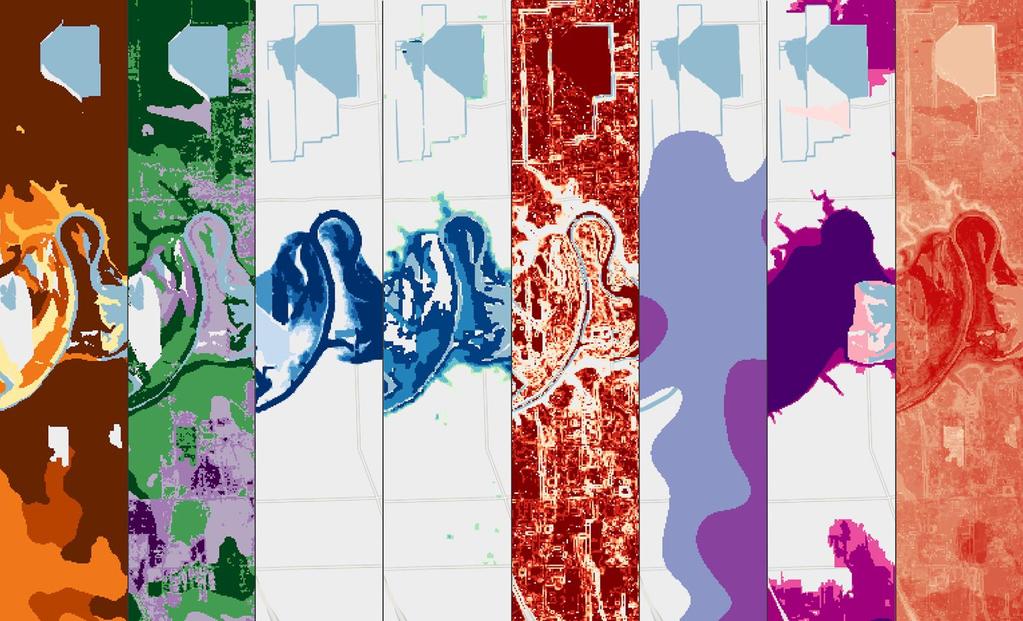
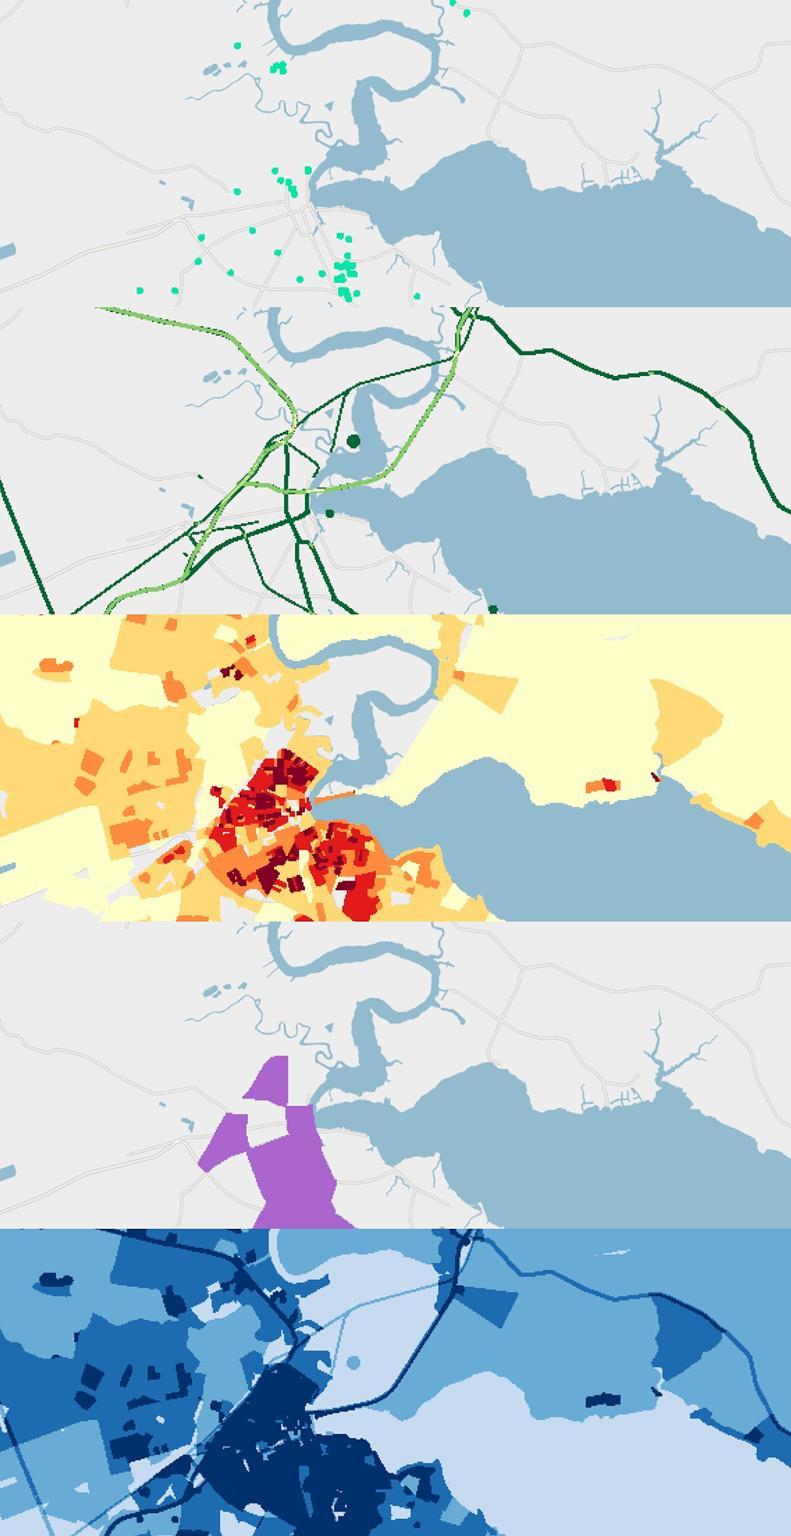
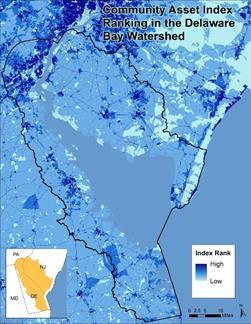
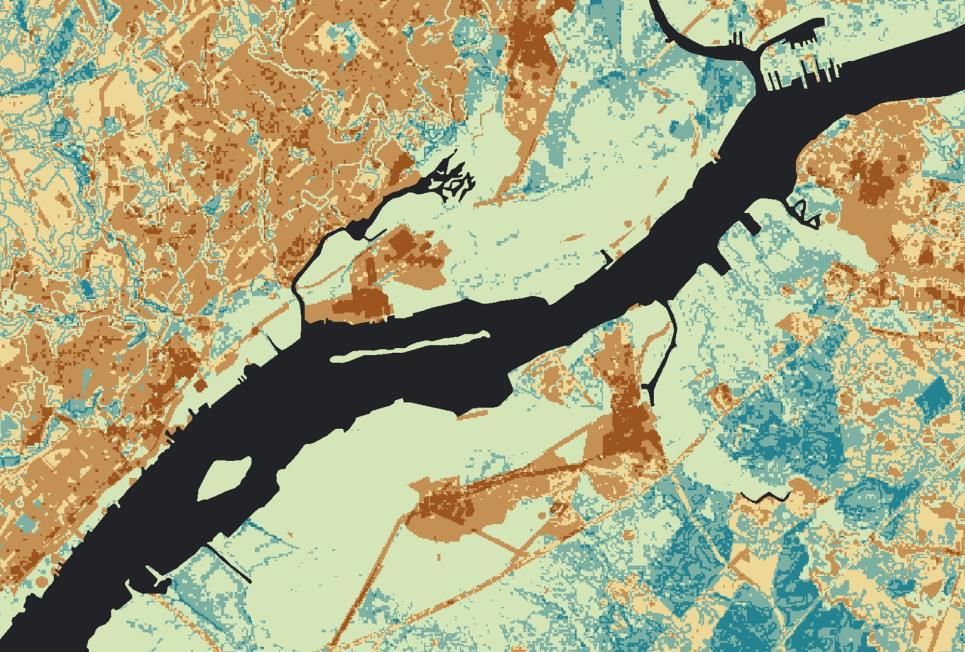
6 Community Exposure Index
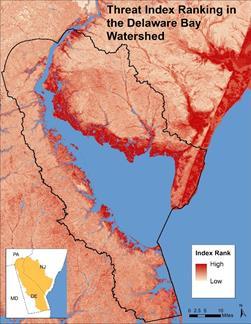
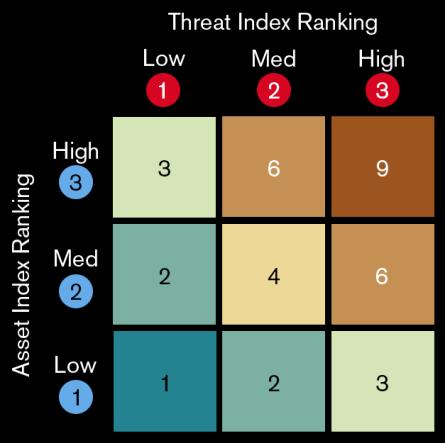
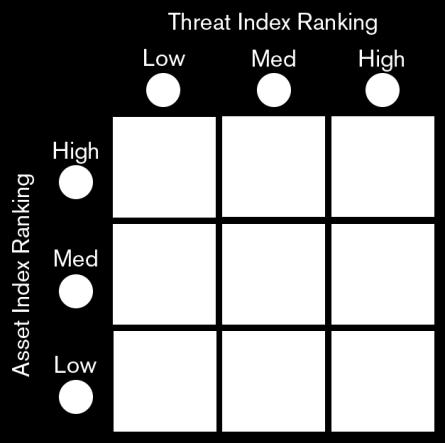
7 Threat Index What are the floodrelated hazards on the landscape? X Community Asset Index What assets are exposed to harm? = Community Exposure Index
8
9
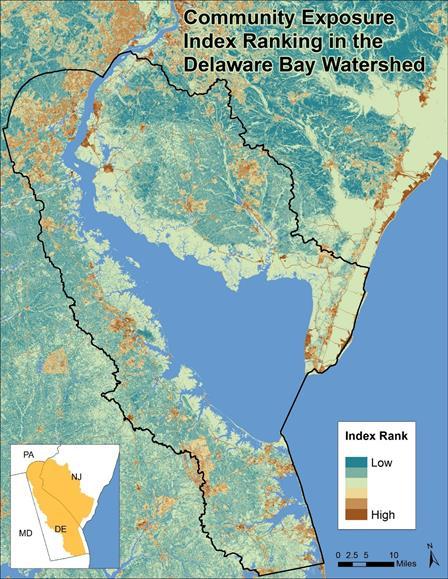
10 Helps communicate where the most people and assets are exposed
11
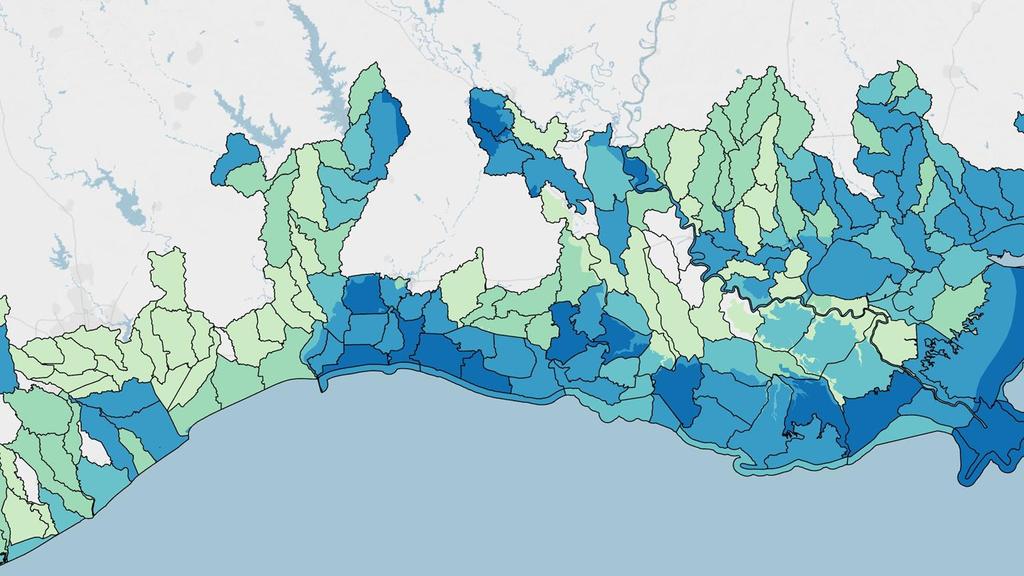
12 Regional Fish and Wildlife Index

13 Terrestrial Index: NatureServe (HUC- 10) priority species Audubon Important Bird Areas Aquatic Index: NatureServe (HUC- 10) priority species NOAA Critical Habitat NOAA Essential Fish Areas NOAA Habitat Areas of Particular Concern Combined Fish and Wildlife Index: Identifies areas on the landscape where there is a high concentration of both priority Terrestrial and Aquatic species and their habitats.

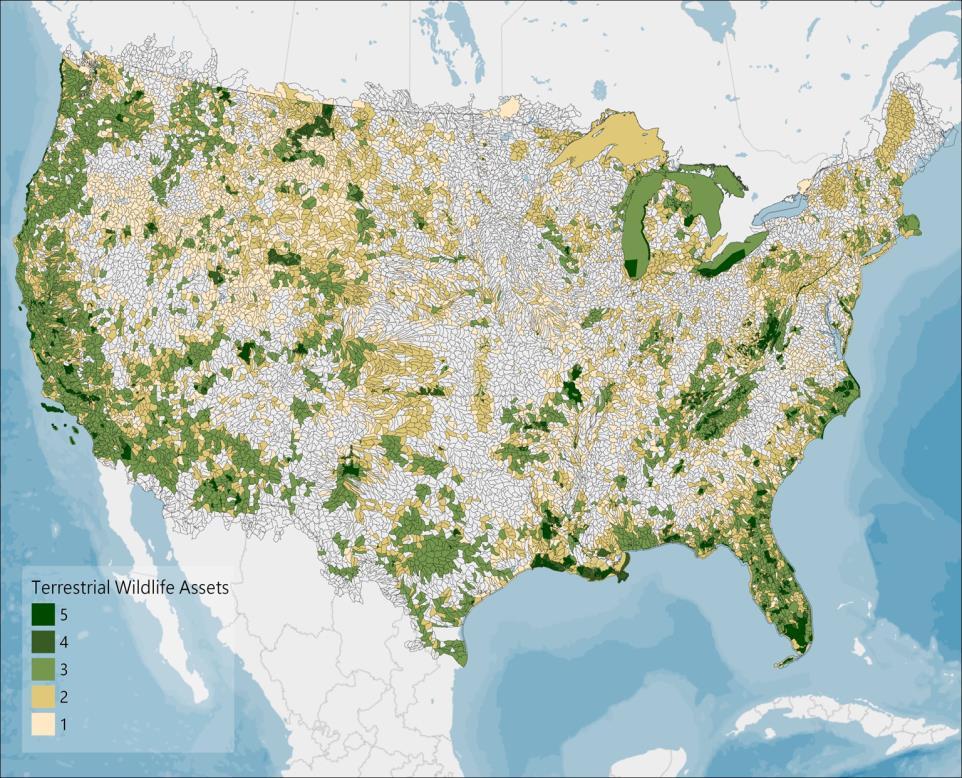
14 Aquatic Index Terrestrial Index
15
16 Hubs


17 How to identify and prioritize landscapes that can build resilience for both community assets and fish & wildlife? Large, contiguous tracts of open land Provide communities protection and buffering from storms Ideal for restoration, enhancement, and expansion projects Look at these places through the lens of community exposure and critical fish & wildlife habitat


18 Protected Areas USGS PAD-US Open natural land cover near densities of exposed assets NLCD, 2011 Combined

19 Combined Hubs Zonal Statistics with the Indices Community Exposure Score Fish & Wildlife Score Final Hub Score

20 A Quick Recap... Threat Index Asset Index Community Exposure Index Fish & Wildlife Index Hubs! Landscapes that can be used to help communities respond to and recover from flood-related events AND Provide benefit to natural habitat
21 Case Studies


")
 It shows")
22 Hurricane Sandy U.S. Route 30 - White Horse Pike Asset Input Threat Input Community Exposure Index One of the main entry points into Atlantic City The Pike is shown in the Critical Infrastructure input (top left) With surge scenarios from only Category 1 storms, the Pike could be inundated (top right) It shows up as highly exposed, suggesting it is impacted by many other inputs in the Threat Index


23 Hurricane Harvey Normal level Post Harvey Buffalo Bayou The Flood-prone Areas input correctly suggests that the Bayou and surrounding area are at risk to flooding. The Population Density input shows densely populated areas outside of the park, as well as some areas from the Social Vulnerability input. Threat Input Asset Input


24 Hurricane Harvey Buffalo Bayou Threat Index Threats in the park are high because the area carries a high value in many of the Threat Inputs Exposure Index However, as exposure is defined as the location of an asset in relation to a potential threat or hazard, the park shows up as having generally low exposure values, with the highest values appearing where there are densely populated areas
25 Next Steps Developing an accompanying interactive web tool Expanding the Assessment to include Puerto Rico/U.S. Virgin Islands, Hawaii, Alaska


26 THANKS!! Greg Dobson NFWF Visit our Poster Display in the Map Gallery (B-07-07, B-07-08)