Engineered and natural dunes: a comparison of abiotic characteristics and hatching success of green turtle (Chelonia mydas) nests on an eastcentral
|
|
|
- Roderick Giles Ball
- 5 years ago
- Views:
Transcription


1 Engineered and natural dunes: a comparison of abiotic characteristics and hatching success of green turtle (Chelonia mydas) nests on an eastcentral Florida Beach Photo by USFWS Martha Barton and Llewellyn Ehrhart University of Central Florida

2 Habitat Loss Worldwide issue Threat to listed species Habitat restoration Needs to be compatible with all species present Promote species survival

3 Coastal Habitats Coastal habitats are dynamic Coastal development interferes with natural erosion and accretion Creates need for restoration Goals Create quality habitat Fulfill human interests
4 Archie Carr National Wildlife Refuge Valkaria Airport Atlantic Ocean I-95 Indian River Lagoon Sebastian Inlet State Park


5 Archie Carr National Wildlife Refuge Established km along Florida s east coast To conserve marine turtle habitat and other species ¾ of ACNWR shoreline privately owned Ecotourism hotspot

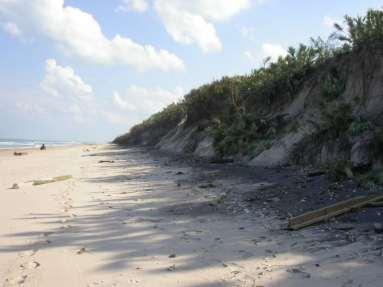
6 Severe Erosion Events 2004 Hurricanes 2 Major storms Left homes vulnerable Immediate need Emergency dunes placed in Spring of 2005
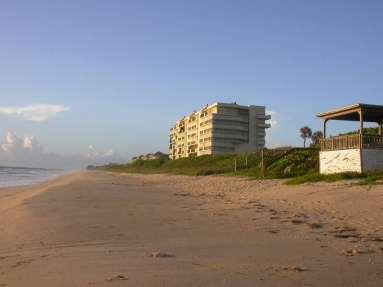
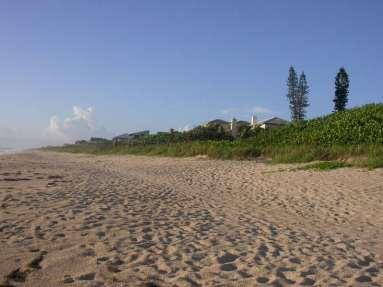
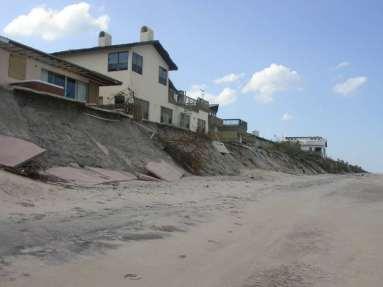
7 Pre-hurricanes Post-hurricanes
8 Atlantic Ocean Emergency Dune Restoration Sand imported from inland sources 75% of ACNWR received fill Oak Hill 15% Astatula 5% 153 km 109 km Rockledge 72% 51 km ACNWR 24 km Indian River County 8%
9 Engineered Dune Natural Dune
10 Beach restoration Altered abiotic environment Negative affects on shorebirds, fish and invertebrates Alters embryonic environment of turtles

11 Restoration with turtles in mind Provides nesting habitat Try to minimize adverse effects - Standards for fill material - Turtle friendly slopes - Monitor sand compaction Many projects successful

12 Substrate characteristics affect hatchling development Temperature Sand color Grain size Moisture Chemical environment Respiratory gases
13 Overview Objective: To determine if the inland fill material provides appropriate abiotic nesting environment for the development of green turtle eggs. H1) Sand characteristics did not differ between natural and engineered dunes. H2) Sand characteristics did not affect hatching success.
14 Study Site: ACNWR Dunes built 2005 Inland sand sources 76% restored 24% natural Study conducted 2006 *Additional restoration in 2006 not included in this study

15 Green turtle (Chelonia mydas) Listed under Endangered Species Act of 1973 USA > 1/3 nests in the ACNWR Nest May through September Typically nest on or near dunes Highly site fidelity Vulnerable to dune restoration
16 Total Number of Green Turtle Nests ACNWR Green Turtle Nest Production Year


17 Field Work 30 June 21 August Natural nests 20 Engineered nests Inserted temperature logger Collected sand sample

18 H1) Sand characteristics did not differ between natural and engineered dunes Grain size Calcium carbonate Moisture Natural Engineered Color Porosity ph
19 Temperature, Nest Depth, Porosity, ph Not significantly different (all F < 1.31, p > 0.05) Temperature (º C) Natural 30.9 ± 0.16 SE Engineered 31.0 ± 0.10 SE Top Nest Depth (cm) Natural 62.9 ± 2.4 SE Engineered 58.5 ± 3.2 SE Bottom Nest Depth (cm) Natural 88.5 ± 1.7 SE Engineered 85.1 ± 2.9 SE Porosity (%) ph Natural 41.6 ± 0.93 SE Engineered 41.5 ± 0.68 SE Natural 7.75 ± 0.04 SE Engineered 7.68 ± 0.05 SE
20 Results Sand characteristics that differed significantly (MANOVA; F 8, 22 = 3.415, p = 0.011) 30 A 25 Natural Engineered B A B 10 B 5 A B A 0 Moisture (%) CaCO3 (%) White Very Pale Brown Light Gray A B
21 Percent Remaining Grain Size Distribution Natural Dune = 0.43 mm Engineered Dune = 0.26 mm A Natural Dune Engineered Dune B B 30 A 20 B 10 0 A A A A A A A Sieve Size (mm)

22 Hatching Success (HS) After emergence: Counted # hatched and unhatched Gross embryonic development noted


23 Hatching Success (HS) A measure of reproductive success Hatching Success % = # Hatched # Hatched + # Unhatched
24 Hatching Success Natural Dune Engineered Dune Clutch Size Hatching Success % ± % ± 6.2 Remaining Hatchlings % ± % ± F 1, 33 = 6.628, p = t = , d.f. = 33, p = 0.724

25 H2) Sand characteristics did not affect hatching success Backward Stepwise Regression Date Laid Mean grain size Calcium Carbonate Temperature Porosity Moisture ph
26 Date Laid Hatching Success = ( )(date) + (0.026)(mean grain size in μm ); R 2 = 0.259, F 2, 28 = 4.889, p = 0.015
27 Mean Grain Size Hatching Success = ( )(date) + (0.026)(mean grain size in μm); R 2 = 0.259, F 2, 28 = 4.889, p = * Calcium carbonate collinear with grain size and removed from initial model

28 Summary Moisture Calcium carbonate Color Mean grain size Grain distribution shift to finer sand Observed grain sizes within those required by state

29 Summary Mean grain size and date laid significant predictors of HS Explained 26% of the variation in HS HS decreased as season progressed HS decreased as grain size decreased
30 Summary HS was 20% lower in engineered dunes 76% ACNWR was restored > 22,000 fewer hatchlings in 2006 Abiotic factors explained a significant portion


31 How grain size affected HS is uncertain Fine sand may reduce gas diffusion Altered moisture environment Nutrient availability Biotic interactions

32 Conclusions Restoration necessary for providing habitat and shoreline protection Sand choice can have effects on green turtles Are the fill material requirements appropriate given the objectives of ACNWR? Maybe a need for more specific requirements?

33 Implications for management Resource for managers for future projects Sand source locations Mean grain size similarity Grain size distributions


34 Future Research Include other turtle species Biotic factors Ghost crabs Fungus Monitor gas exchange Hatchling quality

35 Acknowledgments Dr. Llewellyn Ehrhart Dr. John Fauth Dr. John Weishampel National Fish and Wildlife Foundation Florida Fish and Wildlife Conservation Commission Field and Lab Work: Dr. Jack Stout Dr. David Jenkins Jennifer Elliott Brandon Barton Dean Bagley Bill Redfoot Cheryl Pinzone MB Manjerovic April Verpoorten Camille Collins Hiliary Suresch Tracy Thompson Simona Ceriani Shawn Hirsch BGSA
36 Thank You.