Lessons learnt from developing SFDs at scale
|
|
|
- Liliana Thompson
- 5 years ago
- Views:
Transcription

1 Lessons learnt from developing SFDs at scale
2 The Shit Flow Diagram Promotion Initiative (SFD-PI) Based on a study carried out in 2013 for WSP on urban sanitation/fsm in 12 cities worldwide Peal, A., Evans, B. E., Blackett, I., Hawkins, P., & Heymans, C. (2014). Fecal Sludge Management: analytical tools for assessing FSM in cities. Journal of Water, Sanitation and Hygiene for Development, 4(3), doi: /washdev Peal, A., Evans, B. E., Blackett, I., Hawkins, P., & Heymans, C. (2014). Fecal Sludge Management: a comparative assessment of 12 cities. Journal of Water, Sanitation and Hygiene for Development, 4(4), doi: /washdev Objective: to further develop the SFD approach developing a robust approach to estimating feacal flows providing easy-to-use tools to support cities and towns to estimate feacal flows creating a dataset which allows a fuller analysis of the state of sanitation in a wider range of cities

3 Database of 47 cities, and growing. 3

4 Standardised methodology Review of secondary literature. KII with service providers and stakeholders. Structured observations and direct measurements. Manual for SFD production Analysis of the context in each city to reveal critical points of failure in the provision of urban sanitation services

5 Online tools
6
7
8 Summary data from studies so far (47 cities) Onsite systems Offsite systems Open defecation Safely managed Unsafely managed Excreta disposal (% of totals) in 48 cities from South and Central America, Africa and Asia
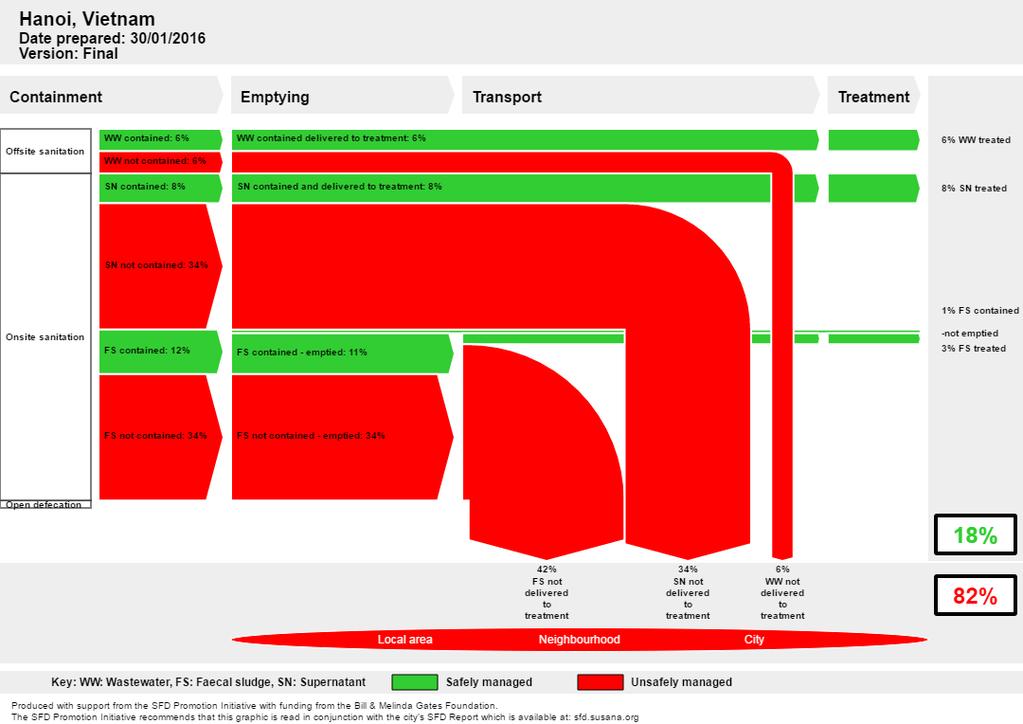
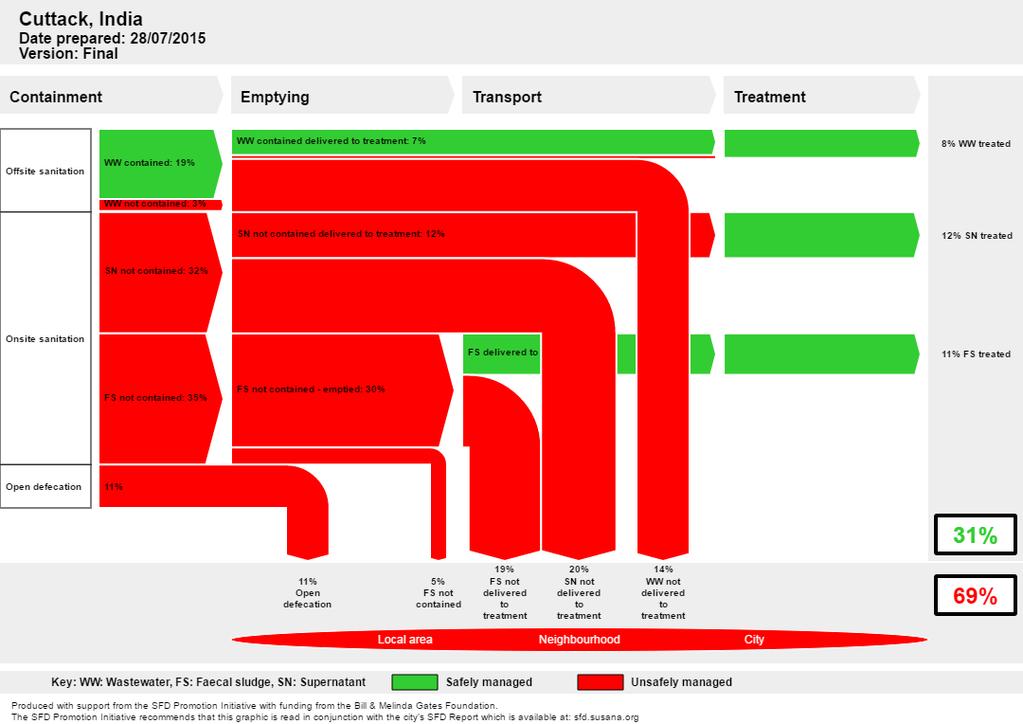
9 Khulna Phnom Penh Srikakulam Dhaka Solapur Dewas Teguclgalpa Niamey Bishoftu Hanoi Gwalior Holeta Kochi / Cochin Axum Kabul Bahir Dar Cuttack Dakar Kisumu Burie Bignona Moshi Nakuru Danang Kampala Dar es Salaam Manila Lima Maputo Yei Aizawl Managua Kampala Agra Kumasi Tumkur Delhi Bikaner Santa Cruz Tiruchirappalli Durban Hawassa Tirupati Nonthaburi Nashik Palu Dumaguete Summary data from studies so far (47 cities) 100% 80% 60% 40% 20% 0% unsafely managed safely managed On-site (64%) Sewerage (34%) Open defecation (2%) 9
10 Khulna Phnom Penh Srikakulam Dhaka Solapur Dewas Teguclgalpa Niamey Bishoftu Hanoi Gwalior Holeta Kochi / Cochin Axum Kabul Bahir Dar Cuttack Dakar Kisumu Burie Bignona Moshi Nakuru Danang Kampala Dar es Salaam Manila Lima Maputo Yei Aizawl Managua Kampala Agra Kumasi Tumkur Delhi Bikaner Santa Cruz Tiruchirappalli Durban Hawassa Tirupati Nonthaburi Nashik Palu Dumaguete Summary data from studies so far (47 cities) 100% 80% 60% 40% 20% 0% On-site: Onsite: contained, fill & covernot emptied On-site: Onsite: delivered emptied and & treated Sewer: treated delivered and treated Sewer: poor delivered, treatment not treated Sewer: not leakages delivered to treatment On-site: Onsite: delivered, poor treatment not treated On-site: Onsite: not illegal delivered dumping to treatment On-site: Onsite: not contained Open defecation 10
11 Khulna Phnom Penh Srikakulam Dhaka Solapur Dewas Teguclgalpa Niamey Bishoftu Hanoi Gwalior Holeta Kochi / Cochin Axum Kabul Bahir Dar Cuttack Dakar Kisumu Burie Bignona Moshi Nakuru Danang Kampala Dar es Salaam Manila Lima Maputo Yei Aizawl Managua Kampala Agra Kumasi Tumkur Delhi Bikaner Santa Cruz Tiruchirappalli Durban Hawassa Tirupati Nonthaburi Nashik Palu Dumaguete Summary data from studies so far (47 cities) 100% 80% 60% 40% 20% 0% Sewer: treated delivered and Sewer: poor delivered, treatment not treated Sewer: not leakages delivered to treatment treated 11
12 Khulna Phnom Penh Srikakulam Dhaka Solapur Dewas Teguclgalpa Niamey Bishoftu Hanoi Gwalior Holeta Kochi / Cochin Axum Kabul Bahir Dar Cuttack Dakar Kisumu Burie Bignona Moshi Nakuru Danang Kampala Dar es Salaam Manila Lima Maputo Yei Aizawl Managua Kampala Agra Kumasi Tumkur Delhi Bikaner Santa Cruz Tiruchirappalli Durban Hawassa Tirupati Nonthaburi Nashik Palu Dumaguete Summary data from studies so far (47 cities) 100% 80% 60% 40% 20% 0% On-site: Onsite: delivered emptied and & treated On-site: Onsite: delivered, poor treatment not On-site: Onsite: not illegal delivered dumping On-site: Onsite: not contained treated treated to treatment 12
13 Summary data from studies so far (32 cities) Open defecation; 3% FS not contained; 29% WW contained, delivered to treatment and treated; 25% WW contained, delivered to treatment not treated; 6% FS contained, delivered to treatment, not treated; 3% FS contained, delivered to treatment and treated; 4% FS contained onsite; 9% SN not contained; 5% WW not contained; 15% SN contained, delivered and treated; 1%
14 Summary data AFRICA so far (14 cities) Open defecation; 2% WW contained, delivered to treatment and treated; 4% WW contained, delivered to treatment not treated; 2% WW not contained; 4% FS not contained; 36% FS contained onsite; 27% FS contained, delivered to treatment, not treated; 10% FS contained, delivered to treatment and treated; 14%
15 Summary data INDIA so far (14 cities) Open defecation; 8% WW contained, delivered to treatment and treated; 10% WW contained, delivered to treatment not treated; 1% WW not contained; 9% SN contained, delivered and treated; 2% FS not contained; 44% SN not contained; 5% FS contained onsite; 19% FS contained, delivered to treatment, not treated; 0% FS contained, delivered to treatment and treated; 3%
16 Take away lessons from the research Many onsite systems are NOT WHAT THEY SEEM The distinction between onsite and offsite is not always helpful (a lot of onsite effluent/ supernatant gets into the drainage network for example) Getting data on emptying is difficult, particularly manual emptying formalisation would improve management information Modelling septic tanks is challenging in the absence of data on relative risks of the solid and liquid fractions Depending on the context SFDs can have varying levels of detail SFD-PI does not convert flows to volumes because volumetric production rates are extremely variable. Local monitoring would improve management information

17 Ongoing and follow up work