Climate and Land Use Consequences to 100-Year Flooding
|
|
|
- Mae Davidson
- 5 years ago
- Views:
Transcription


1 Climate and Land Use Consequences to 100-Year Flooding Presented by: Ann Scholz, PE, CPSWQ Grad Student, University of New Hampshire Robert Roseen & Thomas Ballestero, UNH Stormwater Center Michael Simpson, Antioch Universtity New England Colin Lawson, Trout Unlimited Eastern Conservation Fay Rubin & Cameron Wake, Institute for the Study of Earth, Oceans and Space, UNH 2011 World Environmental & Water Resources Congress Palm Springs, California May 23, 2011
2 Project Objectives Construct a current hydrologic and hydraulic model for the watershed and river respectively Improve the existing information regarding base flood elevations and flood risk areas Assess the effect of future development and increased precipitation due to climate change Present land use management strategies to mitigate runoff volumes 2


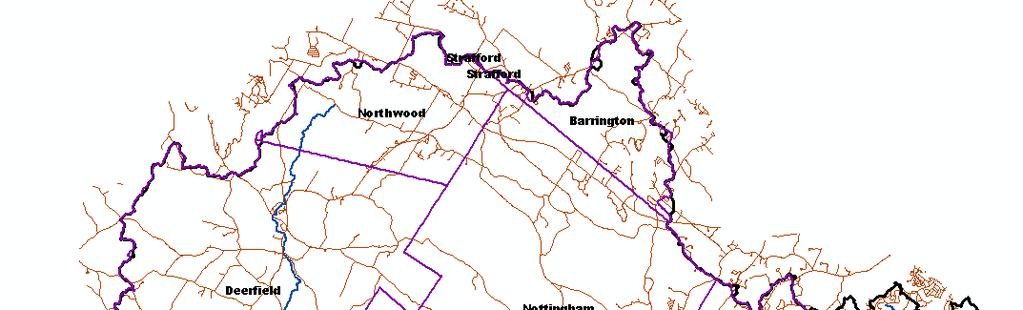
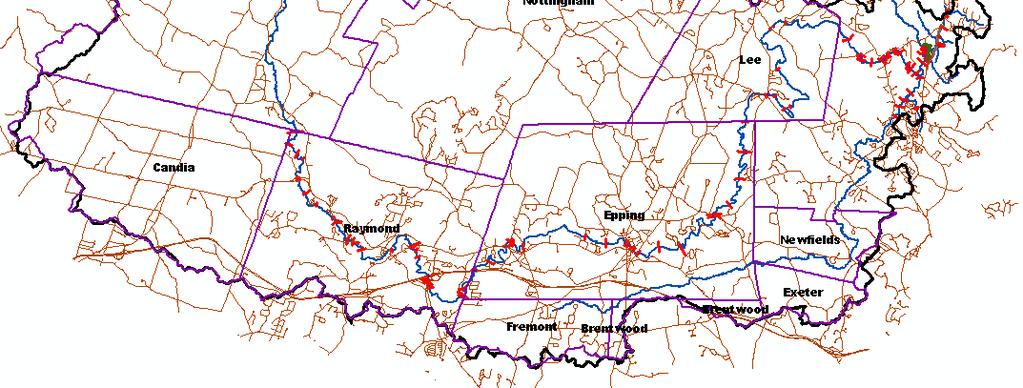
3 Lamprey River Watershed 3
4 15 Highest Events Daily Discharges on Lamprey River near Newmarket Rank Date Discharge (cfs) 1 16-May May Apr Apr Apr Apr Apr Mar Mar Mar Oct Oct May Mar Mar Apr Mar Apr Feb Mar Apr Jun Jun Mar Apr Of 15 largest events since 1934: 11 have occurred in last 25 years 10 have occurred in last 15 years 7 have occurred in last 5 years Source: 4
5 FEMA Requirements for Redelineation Hydrologic Analysis: o Bulletin 17B for gaged streams Effective Model 1935 through 1987 Q 100 = 7,300 cfs o Criteria for revised hydrologic analysis Statistically Significance (68-percent confidence interval) L 0.01,0.68 = 6,886 cfs H 0.01,0.68 = 7,834 cfs 75 yr record Q 100 = 9,411 cfs Statistically Significant 5
 Stream Networks River Reach Files (RF)/National Hydrography Dataset (NHD) Streamflow Gage")
 State Soil Geographic Data Base (STATSGO) Land Use Cover USGS Land Use Land Cover (LULC)")
6 GIS Data Assembly Terrain Digital Elevation Model (DEM) Watershed(s) Hydrologic Unit Code (HUC) Transportation data and water features Digital Line Graph (DLG) Stream Networks River Reach Files (RF)/National Hydrography Dataset (NHD) Streamflow Gage Data Locations Latitude/Longitude Aerial Background Digital Orthophoto Quarter Quads (DOQQ) Soil type data Soil Surveys Geographic Data Base (SSURGO) State Soil Geographic Data Base (STATSGO) Land Use Cover USGS Land Use Land Cover (LULC) State/Municipal GIS 6
7 Hydrology Overview Standard Hydrologic Grid Hydrologic Rainfall Analysis Project HEC-GeoHMS (ArcHydroTools) to process DEM Delineate Watershed and Sub-watershed GIS Preprocessed Spatial Hydrology Data Base DEM Reconditioning Runoff Parameters Stream Network HEC-HMS Input File 7

8 Watershed Hydrologic Analysis W6730 W7060 W6510 Subbasin Area (mi2) W W W W W W W W W W W Total W7920 W8600 W8380 W11020 W8590 W11900 W10910 W


9 Land Use Within the Watershed Subbasin CN W W W W W W W W W W W W6510 W6730 W7060 W7920 W8600 W8380 W8590 W11020 W11900 W10910 W
10 LID Buildout Scenarios Commercial Zoning One Acre Residential Runoff Curve Number Reduction Method from : 1. McCuen, R. and M. D. E. (1983). Changes in Runoff Curve Number Method; 2. Maryland Department of Environment (2008). Maryland Stormwater Design Manual, Supplement No
11 2050 CN Values Moonlight Brook, Newmarket Current Conditions, CN = 66.8 Conventional Build-Out, CN = 78.0 LID Build-Out CN =
12 Regional Curve Number 12


13 Hydrologic Model Scenarios Project Models Rainfall Rates and Global Change Model Scenario Climate Period Climate Period Land Use Rainfall Atlas Conditions TP-40 NRCC NRCC Regional Model 6.3 in/hr 8.5 in/hr 8.5 in/hr X in/hr Current Build-out LID/Build-out
14 Hydraulic Overview HEC- GeoRAS (ArcView ) Create Stream Stationing and Reaches GIS Preprocessed Spatial Hydrology Data Base Create Stream Cross Sections Extract Elevation Data HEC-RAS Input File RAS Mapping 14
15 HEC-GeoRAS Hydraulic Analysis 15
16 Hydraulics Model Diverted Flow Effective Model Assumed 20-percent of flood flow bypassed to the Oyster River watershed HEC-RAS Junction at Lamprey River and RT 108 floodplain corridor Reach River Sta Profile W.S. Elev E.G. Elev Q Total Downstream (ft) (ft) (cfs) EGL Diff. USaltRT SCS 100-YR , USaltRT Apr , USaltRT Mar , Junction: RT108 FP Optim. % Bypass DS RT108 FP 8890 SCS 100-YR , % DS RT108 FP Apr , % DS RT108 FP Mar , % OR_Bypass 6377 SCS 100-YR , % OR_Bypass Apr % OR_Bypass Mar , % 16
17 Hydraulics Model Results for RT108
18 Hydraulics Model Results for RT River = Beaudette Brook Reach = DS RT108 FP NRCC 100-YR WSE = April 2007 WSE = March 2010 WSE =33.58 FIS WSE = 33.0 Observed WSE: April March Legend WS SCS 100-YR WS WS Ground Bank Sta tion (ft) Elevat Station (ft) 18
19 Hydraulics Model General Profile Plot 220 Lamprey River EGL Profile Plot Elevation (ft) Reach Length (ft) HEC-RAS FIS 19
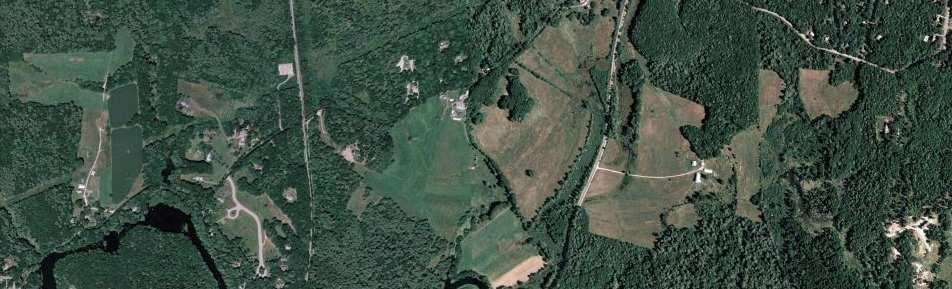
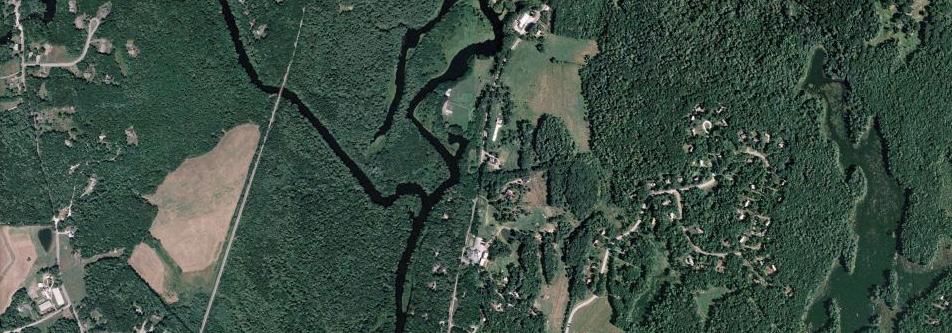
20 Watershed Buildout 20
21 Flood Flows 21
22 Acknowledgments Robert Roseen, Director, UNH Stormwater Center Thomas Ballestero, Department of Civil Engineering, UNH Cameron Wake, Institute for the Study of Earth, Oceans and Space, UNH Steve Miller, Great Bay National Estuarine Research Reserve Kathy Mills, Great Bay National Estuarine Research Reserve Fay Rubin, Institute for the Study of Earth, Oceans and Space, UNH Michael Simpson, Antioch University New England Lisa Townson and Julia Peterson, UNH Cooperative Extension Cliff Sinnott, Rockingham Planning Commission 22
 whose mission is to support")

23 Funding Funding is provided by the Cooperative Institute for Coastal and Estuarine Environmental Technology (CICEET) whose mission is to support the scientific development of innovative technologies for understanding and reversing the impacts of coastal and estuarine contamination and degradation.


24 Thank you for your time. Questions?