Energy Policies for Developing Countries: The Case of Namibia
|
|
|
- Aleesha Clark
- 5 years ago
- Views:
Transcription
1 Energy Policies for Developing Countries: The Case of Namibia Hans-Joachim Ziesing 16 th Annual Meeting of the Reform Group Schloss Leopoldskron, Salzburg, August/September 2011
2 Agenda A more touristy introduction Namibia in facts and figures Namibia in an international context Energy efficiency: Ideas, plans and activities Conclusions
3 Agenda A more touristy introduction Namibia in facts and figures Namibia in an international context Energy efficiency: Ideas, plans and activities Conclusions
 Germany: 357112 km 2 (229 pop/km 2")
4 Where Namibia is Namibia: km 2 ( 2,6 pop/km 2 ) Germany: km 2 (229 pop/km 2 )

5 Okavango near Rundu

6 Okavango near Rundu


7 Fish River Canyon in south of Namibia

8 Sunset at Namib Rand Nature Reserve in Namibia

9 Okavango near Rundu


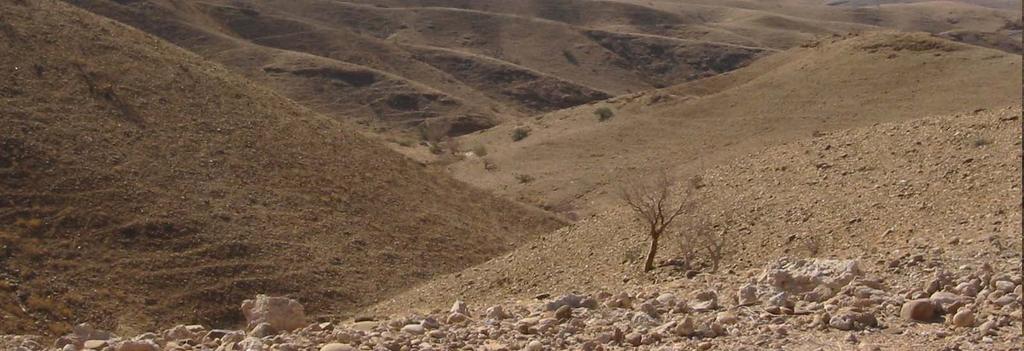
10 Typical landscape in Namibia (near to Omaruru)
11 Agenda A more touristy introduction Namibia in facts and figures Namibia in an international context Energy efficiency: Ideas, plans and activities Conclusions
12 Basis figures for Namibia Area: km 2 ; more than double as large as Germany Namibia has a population of only 2.17 million (2009), with almost two-thirds living in rural areas. Population density: 2.6 inhabitants per km 2 More than 70% of the urban areas and some 15% of rural households are connected to the electricity grid. Most households do not have access to commercial electricity. For 2008 the electrification rate was 34%. Independent republic since March 21, 1990 Official language: English since 1990 TPES: 1.7 million toe (2009) Total electricity consumption: 3.5 TWh (2009) Total CO 2 emissions: 3.9 million tonnes (2008).
13 Trends in Namibia Namibia together with only six other countries out of a total of 48 countries in Sub-Saharan Africa is classified as an upper middle income economy with an expanding economy. [GDP (ExR) per capita: 2673 US-$; GDP (PPP) per capita: 5820 US-$] The annual economic growth from 1990 to 2009 was 4.3% and from 2000 to 2009 even 4.5 %. In the period 1995 to 2009, the primary energy supply expanded with an annual rate of 4.6% (2000/2009: 5.9%) and the total electricity consumption with 6.0% (2000/2009: 5.2%). CO 2 emissions from fossil fuel combustion amounted to around 3.9 million tonnes in 2008, almost 120% higher than This means an annual increase of 6.1%.
14 Namibia: Energy Supply and Consumption 2009 (ktoe) Coal & peat Crude oil Petroleum products Gas Nuclear Hydro Geotherm. / solar etc. Combust. Renw. & waste Electricity Heat Total Production Imports Exports Intl. Marine bunkers 0 Stock changes -8-8 TPES Electricity and CHP plants Petroleum refineries 0 Other transformation* TFC INDUSTRY SECTOR TRANSPORT SECTOR Aviation Road Non-specified OTHER SECTORS Residential Comm. and publ. Services 3 3 Agriculture/forestry Non-specified** NON-ENERGY USE 6 6 Electricity generated - GWh Heat generated - TJ 0 * Includes transfers, statistical differences, own use and distribution losses. ** Includes fishing Source: IEA, Energy Balances of Non-OECD Countries (2011 Edition)
15 Reserves/Resources of Crude Oil, Natural Gas, Hard Coal and Uranium 2007 in Namibia and Worldwide Crude Oil Natural Gas Hard Coal Uranium Namibia World Namibia World Namibia World Namibia World million tonnes billion cubic metres million tonnes 1000 tonnes Production ,9 41 Cumulative Production , Reserves , Resources , Total Potential , Remaining Potential , source: Federal Institute for Geosciences and Natural Resources (BGR), Germany,Hanover, 2008.
16 Worldwide Production of Uranium 2009: The most important countries Production Share in % t U country cumulative Kazkhstan Canada Australia Namibia Russia Niger Uzbekistan USA Ukraine China, PR Others Total world source: Federal Institute for Geosciences and Natural Resources (BGR), Germany,Hanover, 2010.
17 Solar Technologies installed in Namibia 2004 to 2007 Data in kw peak PV electric 16,8 94,7 94,4 138,7 Solar water pumping 36,7 25,0 95,9 180,2 Solar thermal REEEI renewable energy survey 2008
18 Agenda A more touristy introduction Namibia in facts and figures Namibia in an international context Energy efficiency: Ideas, plans and activities Conclusions
19 Namibia in an international context: Some results Namibia belongs to the countries with the lowest energy intensity a very low energy consumption per capita a low electricity intensity a low electricity consumption per capita a high share of renewable energies the lowest self-sufficiency and vice versa a very high import dependency low CO 2 emissions intensity and low CO 2 emissions per capita
20 Standardised values of GDP (PPP) per capita and energy intensity (TPES/GDP-PPP) in 2006 in 153 countries and regions 11 GDP(PPP)/cap TPES/GDP(PPP) Germany Namibia world-wide average = countries No.
21 Correlation between GDP (PPP) per capita and energy intensity (TPES/GDP-PPP) in 2006 in 153 countries and regions 1.2 TPES/GDP-PPP (toe/thousand 2000 US$ PPP) Namibia Namibia belongs to the countries with the lowest energy intensity Germany GDP-PPP/cap (constant 2000 US$ PPP/cap.)
22 Energy intensity in 2006 in 46 selected countries and regions World: Namibia belongs to the countries with the lowest energy intensity 0.0 Namibia Ireland Switzerland Italy Denmark Israel Austria UK Spain Norway Japan EU-27 Germany Netherlands Luxembourg Cyprus France Slovenia Sweden Chin. Taipei New Zealand Australia Belgium USA Korea Estonia Slovak Rep. Czech Rep. Finland Singapore Canada Africa Oman Saudi Arabia Kuwait UAE Iceland Russia Brunei Turkmenista Kazakstan Bahrain Netherl. Ant. Qatar OECD Total TPES per GDP(PPP) in toe/thousand 2000 US$ source: IEA,2008.
23 Primary energy consumption and GDP (PPP) per capita in 2006 in 148 countries and regions Namibia belongs to the countries with a very low energy consumption per capita 12.0 TPES per capita (toe/cap) Namibia Germany GDP-PPP/cap (constant 2000 US$ PPP/cap.)
24 Correlation between GDP (PPP) per capita and electricity intensity in 2006 in 153 countries and regions 1.4 Electricity consumption/gdp-ppp (in kwh per 2000 US$ PPP) Namibia Namibia belongs to the countries with a low electricity intensity Germany GDP-PPP/cap (constant 2000 US$ PPP/cap.)
25 Electricity intensity in 2006 in countries with more than 1000 kwh/cap. (61 countries) Namibia belongs to the countries with a low electricity intensity World: Botswana Cuba Tunisia Domin. Rep. Gabon Ireland Costa Rica Argentina Mexico Uruguay Panama Latvia UK Denmark Namibia Italy Netherlands Lithuania Greece Hungary Switzerland Thailand Austria Turkey Luxembourg Spain Germany Brazil Poland Cyprus Portugal Romania Oman France Malta Israel Belgium Chile Japan Croatia Singapore Turkmenistan P's Rep. Of China Isl. Rep. of Iran Armenia Bosnia/Herzeg. Egypt Czech Rep. Malaysia Slovenia Slovak Rep. Trinidad/Tobago Libya USA Jordan Netherl. Ant. Estonia Australia ChineseTaipei Korea New Zealand Electricity consumption per GDP PPP (kwh per 2000 US$ PPP) source: IEA, 2008.
26 Electricity consumption and GDP (PPP) per capita in 2006 in 144 countries and regions Electricity consumptiuon per capita (1000 kwh/cap) Namibia belongs to the countries with a low electricity consumption per capita Namibia Germany GDP-PPP/cap (constant 2000 US$ PPP/cap.)
27 Share of renewable energies in total primary energy supply (TPES) in selected countries in Namibia belongs to the countries with a high share of renewable energies 20 World: 12.4 % 0 D.R. Congo Tanzania Zambia Nigeria Kenya Zimbabwe Ghana Angola Vietnam Africa Brazil Philippines Pakistan Indonesia Sweden India Colombia Austria Finland Botswana Namibia Thailand Canada PR of China Romania Venezuela South Africa Turkey Mexico Germany Argentina Spain Italy France Australia Poland Malaysia USA Czech Rep. Japan Netherlands Russia UK Ukraine Kazakhstan Uzbekistan Share of renewables in TPES in % source: IEA, 2009.
28 Self sufficiency in 2007 in 121 countries and regions Congo Namibia belongs to the countries with the lowest self-sufficiency 10 Energy production/tpes Angola Gabon Libya Algeria Namibia Africa source: IEA, 2009.
29 Correlation between GDP (PPP) per capita and CO 2 emissions intensity (CO 2 /GDP-PPP) in 2006 in 142 countries and regions CO 2 emissions per unit of GDP-PPP (kg CO 2 /US-$ PPP) source: IEA, Namibia Namibia belongs to the countries with a low CO 2 emissions intensity Germany GDP-PPP/cap (constant 2000 US$ PPP(cap)
30 Intensity of CO 2 emissions in 2006 in 144 countries and regions kg CO2 / US$ using 2000 prices PPP Namibia belongs to the countries with a low CO 2 emissions intensity Germany Namibia country's No. source: IEA, 2007.
31 CO 2 emissions per capita in 2006 in countries/regions with emissions of 1 t CO 2 per capita and more in 2006 (49 countries) Namibia belongs to the countries with low CO 2 emissions per capita world Kuwait Australia United States Saudi Arabia Chinese Taipei Kazakhstan Oman Estonia Russia Ireland Denmark Germany Japan United Austria Poland Spain South Africa Ukraine Isl. Rep. of Iran Bulgaria France Venezuela Romania China Jamaica Mongolia Argentina Chile Latvia Jordan Lebanon Syria Algeria Botswana Egypt Tunisia Ecuador Uruguay Brazil Gabon Namibia Bolivia Costa Rica Albania Morocco Colombia India Peru CO2 emissions per capita (in t CO2) source: IEA, 2008.
32 Namibia in an international context: Some results Namibia belongs to the countries with the lowest energy intensity a very low energy consumption per capita a low electricity intensity a low electricity consumption per capita a high share of renewable energies the lowest self-sufficiency and vice versa a very high import dependency low CO 2 emissions intensity and low CO 2 emissions per capita
33 Agenda A more touristy introduction Namibia in facts and figures Namibia in an international context Energy efficiency: Ideas, plans and activities Conclusions
34 The growing role of the electricity sector. high annual growth in electricity demand of 5 % or more; development of export processing zones (EPZ); electricity required for water pumping and desalination projects; new opportunities for mining development; continued emphasis on improving household access to electricity, and the considerable investments needed to expand the capacity of the electricity system.
35 causes some essential challenges increasing sector efficiency; improving access to electricity in a sustainable manner, particularly in rural areas; increasing security of supply, while taking into account the risk of stranded investments; promotion and development of the sector as a key vehicle for investment and growth; ensuring environmental and socio-economic sustainability; alleviation of resource constraints in the electricity sector; and development of an efficient and appropriate governance framework and structure
36 first reactions legislation for the electricity sector was developed, and with the Electricity Act of 2000 (revised in 2007) the Electricity Control Board (ECB) was created as the industry regulator; Regional Electricity Distributors (RED) have been established, but by June 2009, only three of the five envisaged distribution bodies had become operational; the Rural Electrification Distribution Master Plan and the Offgrid Energisation Master Plan were elaborated 2007; a division for renewable energy in the Ministry as well as the Renewable Energy and Energy Efficiency Institute (REEEI) were created, and a Solar Revolving Fund was established, which provided financing for solar home systems and water heaters, starting a program for energy-shops.
37 Activities for improving energy efficien cy The only official policy paper dealing specifically with considerations on energy efficiency is the White Paper on Energy Policy of 1998 by the Ministry of Mines and Energy. Studies on Demand-Side-Management and subsequent measures A more specific action plan or strategy, similar to the one adopted in South Africa in March 2005 and June 2009, has been initially drafted by the Renewable Energy and Energy Efficiency Institute in The National Energy Efficiency Programme
38 According to the White Paper on Energy Policy the Government will investigate the nature of energy end-use patterns in all sectors and use the data captured to monitor and assess energy efficiency in these sectors. embark on national awareness campaigns to promote the efficient and sustainable use of energy in Namibia. promote the use of energy-efficient appliances and the construction of thermally efficient buildings in households. encourage the application of building technologies and practices enhancing energy efficiency and conservation in government, industrial and commercial buildings. promote the application of energy efficiency and conservation measures in industry. promote fuel saving measures in the transport sector. establish an institutional base to manage a programme on energy efficiency and energy conservation.
39 The Demand-Side-Management Studies identified the following activities in the electricity sector Launching a consumer education and awareness campaign Introducing time-of-use electricity tariffs Dissemination of Compact Fluorescent Lamps (CFLs) Replacing electric water heaters with solar water heaters Expanding ripple control measures Conducting energy audits in the industrial and commercial sector.
40 Priorities of the Efficiency Strategic Action Plan. Implementation of the DSM measures identified in the ECB Study; Establishment of an energy efficiency accord and binding EE targets with big energy consumers (industry) as is the case in South Africa; Capacity building through regular energy management training; Compulsory energy audits in public buildings; Making fiscal and non-monetary incentives the preferred tools in achieving the desired energy efficiency; All encompassing energy planning initiative by motivating all local, regional and national authorities to incorporate EE activities into their strategic integrated resource plans; Establish an on-going monitoring and evaluation program.
41 and their recommendations Focus on corporate senior leadership for training on energy efficiency in order to establish energy management standards; Provide fora to share best practices across firms in the industrial sector; Support the establishment of energy service companies (ESCOs) for all sectors; Government should explore and promote CDM opportunities through energy efficiency; Government should establish energy efficient agents in key ministries; Government should include energy efficiency in budgeting and policy drafting within line ministries and local authorities; Government should ensure there is measuring, verification and monitoring of energy efficiency activities.
42 The National Energy Efficiency Programme was designed to achieve the following outcomes Improved access to EE finance by the expansion of capacity in financial institutions; EE improvements in Namibia s main energy-intensive industries; Increased institutional capacity and awareness and information on EE; Improved policy and regulatory framework for EE investments; Monitoring, feedback, adaptive learning and evaluation.
43 Agenda A more touristy introduction Namibia in facts and figures Namibia in an international context Energy efficiency: Ideas, plans and activities Conclusions
44 ??????? There are many ideas, many studies with many useful recommendations for improving energy efficiency but like in other countries, the realisation of all this is far behind the knowledge what should and what can be done. However: Namibia is a huge country by land area with only a small population, and it is a poor country with huge discrepancy between the city and the rural zones and between the many poors and the few rich people. So there are many problems to be solved and this will influence the priorities of political activities
45 Namibia in an international context: Some results
46 Namibia in an international context: Some results
47 Namibia in an international context: Some results
48 Namibia in an international context: Some results
49 Namibia in an international context: Some results