Wynn Everett Boston Presentation to MGC Staff
|
|
|
- Charity O’Neal’
- 5 years ago
- Views:
Transcription
1 Wynn Everett Boston Presentation to MGC Staff Presented by Keri Pyke, P.E., PTOE Howard/Stein-Hudson Associates, Inc. July 23,
2 Keri Pyke, P.E., PTOE Summary of Qualifications B.S. in Civil Engineering, Rensselaer Polytechnic Institute, 1993 Registered Professional Engineer in MA, CT, NY, RI, NH, NC Certified Professional Traffic Operations Engineer (PTOE) by the Institute of Transportation Engineers (ITE) Over 21 years experience in traffic engineering and transportation planning Representative Project Experience Seaport Square in South Boston Bulfinch Triangle development parcels, Boston Malden Station, Malden East Milton Square Parking and Access Study, Milton EMC Westborough-Southborough Campus* Water Street Mills, Stonington, CT* I-93/I-95 Interchange Transportation Study, Woburn/Reading/Stoneham* *completed while at another firm 2
3 Howard/Stein-Hudson Associates, Inc. Overview Over 26 years providing transportation planning/traffic engineering services Representative Traffic Impact Studies for Development Projects Boston University Medical Center, Boston New Brighton Landing, Allston Seaport Square in South Boston Northeastern University Institutional Master Plan One Congress Street mixed use development, Boston One Franklin/Filene s Basement site redevelopment, Boston W Hotel and Towers, Boston 3
4 Traffic Engineering Terminology Abbreviation ATR DEIR DCR EENF EOEEA FEIR ITE LOS MAPC MassDOT MBTA MEPA TDM vph vpd Definition Automatic Traffic Recorder Draft Environmental Impact Report Massachusetts Department of Conservation and Recreation Expanded Environmental Notification Form Executive Office of Energy and Environmental Affairs Final Environmental Impact Report Institute of Transportation Engineers Level of Service Metropolitan Area Planning Council Massachusetts Department of Transportation Massachusetts Bay Transportation Authority Massachusetts Environmental Policy Act Transportation Demand Management vehicles per hour vehicles per day 4
5 Traffic Engineering Standards 301 CMR MEPA Regulations EIR/EIS Guidelines for Traffic Impact Studies, originally adopted October 1988, updated March 13, 2014 Manual on Uniform Traffic Control Devices (MUTCD), FHWA, 2009, with MA amendments (2011) Highway Capacity Manual, Transportation Research Board (TRB), 2010 Project Development and Design Guidebook, MassDOT, 2006 A Policy on the Geometric Design of Highways and Streets (The Green Book), American Association of State Highway Transportation Officials (AASHTO), 2011 Trip Generation Manual, 9 th edition, Institute of Transportation Engineers (ITE),
 = Level of Service. In urban areas, LOS D is considered acceptable.")
6 Transportation Analysis Overview Traffic impact analysis focuses on intersections; they are the most constrained element of the transportation system. Primary measure of effectiveness (MOE) = Level of Service. In urban areas, LOS D is considered acceptable. 6
7 Transportation Analysis Overview Existing Conditions Collect traffic data Analyze intersections Analyze transit services Review safety No-Build Conditions Project to horizon year Add background growth rate Add other projects trips Re-analyze intersections/transit Build Conditions Add Project s trips to No-Build volumes Re-analyze intersections/transit Build Mitigated Conditions Propose mitigation for locations with impact Re-analyze intersections/transit to demonstrate that impact is mitigated Mitigate to No-Build condition (LOS) 7
8 Trip Assignment Process Trip Generation Mode Split Trip Distribution/ Assignment = Projectgenerated Trips 8
9 Transportation Analysis Timeline EENF Certificate DEIR Certificate FEIR Certificate Expanded Environmental Notification Form (EENF), filed May 31, 2013 Secretary s Certificate on EENF and scope of DEIR, issued on July 26, 2013 Draft Environmental Impact Report (DEIR), filed December 16, 2013 Secretary s Certificate on DEIR and scope of FEIR, issued on February 21, 2014 Final Environmental Impact Report (FEIR), filed June 30, 2014 Secretary s Certificate on FEIR anticipated by August 15,

10 EENF Study Area Wynn Project 10

11 EENF Proposed DEIR Study Area Wynn Project 11

12 DEIR Study Area Wynn Project 32 12
13 Transportation Analysis DEIR Wynn Project Analyzed intersection capacity at 57 locations (7 cities) Analyzed transit capacity on Orange Line (northern end) and MBTA bus routes (4) Prepared detailed Project trip generation Prepared detailed Project trip distribution Proposed recommended access to Project site Proposed TDM measures to reduce auto trips Proposed transportation mitigation 13

14 FEIR Study Area Wynn Project 14
15 Transportation Analysis FEIR Wynn Project Analyzed intersection capacity at 21 locations (5 cities) Analyzed transit capacity on Orange Line (northern end) and MBTA bus routes (4) Updated detailed Project trip generation Updated mode splits Proposed recommended access to Project site Proposed TDM measures to reduce auto trips Proposed transportation mitigation 15
16 Travel Mode Share - Wynn Project DEIR FEIR Travel Mode Patrons Employees Patrons Employees Automobile Park on-site 69% 0% 63% 0% Taxi/Private Car Service 8% 0% 8% 0% Park remotely (connect to employee shuttle) 0% 44% 0% 41% Subtotal 77% 44% 71% 41% Public Transportation Orange Line (connect to transit shuttle) 10% 20% 10% 20% Local bus 0% 10% 0% 10% Water transportation 3% 3% 6% 3% Subtotal 13% 33% 16% 33% Tour Bus 10% 0% 10% 0% Premium Park and Ride 0% 0% 3% 3% Walk/Bicycle 0% 3% 0% 3% Neighborhood Employee Shuttle 0% 20% 0% 20% Total 100% 100% 100% 100% 16
17 Trip Generation Summary - Wynn Project DEIR FEIR Patron Vehicle Trips Employee Vehicle Trips Total Vehicle Trips Patron Vehicle Trips Employee Vehicle Trips Total Vehicle Trips Friday Daily (vpd) In 8,983 1,793 10,776 8,289 1,459 9,748 Out 8,983 1,793 10,776 8,289 1,459 9,748 Total 17,966 3,586 21,552 16,578 2,918 19,496 Friday p.m. Peak Hour (vph) In Out Total 1, ,743 1, ,419 Saturday Daily (vpd) In 10,656 2,072 12,728 10,354 1,817 12,171 Out 10,656 2,072 12,728 10,354 1,817 12,171 Total 21,312 4,144 25,456 20,708 3,634 24,342 Saturday Afternoon Peak Hour (vph) In , ,015 Out , Total 1, ,041 1, ,953 17
18 Changes in Traffic Volumes Friday p.m. Peak Hour Wynn Project Location Alford Street (Route 99) Bridge, Charlestown Rutherford Avenue (Route 99), north of City Square, Charlestown Existing (2013) Volume (vph) No-Build (2023) Volume (vph) Projectgenerated Trips (vph) Build (2023) Volume (vph) Change in Volume Build to No-Build (%) 2,702 3, ,760 17% 2,814 2, ,152 7% Note: All volumes reflect Friday p.m. peak hour of roadways, which occurs 4:30-5:30 p.m. Wynn s peak traffic volumes occur between 9:00-10:00 p.m. on a Friday night. 18
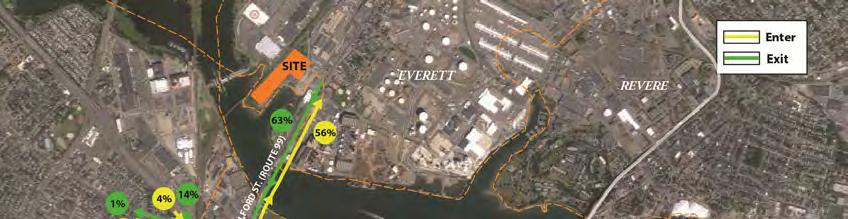
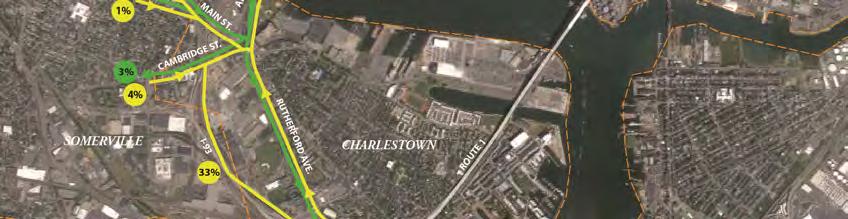
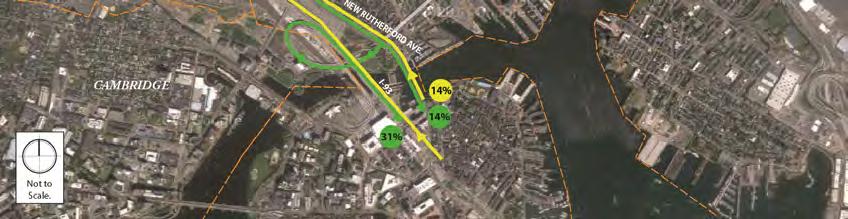
19 Trip Distribution in Boston Wynn Project 19

20 Patron shuttles from Orange Line stations Transit Overview Patrons not expected to take MBTA buses to site Percentage of employees expected to use MBTA buses New water transportation service to be provided by Wynn 20
21 Transportation Demand Management Transportation coordinator on-site Guaranteed ride home Ride sharing program MBTA Charlie Cards provided for employees and sold on-site for guests Provide information regarding public transportation services to employees and guests ZipCar on-site Hubway bike share on-site Covered, secure bicycle parking in parking garage Electric vehicle charging stations in parking garage Employee and patron shuttles to transit stations Water shuttle to downtown Boston 21
22 Boston Intersections Studied in MEPA 22
23 Boston Transportation Infrastructure Analysis Dexter Street/Alford Street (Route 99) Dexter Street/Alford Street (Route 99) HSH analysis: Wynn has proposed mitigation through the MEPA process. Estimated cost = $400,000 23
 = No-Build (2023) Friday p.m. peak hour volumes (Friday p.m. peak hour project trips ) 24")
24 Boston Transportation Infrastructure Dexter Street/Alford Street (Route 99) Legend XX (XX) = No-Build (2023) Friday p.m. peak hour volumes (Friday p.m. peak hour project trips ) 24

25 Boston Transportation Improvements Dexter Street/Alford Street (Route 99) 25


26 Boston Dexter Street/Alford Street (Route 99) Capacity Analysis Summary Friday p.m. Peak Hour 26
27 Boston Transportation Infrastructure Analysis Cambridge Street/I-93 Northbound Off-ramp Cambridge Street/I-93 Northbound Off-ramp HSH Analysis: Wynn has proposed mitigation through the MEPA process. Estimated cost = $4.6 Million (combined with Sullivan Square) 27
 = No-Build (2023) Friday p.m. peak hour volumes (Friday p.m. peak hour project trips ) 28")
28 Boston Transportation Infrastructure Cambridge Street/I-93 Northbound Off-ramp Legend XX (XX) = No-Build (2023) Friday p.m. peak hour volumes (Friday p.m. peak hour project trips ) 28

29 Boston Cambridge Street/I-93 Northbound Off-ramp Capacity Analysis Summary Friday p.m. Peak Hour 29
30 Boston Transportation Infrastructure Analysis Sullivan Square Sullivan Square HSH Analysis: Wynn has proposed mitigation through the MEPA process. Estimated cost = $4.6 Million 30

31 Boston Transportation Infrastructure Sullivan Square 31
 Friday p.m. peak hour volumes (Friday p.m. peak hour project trips ) 32")
32 Boston Transportation Infrastructure Analysis Sullivan Square Legend XX (XX) = No-Build (2023) Friday p.m. peak hour volumes (Friday p.m. peak hour project trips ) 32

33 Boston Sullivan Square Capacity Analysis Summary Friday p.m. Peak Hour 33

34 Boston Proposed Transportation Improvements Cambridge Street/I-93 NB Ramp and Sullivan Square 34
35 Boston Transportation Infrastructure Analysis Austin Street/New Rutherford Avenue (Route 99) Austin Street/New Rutherford Avenue (Route 99) HSH Analysis: No mitigation required. 35

36 Boston Transportation Infrastructure Analysis Austin Street/New Rutherford Avenue (Route 99) Legend XX (XX) = No-Build (2023) Friday p.m. peak hour volumes (Friday p.m. peak hour project trips ) 164 (0) 46 (0) 158 (0) 489 (0) 43 (0) 52 (0) 785 (0) 368 (0) 659 (0) 17 (0) 132 (0) 64 (0) Austin St New Rutherford Ave 523 (109) 36


37 Boston Austin Street/New Rutherford Ave Capacity Analysis Summary Friday p.m. Peak Hour 37
38 Boston Transportation Infrastructure Analysis New Rutherford Avenue (Route 99)/Route 1 Ramps New Rutherford Avenue (Route 99)/Route 1 Ramps HSH Analysis: No mitigation required. 38
 = No-Build (2023) Friday p.m. peak hour volumes (Friday p.m. peak hour project trips ) 39")
39 Boston Transportation Infrastructure New Rutherford Avenue (Route 99)/Route 1 Ramps Legend XX (XX) = No-Build (2023) Friday p.m. peak hour volumes (Friday p.m. peak hour project trips ) 39


40 Boston New Rutherford Avenue (Route 99)/Route 1 Ramps Capacity Analysis Summary Friday p.m. Peak Hour 40
 New Rutherford Avenue (Route 99)/Chelsea Street (City Square) HSH Analysis: No mitigation")
41 Boston Transportation Infrastructure Analysis New Rutherford Avenue (Route 99)/Chelsea Street (City Square) New Rutherford Avenue (Route 99)/Chelsea Street (City Square) HSH Analysis: No mitigation required. 41
 Chelsea St Legend XX (XX) = No-Build (2023) Friday p.m. peak hour volumes (Friday p.m. peak hour project trips ) 42")
42 Boston Transportation Infrastructure New Rutherford Avenue (Route 99)/Chelsea Street (City Square) 292 (0) 228(0) 828 (0) Chelsea St Legend XX (XX) = No-Build (2023) Friday p.m. peak hour volumes (Friday p.m. peak hour project trips ) 42


43 Boston New Rutherford Avenue (Route 99)/Chelsea Street (City Square) Capacity Analysis Summary Friday p.m. Peak Hour 43