SHEEP RIVER AT 128 TH STREET FLOOD HAZARD RISKS AND REVIEW OF MITIGATION OPTIONS
|
|
|
- April Sheena Doyle
- 5 years ago
- Views:
Transcription

1 SHEEP RIVER AT 128 TH STREET FLOOD HAZARD RISKS AND REVIEW OF MITIGATION OPTIONS Submitted to: Municipal District of Foothills No. 31 Calgary, Alberta Submitted by: Calgary, Alberta CW2167.SHEEP
2 is committed to achieving sustainability through balancing economic growth, social responsibility and environmental protection. Learn more at: R:\Water Resources\General\PROJECT\Cw\2167 Foothills 2013 Flood Work\Design and Tender\128 Street\Morphology Writeup\fnl rpt-cw Street- 10May16_EDITED.docx
3 EXECUTIVE SUMMARY During the 2013 flood, the main channel of the Sheep River west of 128 th Street was blocked with debris, resulting in the river breaching its east bank (right bank looking downstream) and flowing through the South Rock gravel pit. A significant portion of the floodwaters drained overland although some of the discharge returned to the main channel immediately downstream of the breach. The overland flow drained northeast through the gravel pit and across 128 th Street (and further eastward across 112 th Street) prior to draining back into the main channel of the Sheep River. This overland flow presented a flood damage threat, resulted in considerable damage at the gravel pit and cut off access to several residences. The flood risk area at this site encompasses an area of approximately 500 hectares which contains 16 titled properties. Subsequent to the 2013 flood, as part of interim mitigation measures, the flow was restored back to the main channel and the east bank armoured where the channel breach occurred. This report contains a review of flood hazard risks of the and evaluation of mitigation options. The objective of the mitigation measures is to reduce flood hazard risks for residents, development and infrastructure. The following two mitigation options for reducing flood hazard risks are evaluated in this report. Option 1 Maintain existing residential development and infrastructure and institute structural measures to safely convey floodwaters in this reach of the river by (1) maintaining the majority of the floodwaters in the main channel; and (2) during large magnitude floods, convey a portion of the floodwaters in an overland flow channel through the gravel pit area, across 128 th Street and back into the Sheep River. The overland flow channel would function in a similar manner to a floodplain that conveys overbank flows and attenuates peak discharge, velocities and erosive forces in the main channel. This option does not mitigate all flood hazard risks for residents and has ongoing maintenance costs. Option 2 Buy out residents that are at a risk from floods and let the river flood in a similar manner as occurred during the 2013 flood. This residential buyout option is recommended as it removes risk of future flood damages to the residents and associated infrastructure and allows the MD of Foothills to follow a flexible, risk management approach that can be applied based on municipal priorities. Therefore, it is recommended that the M.D. of Foothills pursue residential buyouts to resolve outstanding infrastructure threats which cannot be addressed through structural measures. Additionally, as the 2013 flood overland flow into 128 th Street appears to have reduced the magnitude and delayed the arrival of the peak discharge in Okotoks, the buyout option offers the opportunity to allow similar future flood mitigation benefits to downstream areas in the MD of Foothills and the Town of Okotoks. R:\Water Resources\General\PROJECT\Cw\2167 Foothills 2013 Flood Work\Design and Tender\128 Street\Morphology Writeup\fnl rpt-cw Street- 10May16_EDITED.docx Executive Summary
4 TABLE OF CONTENTS 1.0 INTRODUCTION Base Mapping and River Cross-Section Surveys SITE DESCRIPTION Flood Flow Path and Site Features HISTORIC CHANNEL MOVEMENT HYDROLOGY AND MAGNITUDE OF RECENT FLOODS Hydrometric Data Flood Characteristics... 5 Hydrometric Data Review Flood Hydrographs TYPES OF FLOOD RISKS MITIGATION OPTION 1 OVERLAND FLOW MITIGATION MEASURES Inlet Structures Drainage Swale th Street Crossing Outlet Structure Costs Associated with Mitigation Option MITIGATION OPTION 2 BUY OUT RESIDENCES IN HIGH FLOOD RISK AREAS Flood damage Risk levels and Associated mitigation Costs HYDRAULIC MODELLING Calibration of model Scenarios Modelled Existing Conditions Flood Inundation Mapping DISCUSSION OF MITIGATION OPTIONS AND RECOMMENDATIONS CLOSURE R:\Water Resources\General\PROJECT\Cw\2167 Foothills 2013 Flood Work\Design and Tender\128 Street\Morphology Writeup\fnl rpt-cw Street- 10May16_EDITED.docx Table of Contents
5 LIST OF TABLES Table 4.1 Water Survey of Canada Hydrometric Stations... 5 Table 4.2 Sheep River Flood Frequencies... 5 Table 4.3 Recent Sheep River Floods and Estimated Flood Frequencies... 6 Table 6.1 Overland Flow Mitigation Measures Preliminary Cost Estimate...11 Table 7.1 Option 2 Buyout Preliminary Cost Estimate...12 Table 8.1 HEC-RAS Model Summary Table...17 LIST OF FIGURES Figure 2.1: Location Plan Figure 2.2: Property Boundaries and Roll Numbers Figure 2.3: 2013 Flood Flow Path Figure 2.4: Plan View Sheep River Basin Figure 2.5: Sheep River Profile Basin Scale Figure 2.6: Sheep River Profile Study Area Figure 2.7: Channel and Valley Cross Section at 128 th Street Figure 3.1: Comparative Air Photos 1923, 1949, 1980 and 2012 Figure 3.2: Comparative Air Photos 2012, 2013 Post-Flood and 201 Figure 4.1: 2013 Flood Hyrographs Figure 8.1: 2-Year Flood Inundation Existing Conditions Figure 8.2: 10-Year Flood Inundation Existing Conditions Figure 8.3: 100-Year Flood Inundation Existing Conditions LIST OF APPENDICES Appendix A Appendix B Appendix C Appendix D Appendix E Appendix F Appendix G Study Area Photos Hydrometric Data Review 2013 Flood Real-Time Water Level Data (Preliminary) HEC-RAS Modelling Survey and Digital Terrain Model Preliminary Review of 128 th Street Crossing Options Future Gravel Mining Plan R:\Water Resources\General\PROJECT\Cw\2167 Foothills 2013 Flood Work\Design and Tender\128 Street\Morphology Writeup\fnl rpt-cw Street- 10May16_EDITED.docx Table of Contents
6 1.0 INTRODUCTION During the 2013 flood, the main channel of the Sheep River, west of 128 th Street, was blocked with debris, resulting in the river breaching its east bank (right bank looking downstream) and flowing through the South Rock gravel pit. A significant portion of the floodwaters drained overland although some of the discharge returned to the main channel immediately downstream of the breach. The overland flow drained northeast through the gravel pit and across 128 th Street (and some further eastward across 112 th Street) prior to draining back into the main channel of the Sheep River. The flood risk area at this site encompasses an area of approximately 500 hectares which contains 16 properties. Subsequent to the 2013 flood, as part of interim mitigation measures, the flow was restored back to the main channel and the east bank armoured where the channel breach occurred. This report contains a review of flood hazard risks of the and evaluation of mitigation options. The objective of the measures is to reduce flood hazard risks for residents, development and infrastructure. This report contains the following information: Site description including site photos contained in Appendix A; review of background information including historic air photos; results of a detailed ground and channel topographic survey; flood frequency estimates and historic streamflows, Appendix B contains a hydrometric data review of three streamflow monitoring stations that are located upstream and downstream of the study area; real-time water level data (preliminary) for the 2013 flood is presented in Appendix C since the discharge data for key streamflow monitoring stations has yet to be published; hydraulic modelling of existing conditions and proposed mitigation measures contained in Appendix D; design details for structural overland flow mitigation measures; and approximate cost estimates for the structural mitigation options. 1.1 Base Mapping and River Cross-Section Surveys A digital terrain model (DTM) was compiled for the study area based on the following detailed post-2103 flood mapping information that was obtained by : aerial imagery based on drone flights in October 2014; extremely accurate (in the order of a few centimeters) ground surface topographic information based on drone flights (and confirmed by ground truthing) in October Bare earth data were obtained. This survey information is summarized in Appendix E; and; Bathymetric survey of the stream channel in October Twenty-seven channel cross sections were surveyed. R:\Water Resources\General\PROJECT\Cw\2167 Foothills 2013 Flood Work\Design and Tender\128 Street\Morphology Writeup\fnl rpt-cw Street- 10May16_EDITED.docx Page 1
7 2.0 SITE DESCRIPTION The study area is located on the south floodplain of the Sheep River, approximately 8 km northeast of Black Diamond, as shown in Figure 2.1. The study area extended from 1,200 m upstream of the point where the stream breached its east bank and flowed into the south rock pit to 800 m east of 112 th Street. The confluence with Threepoint Creek, which is a major tributary that contributes up to 50% of the flood discharge to the Sheep River, is located at the mid-point of the study area. Figure 2.2 shows the property boundaries and ownership. The affected properties for the overland mitigation are within sections , , , and , south and east of the Sheep River, which include (but not limited to) , , , , , , and residences Flood Flow Path and Site Features Figure 2.3 contains an air photo that was taken during the 2013 flood and the various features shown are discussed below: there is no flow in the meander bend downstream (west) of the channel breach for a distance of a few hundred metres; downstream of the channel breach, the flow splits into: (1) the greater portion of the flow appears to go northeast overland through the South Rock Gravel Pit; and (2) the remainder flow drains north back into the main channel; the overland flow drains through the gravel pit and across 128 th Street; and a few hundred metres east of the 128 th Street crossing, the overland flow splits into: (1) a primary overland flow path drains north back into the Sheep River main channel; and (2) a secondary overland flow path that drains east across 112 th Street and then returns to the main channel of the Sheep River. Figure 2.4 is plan view of the Sheep River basin within the M.D. of Foothills. Figure 2.5 is a stream channel profile of the Sheep River from the upper watershed to its confluence with the Highwood River. The flattening of the stream channel gradient in the vicinity of the 128 th Street study area is clearly evident. This flattening of the gradient would be conducive to deposition of sediment and debris, channel instability and the formation of multiple channels. Figure 2.5 shows the stream channel profile in greater detail in the study area. Figure 2.7 is a channel and valley cross section at 128 th Street. Additional features within the study area are described below and photos are attached in Appendix A. The multiple channel characteristic of the Sheep River begins at the upstream extent of the study area (located 1,200 m upstream of the point where the stream breached) and extends throughout the study area. The channel is confined to the west and the north by the valley wall. The east/south bank is 2 to 2.5 m high and is bounded by a 100 to 300 m wide lower level floodplain. R:\Water Resources\General\PROJECT\Cw\2167 Foothills 2013 Flood Work\Design and Tender\128 Street\Morphology Writeup\fnl rpt-cw Street- 10May16_EDITED.docx Page 2
8 This lower level floodplain was inundated during the 2005, 2008 and 2013 floods (Photos 1 to 7). The upper level floodplain is 300 m to 1,000 m wide and is where the overland flow occurred during the 2013 flood. There are several residences located adjacent to 128 th Street including , , , , , and These residences are generally located within the upper floodplain on higher ground and the residences were not flooded during the 2013 flood. The property was flooded during the 2013 flood but was subsequently bought out by the province and the property is now a municipal reserve. The property is west of the property and is located on the lower floodplain near a secondary channel that conveys water in frequent flood events (i.e. 2-year return period). There are several residences accessed from 112 th Street including , , , and These properties are located on the lower floodplain however the residences are located either on higher ground or built on fill. The 2 to 2.5 m high south bank of the Sheep River is subject to bank erosion, which is an additional concern for these properties. R:\Water Resources\General\PROJECT\Cw\2167 Foothills 2013 Flood Work\Design and Tender\128 Street\Morphology Writeup\fnl rpt-cw Street- 10May16_EDITED.docx Page 3
9 3.0 HISTORIC CHANNEL MOVEMENT Figure 3.1 contains the 1923, 1949 and 2012 air photos and Figure 3.2 contains 2012, 2013 post-flood and 2014 air photos. The comparative air photo review based on this information is discussed below. The locations of features are noted on the air photos, in order to more readily compare channel changes. The 1923 air photo indicates a wide (with depositional features such as bars and islands) main channel. Numerous flood channels dissect the floodplain. The edge of the 1923 active south floodplain extends 500 to 700 m south of the main channel. Feature A is the location of the 2013 channel breach. The 1923 air photo indicates the active channel is located where the 2013 overland flow originated. This air photo was taken after the large floods in June and July In the 1923 air photo Feature B is a meander bend in the vicinity of the confluence with Threepoint Creek. This 1923 configuration represents the southernmost location of the main channel, downstream of the confluence with Threepoint Creek. The 1949 air photo shows the main channel confluence which occurs several hundred metres east of the 1923 location. In 1949, Feature B is adjacent to a significant sub-channel with the main channel located several hundred metres to the north. Consequently, in 1949 there is large island bounded between the main channel and the south sub-channel. Feature C is the narrowest part of the active floodplain. The channel is generally straight and situated adjacent to the valley wall. Feature D is the downstream end of the study area and the channel once again has meandering and multi-channel characteristics. The 1949 to 1980 air photos show a narrower, less active main channel than compared to This may be the result of a sustained period of lower flood years that lasted to The more recent air photos show a more active and wider main channel more similar to that shown in the 1923 air photo. The floods in recent years, discussed in the next section, have resulted in significant erosion and channel widening along the Sheep River and overbank flow. Feature C shown on the 2013 post-flood and 2014 air photos (Figure 3.2), indicates the channel is adjusting to changes that occurred during the 2013 flood. Feature C is in the vicinity of the property During the 2014 high water period, the main channel shifted further to the south into an area that was formerly a sub-channel. This change may impact the properties located downstream in the vicinity of 112 th Street. R:\Water Resources\General\PROJECT\Cw\2167 Foothills 2013 Flood Work\Design and Tender\128 Street\Morphology Writeup\fnl rpt-cw Street- 10May16_EDITED.docx Page 4
10 4.0 HYDROLOGY AND MAGNITUDE OF RECENT FLOODS 4.1 Hydrometric Data Streamflow estimates for the study area and for the Town of Okotoks are based on the Water Survey of Canada (WSC) hydrometric stations listed in Table 4.1. Table 4.1 Water Survey of Canada Hydrometric Stations Station Station Number Drainage Area (km 2 ) Period of Record Sheep River at Black Diamond 05BL ; Sheep River at Okotoks 05BL ; ; Threepoint Creek at Millarville 05BL ; ; Flood Characteristics Flood frequencies estimated by Alberta Environment are listed in Table 4.2 and are contained in: (1) Okotoks Floodplain Study, September 1996; and (2) Black Diamond and Turner Valley Sheep River Flood Hazard Study, Klohn Leonoff Ltd, July Table 4.2 Sheep River Flood Frequencies Return Period (years) Black Diamond Maximum Instantaneous Discharges (m 3 /s) Okotoks Maximum Instantaneous Discharges (m 3 /s) (estimated) Table 4.3 lists the recent large floods at Okotoks, based on preliminary 2013 and 2014 and published 2005, 2006 and 2008 streamflow data. Although only the annual peaks are listed in Table 4.3, it is worth noting that there were three significant flood peaks in 2005 and two in After a sustained period of small magnitude floods that dates back to the mid-1930 s, these recent and frequent large flood peaks as well as the high magnitude of the floods have contributed to channel instability and bank erosion problems occurring during the last several years. R:\Water Resources\General\PROJECT\Cw\2167 Foothills 2013 Flood Work\Design and Tender\128 Street\Morphology Writeup\fnl rpt-cw Street- 10May16_EDITED.docx Page 5
11 Table 4.3 Recent Sheep River Floods and Estimated Flood Frequencies Date Black Diamond Maximum Instantaneous Discharges (m 3 /s) Okotoks Maximum Instantaneous Discharges (m 3 /s) Estimated Return Period (years) June May June June Greater than Greater than June Hydrometric Data Review Streamflow estimates for the study area and for the Town of Okotoks are based on the Water Survey of Canada (WSC) hydrometric stations listed below. The greater proportion of the flood discharge for the Sheep River at Okotoks is the sum of the Sheep River discharge at Black Diamond and Threepoint Creek at Millarville. However, as shown above, the combined drainage area at Black Diamond and Millarville is 1,099.4 km 2, which only accounts for approximately three-quarters of the drainage area of the Sheep River at Okotoks. There are numerous small local drainages that account for the balance of the drainage area not accounted for at Millarville and Black Diamond. The overall contribution of these local drainages to the total streamflow at Okotoks would depend on the aerial extent of the storm that results in the peak discharge. A large storm event that extends from the mountains and into the area around Okotoks would result in the local streams contributing additional flow, albeit a proportion likely less than the one-quarter of drainage area. Compared to the upper watershed, the local watershed has a lower unit peak discharge contribution due to characteristics such as lower elevation, soils and vegetation composition that absorb the precipitation and flatter slopes. Appendix B contains a detailed hydrometric data review of the three hydrometric monitoring stations noted above. This data review was conducted by Greg MacCulloch, P.Eng., who has considerable hydrometric experience and used to work for Water Survey of Canada. Select findings from the review are summarized below: published WSC streamflow data for the 2013 flood is only available for Threepoint Creek at Millarville; it is known that the peak flows for the 2013 year are significant and important in the assessment of risk for this area. At a minimum, the peak flows for the 2013 year should be obtained prior to the assessment of flood risk; caution should be employed in application of derived peak flow rates. The review of rating curve stability indicates significant variability at low flows and the fact that opportunities for high flow measurements are rare makes it difficult to establish accurate ratings curves by direct discharge measurements alone; and R:\Water Resources\General\PROJECT\Cw\2167 Foothills 2013 Flood Work\Design and Tender\128 Street\Morphology Writeup\fnl rpt-cw Street- 10May16_EDITED.docx Page 6
12 special attention should be made to the 2005 summer season. At the only site for which 2013 data is available (Threepoint Creek), peak flows for 2005 were higher than the peak derived for More importantly, three peaks occurred in 22 days during 2005, each of which could have been in the top 10 occurrences for the gauge sites. As the hydrographs demonstrate that annual peaks are commonly the result of the superposition of one or more peaks, the potential for flows similar to 2005 occurring in closer proximity, thereby compounding flows should be considered in the assessment of risk Flood Hydrographs As stated in the previous section, published streamflow data for the 2013 flood is only available for Threepoint Creek at Millarville (the maximum instantaneous discharge was 285 m 3 /s on 21 June 2013). Only preliminary water level data from the Alberta Environment and Sustainable Resource Development (ESRD) and Water Survey of Canada (WSC) real-time monitoring websites were available for the Sheep River stations at Black Diamond and at Okotoks. The streamflow monitoring station at Black Diamond was damaged during the flood, although it appeared to record data close to the peak. Figure 4.1 contains the preliminary estimated 2013 flood hydrographs for the three hydrometric stations of interest. The Sheep River discharges (both at Black Diamond and Okotoks) shown on Figure 4.1 are based on the preliminary water levels contained on the WSC real-time data website along with the real-time discharge plots obtained from the ESRD real-time website. The 2013 flood discharge estimates for the Sheep River stations were estimated from these preliminary water levels based on the most recent rating curves (the relationship between water levels and discharge) and the ESRD real-time discharge plots. This preliminary water level information is shown in Appendix C. The extrapolation of the rating curves to obtain the maximum peak instantaneous discharge is also shown in Appendix C. The following stage and discharge information is based on the information contained in Appendix C. Sheep River at Black Diamond. Maximum Stage = 4.9 m. Annual Maximum Instantaneous Peak Discharge for 2013 = 720 m 3 /s. Sheep River at Okotoks. Maximum Stage = 30.9 m. Annual Maximum Instantaneous Peak Discharge = ~1100 m 3 /s (estimated). There is a delay between the flood peaks recorded at Black Diamond and Millarville and those recorded at Okotoks as it takes a few hours for the flood wave to travel downstream. This downstream progression of the flood wave can be replicated mathematically by conducting a flood routing analysis, which has not been undertaken to-date. However, it is still possible to make the following general observations based on Figure 4.1. These observations are based on interpretations of the recorded hydrometric data in conjunction with our understanding of the events that occurred within the 128 Street area during the 2013 flood. The unique characteristics of the Okotoks 2013 flood hydrograph are likely due to the channel breach, inundation and flood water storage throughout the 128 Street area, and many secondary R:\Water Resources\General\PROJECT\Cw\2167 Foothills 2013 Flood Work\Design and Tender\128 Street\Morphology Writeup\fnl rpt-cw Street- 10May16_EDITED.docx Page 7
13 channels that became active during heightened flows. It is difficult to say definitively what caused the specific aspects of the Okotoks hydrograph characteristics on each of these contributing factors, however the information available supports the observations listed below. Approximately midway through the portion of the flood that is shown, the Sheep River at Okotoks hydrograph shows a plateau for a few hours and then a fast and significant reduction in discharge followed by a fast increase in discharge before flattening out at the peak of the flood. This flood peak reduction and delay is likely the result of the channel breach and overland flow process that was previously described. The 128 th Street area appears to have acted as a reservoir for the storage of floodwaters during the 2013 flood, which greatly benefited downstream areas in the M.D. of Foothills and the Town of Okotoks. The plateau for a few hours before the reduction could be due to the natural process of inundation of the floodplain in the 128 th Street area, caused by an exceedance of the main channel s maximum flow conveyance, prior to the channel breach. An approximation of the volume of floodwaters stored in the 128 th Street area can be obtained from a review of the topographic survey information (Appendix E) for the area that was inundated during the 2013 flood as shown in Figure 2.3. The estimated depth of inundation is based in-part on the hydraulic modelling information that is presented later in the report in Section 8. The storage volume is approximately in the range from 1,400,000 to 1,700,000 m 3, based on the above noted method. The above information and interpretation is preliminary and subject to review in further detailed studies and also when 2013 streamflow data for the Sheep River is published by Water Survey of Canada. Items that should be considered for more detailed review include the following: compare the Sheep River discharge estimates contained in Figure 4.1 with the WSC streamflow estimates, when that data is published; further investigations of Town of Okotoks 2013 flood information, including: (1) any photo-documentation monitoring (e.g. at bridges) that indicates water levels; (2) water treatment plant water level data; and (3) High Water Mark data; Threepoint Creek indicates a more gradual increase in streamflows than the Sheep River. Further investigate the basin precipitation (i.e. isohyet maps) to evaluate whether precipitation was less intense in the Threepoint Creek basin, compared to the Sheep River basin. Additionally, the Threepoint Creek peak discharge was greater in 2005 than in A comparison of 2005 and 2013 basin precipitation may help provide a better understanding of these differences; and investigate further the chronology of flood events at Black Diamond. In particular the breach of the Highway 22 Bridge and the role this may have played in the water levels recorded at the Black Diamond gauge. R:\Water Resources\General\PROJECT\Cw\2167 Foothills 2013 Flood Work\Design and Tender\128 Street\Morphology Writeup\fnl rpt-cw Street- 10May16_EDITED.docx Page 8
14 5.0 TYPES OF FLOOD RISKS The various types of flood risks to residential property and infrastructure at 128 th Street and 112 Street areas include: (1) proximity to eroding channel banks; (2) flooding due to the main channel overtopping its banks and inundating the floodplain; and (3) overland flooding. These flood risks are described below. (1) Properties near actively eroding channel banks are at risk of substantial property damage or loss of residences during future flood events. As discussed in Section 3.0, historically the channel has been very mobile, indicating that future changes of similar magnitude may occur, including areas of existing infrastructure. Confining the channel using erosion protection strategies is not economically or environmentally feasible given the large area and due to the low lying characteristics of the surrounding land and many secondary channels that can easily outflank structures. (2) Main channel flooding at low recurrence intervals occurs in the lower floodplain and is a result of flood levels that spill over the main channel banks into the surrounding land and secondary channels. Flood inundation may result in considerable damage to infrastructure. (3) Overland flooding occurs in the upper floodplain and is a result of secondary channels spilling over into the larger more unconfined areas. This area attenuates flows considerably, causing velocities to slow down. Overland flooding can cause loss of access to properties as well as flood damage to residential and other buildings and property due to inundation. R:\Water Resources\General\PROJECT\Cw\2167 Foothills 2013 Flood Work\Design and Tender\128 Street\Morphology Writeup\fnl rpt-cw Street- 10May16_EDITED.docx Page 9
15 6.0 MITIGATION OPTION 1 OVERLAND FLOW MITIGATION MEASURES The following components of the overland flow mitigation measures are discussed below: (1) inlet spillway; (2) drainage channel; (3) 128 th Street Crossing; and (4) outlet structure. 6.1 Inlet Structures The following two inlet structures are proposed: 1. An in-channel structure that modifies the existing interim channel breach structure (M.D. of Foothills No. 31 Flood Recovery Erosion Control Program Water Act Approval Application Sheep River Street, AMEC, 2014). The existing interim structure will be lowered to allow overtopping for discharges greater than the 2-year return period flood. The overflow at the in-channel structure will be directed towards: (1) the east subchannel that drains back into the main channel 500 m downstream; and (2) the overland flow structure described below. 2. An overland flow control structure (located 300 m northeast of the in-channel structure) that controls the flow draining through the gravel pit and across 128 th Street. During flood events greater than a 1:10 to 1:20 year return period, the spillway acts as a pressure release, allowing overbank/floodplain flow to safely overtop the structure. This allows the river to maintain a functional floodplain in the area, reducing the impact of flood events. In larger flood events similar to 2013, the overland flow structure will allow approximately an 80%/20% split between main channel/overland flow as opposed to the approximately 20%/80% split that occurred in Only during these moderate to large events will substantial flows overtop the overland flow structure and be conveyed through the drainage swale described below. 6.2 Drainage Swale A drainage swale is proposed east of the overland control structure to safely convey flood waters through the upper floodplain area, crossing 128 th street and re-entering the main channel via the outlet structure 2,200 m northeast of the overland flow control structure. This drainage swale would confine all flows up to a 100 year return period that pass over the overland flow control structure and prevent unconfined flows from spreading over a large area, which flooded several residences during the 2013 flood event th Street Crossing The proposed drainage swale crosses under 128 th Street. There is an existing culvert at the crossing intended for general drainage purposes, however it does not satisfy the conveyance requirements for passing substantial flow present during large flood events. Appendix F contains a preliminary engineering report that evaluates crossing options at 128 th Street. 6.4 Outlet Structure Flows conveyed through the drainage swale must safely re-enter the main channel in a manner that does not adversely impact the surrounding area. Additionally, due to the active channel characteristics, this structure must function even in circumstances where a substantial change in alignment has occurred in the main channel. This structure will satisfy these concerns with an armoured outlet that is set-back from the channel and which will allow natural channel movement while maintaining a safe conveyance of water back into the main channel. R:\Water Resources\General\PROJECT\Cw\2167 Foothills 2013 Flood Work\Design and Tender\128 Street\Morphology Writeup\fnl rpt-cw Street- 10May16_EDITED.docx Page 10
16 6.5 Costs Associated with Mitigation Option 1 Table 6.1 contains the preliminary cost estimates for the overland flow mitigation measures. Table 6.1 Overland Flow Mitigation Measures Preliminary Cost Estimate Item Description Estimated Cost Item 1 Inlet Structures 1.1 In-channel Structure (modification to existing structure) $100, Overland Flow Control Structure (at inlet to South Rock Pit) $600,000 Sub-total $700,000 Item th Street Crossing th Street Crossing 1,013,060 Item 3 Outlet Structure 3 Outlet Structure (at property) $600,000 Item 4 Overland Drainage Channels and Drainage Control Structures 4.1 Drainage Channel and Control Structures west of 128 th Street (at South Rock Pit) $125, Drainage Channel and Control Structures east of 128 th Street $125,000 Sub-total $250,000 Total Construction Cost for Items 1, 2, 3 and 4 $2,563,060 Engineering & Environmental Services (detail design, environmental, permitting and construction monitoring (10%) $251,268 GRAND TOTAL $2,940,000 R:\Water Resources\General\PROJECT\Cw\2167 Foothills 2013 Flood Work\Design and Tender\128 Street\Morphology Writeup\fnl rpt-cw Street- 10May16_EDITED.docx Page 11
17 7.0 MITIGATION OPTION 2 BUY OUT RESIDENCES IN HIGH FLOOD RISK AREAS Residences in the 128 th Street area are affected by flood events to different levels of severity which need to be carefully considered in the context of their respective risk threshold. Mitigating the impact of flooding through residential buyouts must consider these factors before making an informed decision. These risks are discussed in the next section. Table 7.1 lists the affected properties and their buyout costs and their locations are shown on Figure 2.2. Table 7.1 Roll Number Option 2 Buyout Preliminary Cost Estimate Estimated Market Value Reclamation Risk Rank Comments $1,067,266 $200,000 High $723,710 $200,000 High 2 Pending approval of FREC funds for buyout $954,090 $300,000 Medium 3 Extra reclamation required $1,051,494 $200,000 Medium 4 Secondary $1,310,203 $200,000 Medium 5 Secondary $631,760 $300,000 Loss of Access 6 Extra reclamation required $976,540 $200,000 Loss of Access $793,150 $200,000 Loss of Access $1,792,000 $200,000 Loss of Access $616,550 $200,000 Loss of Access $573,220 $200,000 Loss of Access $445,280 $200,000 Loss of Access 12 Secondary $662,630 $200,000 Loss of Access Gravel pit exists; unknown how much value is associated with the gravel Secondary; property has 3 structures being used collectively as a cottage $1,031,085 $200,000 Loss of Access 14 Secondary; gravel pit permit due to expire Jan 7, $498,550 N/A Low 15 Currently no infrastructure on property, however future development is possible. $200,000 N/A Low 16 Totals $13,327,528 $3,000,000 Grand Total $16,327, Flood damage Risk levels and Associated mitigation Costs Properties were categorized according to their flood damage risk levels with respect to the three types of flooding discussed above. Risk levels are discussed below and defined as: (1) high risk; (2) medium risk; and (3) loss of access. (1) High risk is associated with properties/infrastructure that have a high probability of sustaining critical damage during a large flood event due to channel activity and main R:\Water Resources\General\PROJECT\Cw\2167 Foothills 2013 Flood Work\Design and Tender\128 Street\Morphology Writeup\fnl rpt-cw Street- 10May16_EDITED.docx Page 12
18 channel flooding (e.g. residence falling into the river or being irreparably damaged in a large high water event) and also has a high probability of sustaining moderate level of flood damage at more frequent high water events due to main channel and overland flooding (e.g. losing access or home flooding in a moderate high water event). (2) Medium risk is associated with properties/infrastructure that have a moderate to high probability of sustaining a moderate level of flood impacts at more frequent high water events due to main channel flooding (e.g. losing access or residential flooding in a moderate high water event) and may become a significant risk in the future due to channel activity. (3) Loss of access risk is associated with properties that have a high probability of losing access due to roads washing out during flood events, however these properties do not have infrastructure at the high or medium risk threshold as defined above. The properties are categorized in Table 7.1 according to their risk levels. R:\Water Resources\General\PROJECT\Cw\2167 Foothills 2013 Flood Work\Design and Tender\128 Street\Morphology Writeup\fnl rpt-cw Street- 10May16_EDITED.docx Page 13
19 8.0 HYDRAULIC MODELLING The hydraulic analysis for the detailed design of overland flow measures was based on the digital terrain model (DTM) described in Section 1.1. Using the DTM, a one-dimensional model was constructed using the U.S. Army Corps of Engineers HEC-RAS v computer program. This model was used to simulate water surface elevations, depths and velocities throughout the study reach for design flow conditions. The hydraulic analysis was based on the following information: twenty-seven cross sections and a thalweg profile extending for a total distance of 7,700 m; overall river gradient of m/m which is consistent with the AMEC survey; flood frequency estimates as presented in Section 4.0; Manning s n of 0.04 for the channel, assuming gravel cobbles as the bed material and relatively uniform channel alignment; and Manning s n = 0.12 for the floodplain, based on the values contained in the above flood hazard studies. 8.1 Calibration of model It was not possible to calibrate to High Water Marks (HWM) obtained during the 2013 flood due to the channel breach and the ensuing complex flow patterns that occurred. Some limited HWM information was obtained from photo-documentation of the 2014 flood, in the vicinity of the repair at the channel breach (see Photo 8 in Appendix A). The model was calibrated using this 2014 high water mark information and preliminary estimate of peak 2014 annual peak instantaneous discharge contained in Table 4.2. The computed high water elevations for this event were calibrated to within 0.28 m of the corresponding recorded high water marks. The 2014 peak flood discharge was 150 m 3 /s and 250 m 3 /s upstream and downstream of the Threepoint Creek confluence, respectively, which corresponds to approximately a 5-year return period flood event. Hence, the calibration run represents a 5-year flood event for current conditions with the interim repair works constructed in 2013 blocking overland flow from entering the gravel pit. 8.2 Scenarios Modelled The modelling was used as a tool to develop flood inundation mapping to evaluate flood risks to properties and infrastructure. Additionally, the modelling was used as a tool to optimize the design of the mitigation measures. The following assumptions were made for the hydraulic analysis: 1) maintain the majority of the floodwaters in the main channel; and 2) during large magnitude floods, convey a portion of the floodwaters in an overland flow channel through the gravel pit area, across 128 th Street and back into the Sheep River. R:\Water Resources\General\PROJECT\Cw\2167 Foothills 2013 Flood Work\Design and Tender\128 Street\Morphology Writeup\fnl rpt-cw Street- 10May16_EDITED.docx Page 14
20 The following scenarios were modelled: Scenario 1 2-year return period discharge Scenario 2 5-year return period discharge Scenario 3 10-year return period discharge Scenario 4 20-year return period discharge Scenario 5 50-year return period discharge Scenario year return period discharge For these scenarios, the modelling determined the various hydraulic parameters, including water surface elevations, depths and velocities, which formed the basis of the design of overland flow mitigation measures. This information is summarized in Table 8.1 for the above noted scenarios for: (1) existing conditions; and (2) improved conditions (Option 1 discussed in Section 6). The results of the HEC-RAS modeling for the various scenarios are presented in Appendix D. Select modelling results are noted below: Scenario 1 2-year return period discharge. The flow remains within the main channel for both existing and improved conditions. Scenario 3 10-year return period discharge. For existing and improved conditions respectively, an overland flow of 56.6 m 3 /s and 13.3 m 3 /s drains through the gravel pit area, across 128 th Street and back into the Sheep River at the outfall in the vicinity of the property. Scenario 5 50-year return period discharge. For existing and improved conditions respectively, an overland flow of 129 m 3 /s and 65.6 m 3 /s drains through the gravel pit area, across 128 th Street and back into the Sheep River at the outfall in the vicinity of the property. Scenario year return period discharge. For existing and improved conditions respectively, an overland flow of 160 m 3 /s and 90.5 m 3 /s drains through the gravel pit area. The overland flow splits downstream of 128 th Street as follows: (1) approximately 60 m 3 /s of the overland flow drains east across 112 th Street towards the Sheep River; and (2) approximately 100 m 3 /s of the overland flow drains north back into the Sheep River at the outfall in the vicinity of the property. 8.3 Existing Conditions Flood Inundation Mapping Modeling data were used to delineate flood inundation of the 128 th Street study area, for existing conditions, to determine properties at risk in future flood events of varying magnitudes. Mapping for the 2-year, 10-year, and 100-year return periods is presented in Figures 8.1, 8.2, and 8.3, respectively. Flood delineation does not distinguish floodway, flood fringe, or flooding due to localized surface runoff. R:\Water Resources\General\PROJECT\Cw\2167 Foothills 2013 Flood Work\Design and Tender\128 Street\Morphology Writeup\fnl rpt-cw Street- 10May16_EDITED.docx Page 15
21 The split-flow analysis option was used in HEC-RAS to model the overland flow. Split flow occurs when a portion of the flow leaves the main stream and follows a separate path and eventually returns downstream. R:\Water Resources\General\PROJECT\Cw\2167 Foothills 2013 Flood Work\Design and Tender\128 Street\Morphology Writeup\fnl rpt-cw Street- 10May16_EDITED.docx Page 16
22 Table 8.1 HEC-RAS Model Summary Table Scenario Scenario Scenario Return Period (years) Upstream, Existing Maximum Instantaneous Discharges (m 3 /s) Main Channel Main Channel: Below Threepoint Creek Overland Flow: At 128 Street Upstream, Improved (Mitigation Option 1) Existing Improved (Mitigation Option 1) Existing Condition Improved (Mitigation Option 1) Return Period (years) Existing Main Channel Water Level Elevation (m above sea level) Location of Channel Breach Near Near / Improved (Mitigation Option 1) Existing Improved (Mitigation Option 1) Existing Improved (Mitigation Option 1) Return Period (years) Existing Overland Flow Water Level Elevation (m above sea level) Inlet 128 St Crossing, Outlet, Improved (Mitigation Option 1) Existing Improved (Mitigation Option 1) Existing Improved (Mitigation Option 1) 1 2 N/A N/A N/A N/A N/A N/A N/A N/A R:\Water Resources\General\PROJECT\Cw\2167 Foothills 2013 Flood Work\Design and Tender\128 Street\Morphology Writeup\fnl rpt-cw Street-10May16_EDITED.docx Page 17
23 9.0 DISCUSSION OF MITIGATION OPTIONS AND RECOMMENDATIONS The site characteristics in the 128 th Street and 112 th Street area results in complex flooding issues that result in some level of flood risk for properties in the area. The following two options were evaluated in this report: (1) Option 1 structural overland flow mitigation measures; and (2) Option 2 buy out residences. These options are detailed below and as discussed there are no cost effective structural measures (Option 1) that minimize all flood risks while maintaining the existing residences and infrastructure. Option 1 structural overland flow mitigation measures will address most concerns for the properties directly adjacent to 128 Street ( , , , , , and ) while having minimal benefit for the properties directly adjacent to 112 th Street ( , , , and ). This mitigation option will solve the overland flooding risks; however, it does not solve the active channel and main channel flooding risks. These risks are associated with high and medium risk levels which need to be addressed at a higher priority than the loss of access risk. All properties that have been listed under the high and medium risk levels ( , , , , and ) receive minimal benefits from the overland flow mitigation measures. Additionally, as shown in Appendix G, future gravel mining is proposed in this area. This future gravel mining will add a further level of complexity to the ongoing issues of overland flow, dynamic river channel location and groundwater/surface water interactions. A significant investment in Option 1 overland flow mitigation measures is questionable not only because it does not mitigate flood risks for the 112 th Street properties, but also because future gravel mining will further complicate the issues and potentially increase flood risk. The structural overland flow mitigation measures option is not recommended as it does not mitigate risks for the 112 th Street properties. The properties identified at the loss of access risk level can be addressed with construction of an appropriate 128 Street crossing at the overland flood drainage path. Option 2 is to buyout residents that are at risk from floods and let the river flood in a similar manner as occurred during the 2013 flood. This residential buyout option is recommended as it removes risk of future flood damages to the residents and associated infrastructure and allows the MD of Foothills to follow a flexible, risk management approach that can be applied based on municipal priorities. Therefore, it is recommended that the M.D. of Foothills pursue residential buyouts to resolve outstanding infrastructure threats which cannot be addressed through structural measures. Future zoning for this area should recognize the severe flood risk in this area and restrict residential development and infrastructure in flood prone areas. Flood hazard maps should be prepared as part of the Alberta Flood Hazard Identification program. One long-range use for this area may be as a flood attenuation zone. This land use would provide a flood attenuation effect similar to that which transpired during the 2013 flood. A review of preliminary 2013 flood hydrometric data suggests that the routing of floodwaters into the 128 R:\Water Resources\General\PROJECT\Cw\2167 Foothills 2013 Flood Work\Design and Tender\128 Street\Morphology Writeup\fnl rpt-cw Street- 10May16_EDITED.docx Page 18
24 Street and 112 Street areas significantly reduced 2013 flood peaks in Okotoks and downstream. The buyout option offers the opportunity to allow similar future flood mitigation benefits to downstream areas in the MD of Foothills and the Town of Okotoks as well as continued use of this area for gravel mining. R:\Water Resources\General\PROJECT\Cw\2167 Foothills 2013 Flood Work\Design and Tender\128 Street\Morphology Writeup\fnl rpt-cw Street- 10May16_EDITED.docx Page 19
25 10.0 CLOSURE This report has been prepared for the exclusive use of the and Alberta Environment and Sustainable Resource Development. This report is based on, and limited by, the interpretation of data, circumstances, and conditions available at the time of completion of the work as referenced throughout the report. It has been prepared in accordance with generally accepted engineering practices. No other warranty, express or implied, is made. Yours truly, A Division of Americas Limited Reviewed by: L.S. Hundal, M.Eng., P.Eng. Senior Associate Water Resources Engineer Direct Tel.: (403) Direct Fax: (403) liv.hundal@amecfw.com Gary R.E. Beckstead, M.Sc., P.Eng. Principal Water Resources Engineer Greg Courtice, M.Sc., E.I.T Water Resources Engineer cf LSH/GC/GRB/cf Permit to Practice No. P-4546 R:\Water Resources\General\PROJECT\Cw\2167 Foothills 2013 Flood Work\Design and Tender\128 Street\Morphology Writeup\fnl rpt-cw Street-27jul15.docx Page 20

26 Figures
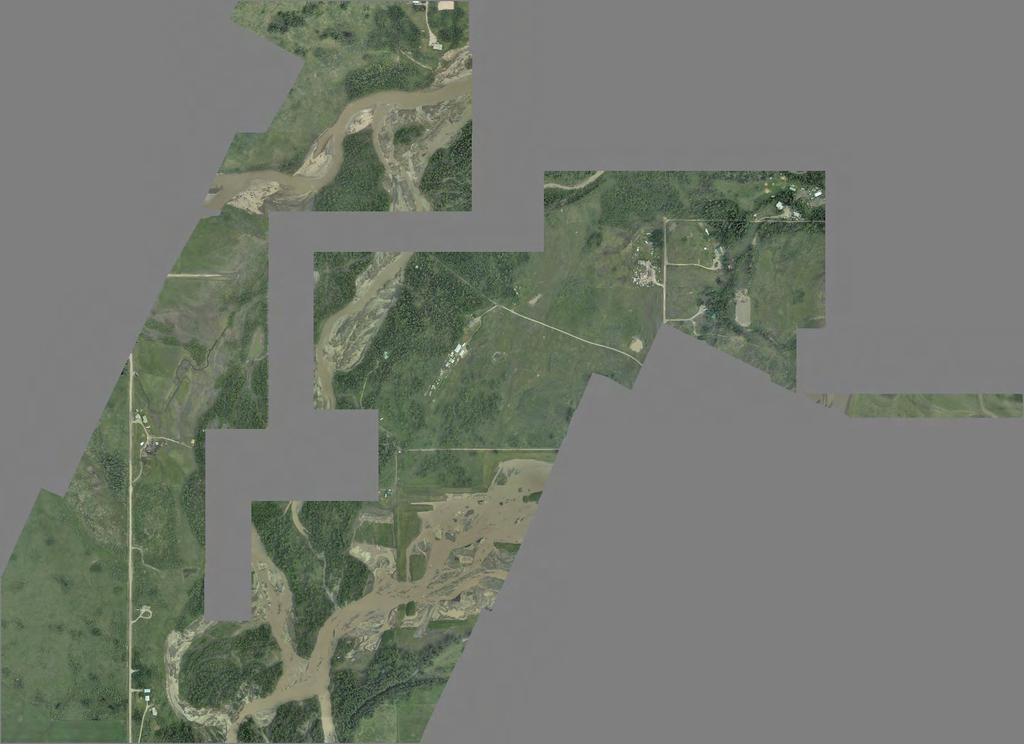
27 SHEEP RIVER AT 128TH STREET FLOOD HAZARD RISKS AND REVIEW OF MITIGATION OPTIONS LOCATION PLAN M.D. OF FOOTHILLS NO. 31
28


29 27 26 SHEEP RIVER AT 128TH STREET FLOOD HAZARD RISKS AND REVIEW OF MITIGATION OPTIONS 2013 FLOOD FLOW PATH M.D. OF FOOTHILLS NO. 31
30 DESIGN OF SHEEP RIVER OVERLAND FLOW MEASURES AT 128TH STREET M.D. OF FOOTHILLS NO. 31 PLAN VIEW SHEEP RIVER BASIN
31 DESIGN OF SHEEP RIVER OVERLAND FLOW MEASURES AT 128TH STREET M.D. OF FOOTHILLS NO. 31 SHEEP RIVER PROFILE BASIN SCALE
32 SHEEP RIVER AT 128TH STREET FLOOD HAZARD RISKS AND REVIEW OF MITIGATION OPTIONS M.D. OF FOOTHILLS NO. 31 SHEEP RIVER PROFILE STUDY AREA


33 AIR PHOTO REFERENCE: AMEC DATE: SHEEP RIVER AT 128TH STREET FLOOD HAZARD RISKS AND REVIEW OF MITIGATION OPTIONS CHANNEL AND VALLEY CROSS-SECTION AT 128TH STREET M.D. OF FOOTHILLS NO. 31


34 AIR PHOTO REFERENCE: CA033, #68, 70, 71, 72, 73 DATE: AIR PHOTO REFERENCE: AS0171, #39 DATE: AIR PHOTO REFERENCE: AS2191, #59 DATE: AIR PHOTO REFERENCE: ESRD DATE: 2012 SHEEP RIVER AT 128TH STREET FLOOD HAZARD RISKS AND REVIEW OF MITIGATION OPTIONS COMPARATIVE AIRPHOTOS 1923, 1949, 1980 & 2012 M.D. OF FOOTHILLS NO. 31


35 AIR PHOTO REFERENCE: ESRD DATE: 2013 AIR PHOTO REFERENCE: ESRD DATE: 2012 AIR PHOTO REFERENCE: AMEC E & I DATE: SHEEP RIVER AT 128TH STREET FLOOD HAZARD RISKS AND REVIEW OF MITIGATION OPTIONS COMPARATIVE AIRPHOTOS 2012, 2013 POST FLOOD, 2014 M.D. OF FOOTHILLS NO. 31
36 Figure 4.1: Preliminary Estimated 2013 Flood Hydrographs 1200 Threepoint Millarville (Published WSC Streamflow) Sheep Black Diamond (Based on real time water levels preliminary data) 1000 Sheep Black Diamond Estimated (Trend based on discharge decrease of Threepoint Millarville) Sheep Okotoks (Based on real time water levels preliminary data) 800 Approximate point at which the Sheep Diamond Gauge is damaged. Discharge (m³/s) :00 2:00 4:00 6:00 8:00 10:00 12:00 14:00 16:00 18:00 20:00 22:00 0:00 2:00 4:00 6:00 8:00 10:00 12:00 June 20, 2013 June 21, 2013 Time SHEEP RIVER AT 128TH STREET FLOOD HAZARD RISKS AND REVIEW OF MITIGATION OPTIONS M.D. OF FOOTHILLS NO FLOOD PEAK REDUCTION AND DELAY
37
38
39

40 Appendix A Study Area Photos

, photo taken approximately 200 m downstream of the channel breach site on top of the west bank.")
41 CW2167.SHEEP 128 Street Review of Mitigation Options January 2015 Photo 1 Looking downstream at channel breach site. Emergency gravel berm is visible on right side of photo. A permanent structure was constructed subsequently in order to maintain the pre-flood channel alignment. Photo taken 17 October Photo 2 View northeast (downstream), photo taken approximately 200 m downstream of the channel breach site on top of the west bank. The lower floodplain is apparent along the east (right) side of the river. Photo taken 27 November 2013.


42 CW2167.SHEEP 128 Street Review of Mitigation Options January 2015 Photo 3 Looking upstream approximately 800 m downstream of the Threepoint Creek confluence. The river is confined to the north due to the high bank shown on the right side of the photo. The lower floodplain is apparent along the south bank shown on the left side of the photo. Photo taken 17 October Photo 4 Looking downstream near the property. The home and barn can be seen in the background on the right side of the photo. This property is located within the lower floodplain and was bought out subsequent to the 2013 flood. Photo taken 17 October 2013.


43 CW2167.SHEEP 128 Street Review of Mitigation Options January 2015 Photo 5 Looking west at the 128 Street washout location. Majority of the 2013 flood waters were conveyed overland through this area causing substantial flooding and erosion, washing out 128 Street and losing access for several residences. Photo taken 25 September Photo 6 Looking downstream at one of many secondary channels located within the lower floodplain. This channel is located approximately 600 m upstream of the channel breach site. During flood events, these secondary channels convey water around the existing in-channel structure and flows into the South Rock gravel pit. Photo taken 17 October 2013.


44 CW2167.SHEEP 128 Street Review of Mitigation Options January 2015 Photo 7 Looking upstream at the property, the home is shown quite near the existing channel bank. Protecting the home with erosion protection techniques is not economically feasible due to the low lying characteristics of the land and many secondary channels that can easily out-flank structures. This residence and the nearby residence are both susceptible to future channel activity which may compromise the integrity and safety of these properties. Photo taken 24 October Photo 8 Photo taken on in-channel structure looking upstream during the 2014 high water event on 18 June This photo was used for hydraulic modeling calibration purposes.