CITY OF MANDAUE CLEAN AIR MANAGEMENT PROGRAM
|
|
|
- Charlene McKinney
- 5 years ago
- Views:
Transcription
1 CITY OF MANDAUE CLEAN AIR MANAGEMENT PROGRAM
2 CITY PROFILE. CLASSIFICATION : HIGHLY URBANIZED CITY LAND AREA : 3,487 HECTARES POPULATION (PROJECTED 2005): 300,000


3 MAJOR INDUSTRIES. LARGE & MEDIUM : FURNITURE


4 FASHION ACCESSORIES


5 FOOD PROCESSING


6 BEVERAGE CARAGEENAN

7 PACKAGING GENERAL MERCHANDISE

8 MAJOR INDUSTRIES. SMALL & MICRO : ENTERPRISES SUB-CONTRACTING WOOD-BASED FURNITURE WROUGHT-IRON-BASED FURNITURE FIBER GLASS-BASED FURNITURE


9 MAJOR INDUSTRIES. SMALL & MICRO ENTERPRISES : DELICACIES BIBINGKA MASAREAL BUDBUD MASI DRIED MANGO

10 THE ECONOMY. NUMBER OF BUSINESS LINES 2003: 9, : 9, : 10,240
11 ENVIRONMENTAL MANAGEMENT We want to continue present initiatives in complying the provisions of the Clean Air Management, Solid Waste Management and Waste Water Management.
12 CLEAN AIR MANAGEMENT PROGRAM ) Continuing tricycle preventive maintenance program 2.) Anti-Smoke Belching Campaign Acquisition of anti-smoke belching machine Drafting of city anti-smoke belching ordinance Road apprehension 3.) NOXS and SOXS Monitoring on City Airspace Partnership with NGO/ACADEME to conduct NOXS and SOXS Monitoring 4.) Industrial Monitoring on Air Ambient Compliance of all industries on DENR requirements/permit Acquisition of air ambient monitoring equipment 5.) Information and Education Campaign on Clean Air Act Partnership with DENR/NGO/ACADEME 6.) Urban greening
13 On-going Initiatives: 1.) Clean Air Management Creation of Clean Air Management Board through Executive Order No. 11, Series of 2005 Launching of the Clean Air Management Program Formulation of CAMP Mobile Sources Terms of Reference Stakeholders Orientation & Consultative Forum Institutionalization of CAMP Mobile Source through an Executive Order SP adoption of Executive Order and Resolution of Support Inventory of tricycles, PUJ s, cars, PUV s that are either passes through the city or are operating in the city


14
15 Preparation of Profiles: * Tricycle Owners * Tricycle Drivers * PUJ Owners * PUJ Drivers * Car Owners Traffic Count/Survey Daily passenger volume survey Strategy formulation * scheme for tricycles * Smoke-Belching monitoring * Vehicle maintenance training * Livelihood options * Common facility * Vehicle maintenance * Spare parts procurement


16
17 10. Cooperative Formation/Strengthening 11. Legislation 12. Enforcement and Implementation 13. Gradual Phase-Out of old units and formulate new units procurement program 14. Monitoring and Evaluation Conduct seminar/workshop on motorcycle and tricycle preventive maintenance last September 1-2, 2005 and September 15 16, 2005 Conduct seminar/workshop on industries on cleaner production program Monitoring of all PETC within the city Monitoring of industries on ambient air Urban greening


18


19
20 2.) Solid Waste Management Procurement of 5 brand new compactors Posting of Segregation Bins in strategic areas Establishment of a Materials Recovery Facility Construction of a Sanitary Landfill Maintenance of a Waste Containment Area Establishment of a Medical Waste Facility 3.) Waste Water Management Establishment of a Common Wastewater Treatment Facility along Butuanon River Rehabilitation of Butuanon River
21 Metro Cebu Air Quality Monitoring Major component of the Metro Cebu Environmental Improvement Project Launched on August 9, 2002 Joint effort of : PCAPI-7 EMB-7 TESDA-7 USC Don Bosco Technological Center LGU - Cebu City LGU - Mandaue City LGU - Lapu-lapu City Supported by Kitakyushu International Techno-cooperative Association (KITA) and the City Government Of Kitakyushu City, Japan
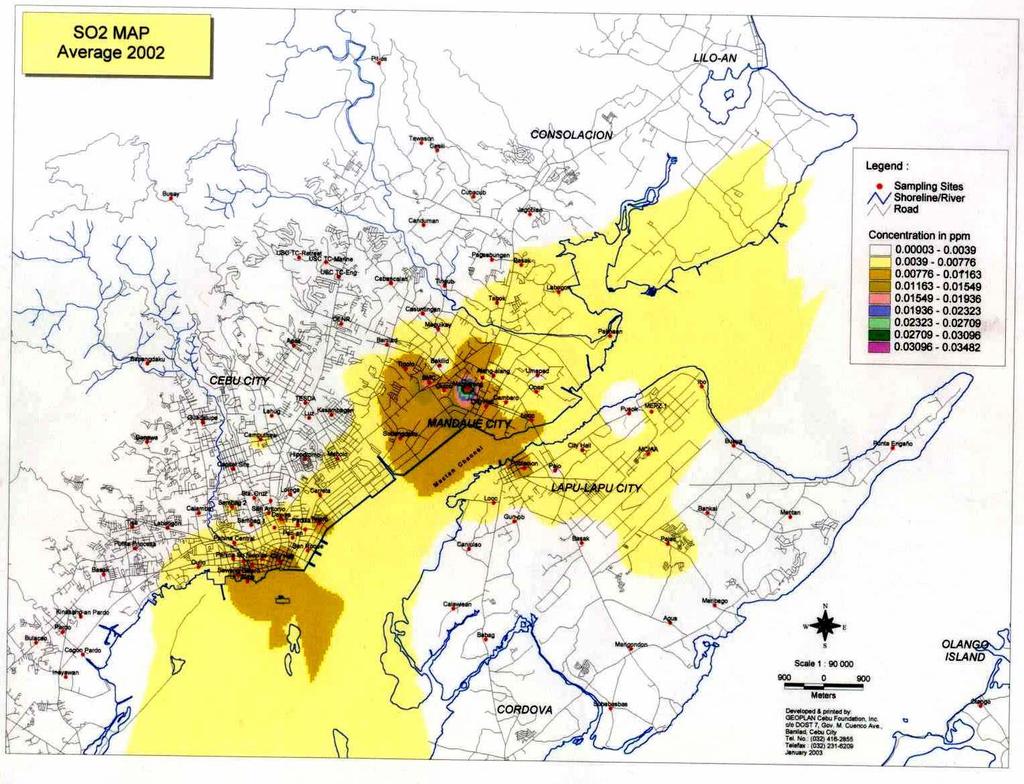
22 Objectives: To know the concentration & trend of NO2 & SO2 in the ambient air. To use the data to determine the attainment & non-attainment areas for SO2 & NO2. To develop a map of SO2 & NO2 level in the Cities of Cebu, Mandaue & Lapu-lapu
23 Scope of Monitoring : Focus on Sulfur Dioxide (SO2) & Nitrogen Dioxide (NO2) Conducted from Aug.-Dec., monitoring stations covering Cities of Mandaue, Cebu and Lapulapu
24 Site Selection Criteria : Instrument safety Accessibility Populated area Geographic distribution of samplers proximity to pollution sources Topography
25 Sampling and Analysis : SO2 - Lead Dioxide Candle (cylinder) Method - Passive sampler NO2 - Triethanolamine Method - Passive sampler Samplers installed/ samples collected by student - volunteers of Don Bosco Technological Center Samples analyzed by USC
26 Presentation of monitoring result : Monthly average SO2 levels ranges from ppm to ppm METRO CEBU AIR QUALITY MONITORING NO2-SO2 Monthly Average Monthly average NO2 levels ranges from ppm to ppm SO2, ppm NO2, ppm AUG SEPT OCT NOV DEC Both SO2 & NO2 conform DENR standards. SO2 STD ppm NO2 STD ppm SO2 NO2
27 Monitoring result 5-month average showed Cebu City highest for NO2, followed by Mandaue City For SO2, Mandaue City is highest, then Cebu City Lapu-lapu lowest for both Can be explained thru vehicle traffic profile, industry profile, topography & meteorology ppm METRO CEBU AIR QUALITY MONITORING NO2-SO2 5-Month Average CEBU CITY MANDAUE CITY LAPU-LAPU CITY NO2 STD ppm SO2 STD ppm NO2 SO2

28 Monitoring result METRO CEBU VEHICLE TRAFFIC PROFILE NO. OF SAMPLING SITES CEBU CITY MANDAUE CITY LAPU-LAPU CITY L M H
29 Monitoring result
30 Monitoring result Areas with higher traffic densities have higher SO 2 levels 2002 METRO CEBU AIR QUALITY MONITORING SO2 - Traffic Density Relationship Mandaue City recorded highest SO 2 possibly due to more manufacturin g industries in the city. SO2, ppm CEBU CITY MANDAUE CITY LAPU-LAPU CITY H M L
31 Monitoring result Areas with higher traffic densities have higher NO 2 levels NO2, ppm METRO CEBU AIR QUALITY MONITORING NO2 - Traffic Density Relationship H M L 0 CEBU CITY MANDAUE CITY LAPU-LAPU CITY

32

33

34

35

36

37

38

39

40

41

42

43
44
45
46 Acceptability of Result & Monitoring Technology Monitoring technology comes from Kitakyushu City, Japan. extensively used there for about 30 years before Kitakyushu City Government established its Telemetric Air Quality Monitoring System. Also extensively used in Britain, where Kitakyushu learned the technology. Direct unit of result is µg/100 cm2 /day for both SO3 & NO2, as adopted by Kitakyushu. Kitakyushu established correlation curve converting unit to ppm SO2. Cebu Project established correlation curve for NO2, converting unit to ppm. To ascertain acceptability to local situation, monitoring results shall be validated using the Telemetric Air Quality Monitoring System established by EMB- 7 just the last week of December, 2002.
47 Recommendations : Cebu, Mandaue & Lapu-lapu Cities be declared ATTAINMENT AREAS for SO2 and NO2 in line with Clean Air Act. Collectively recommend to higher authorities adoption of the low-cost but equally reliable Kitakyushu air quality monitoring technology. Continue this monitoring activity to establish trends & as benchmark for success or failure of efforts to control air pollution.
48