Toshiba Group s Environmental Vision 2050
|
|
|
- Brett Byrd
- 5 years ago
- Views:
Transcription

1 Toshiba Group s Environmental Vision 2050

2 Meeting Environmental challenges The first stage Environmental Vision 2010 Toshiba Group Slogan Committed to People, Committed to the Future. TOSHIBA Contribute to sustainable development of the Earth throughout our business processes and products Double overall eco-efficiency FY2000 FY2010 Product eco-efficiency Business process eco-efficiency Factor T - Products 2.2 Value of a product/ Environmental impact of a product throughout its lifecycle Factor T- Process 1.2 Sales/Environmental impact of the entire business process 2
3 Meeting environmental challenges The first stage FY2006 Result: 1.59 times 1.68 time (product) 1.22 times (business process) Compared with FY2000 Double Overall Eco-Efficiency FY2000 FY2010 Overall eco-efficiency Result Plan (FY) FY2010 Target: 2 times 2.2 times (product) 1.2 times (business process) Compared with FY2000 Product Eco-efficiency Value of products (performance improvement) Environmental impacts of products 2.2 times FY2006 result 1.68 times Result Plan FY2010 target 2.2 times (FY) Composition of environmental impacts during product life cycles (Average of all products of Toshiba Group) Environmental impacts of products (from procurement of raw materials to final disposal) Environmental impacts of business processes (manufacturing) 80% 20% Business Process Eco-efficiency Sales Environmental impacts throughout business processes times Result FY2006 result 1.22 times Plan FY2010 target 1.2 times (FY) 3
4 Moving towards The Second Stage Restrictive factors to solving environmental issues Increasing global population Economic disparities between countries, etc. Fulfilling twin challenges Enjoy rich lifestyles Reduce environmental impacts Toshiba Group s Environmental Vision Develop Toshiba Group s Environmental Vision of the ideal situation in

5 Toshiba Group s Environmental Vision The ideal situation in 2050 People lead rich lifestyles in harmony with the Earth Challenges to meet Reduce the environmental impacts of population growth Ease the environmental impacts of economic growth Create rich value Environmental Vision
6 Environmental Vision 2050 Towards People lead rich lifestyles in harmony with the Earth Factor ファクター = 環境効率の改善度 Factor = Improved eco efficiency 価値環境効率 = Eco efficiency= 環境影響 1 2 価値 Value 環境影響 Environmental impact 5 Create rich value Ease environmental impacts of economic growth Respond to population growth 10 Creation of new value Symbiosis with the Earth Environmental Vision 2050 Factor 10 6

7 Two Approaches Eco Products Approach The approach from Creation of new value Grow while offering new value Value Innovation Gain profit through radical change Process Innovation The approach from Symbiosis with the Earth Energy Approach 7

8 Trend in energy consumption World Primary Energy Demand Projections 1.6 times in 30 years 2 times in 30 years 8


9 The Best Energy Mix World Primary Energy Demand for Power Generation by fuel CO 2 Emissions by Type of Plant Two goals to meet Reliable energy supply Mitigation of climate change The best energy mix High efficiency thermal plants Renewable energy Advanced nuclear plants 9
10 Energy Approach Two areas that must be addressed Reliable energy supply - achieve energy security - Mitigation of climate change - reduce CO 2 emissions - Energy mix solution Nuclear, thermal and hydro power generation New energy Contribute to better environment, reliable energy supplies as A Corporate Citizen of Planet Earth We aim to support safe, secure, richer lifestyles for people worldwide 10
11 CO 2 Reduction in Energy Production Toshiba will promote the following measures in energy production. Measures of Toshiba energy vision Promote nuclear power and establish FBR & the nuclear fuel cycle. Zero CO 2 emissions by performance improvements in thermal power systems, e.g. CCS* *Carbon Capture & Storage Zero power loss by superconductivity transmission & stable dispersed energy supply by microgrid Promote commercialization of dispersed power and renewable energy systems 11
12 Energy Innovation Nuclear power Process innovation Reduce CO2 emissions by promoting high reliability LWR Light Water Reactor (LWR) Volume of CO 2 reduction per unit: 6.7m tons/year Value innovation Converve uranium resources by reprocessing nuclear fuel FBR Thermal & hydro power Transmission & distribution New energy Reduce CO2 emissions by improving performance of thermal power plants Advanced Combined Cycle Volume of CO 2 reduction per unit: 0.13m tons/year Ultra Supercritical (USC) Volume of CO 2 reduction per unit: 0.32m tons/year Reduce CO2 emissions by reducing loss in electric transmission at ultra high voltage Ultra High Voltage (UHV) Reduce CO2 emissions with renewable geothermal and wind power generation Geothermal power Volume of CO 2 reduction per 50MW unit: 0.33m tons/year Volume of CO 2 reduction per unit: 7 tons/year Wind power Volume of CO 2 reduction per 2MW unit: 5k tons/year Achieve zero CO2 emissions by combining Carbon Capture & Storage and advanced ultra supercritical turbines Advanced Ultra Super Critical (A-USC) Volume of CO 2 reduction per unit: 5m tons/year Microgrid, new concept power supply; Reduce environmental loads by superconductive transmission Micro-grid Reduce CO2 emission by residential fuel cell co-generation Residential fuel cells Volume of CO 2 reduction per unit: 1.2 tons/year 12


13 Energy Process innovation 高信頼性軽水炉の建設 Construct highly reliable LWR Reduce CO2 emissions by constructing highly reliable LWR offering high-level cost performance ABWR AP1000 *LWR= light water reactor Improved efficiency, enhanced reliability and more cost-efficient operation Volume of CO 2 reduction per unit: 6.7m tons/year 13


14 Energy Process innovation Reduce CO2 exhaust emissions by improving performance of thermal power plants USC Improve performance of thermal power plant Medium pressure turbine Low pressure turbine High temperature gas turbine Gas turbine High pressure turbine Generator Steam turbine Raise efficiency with higher steam temperatures Volume of CO 2 reduction per unit: 0.32m tons/year Raise efficiency with higher working fluid temperatures Volume of CO 2 reduction per unit: 0.13m tons/year 14


15 Energy Value innovation Development of residential fuel cells CO 2 reduction by residential fuel cell co-generation A new concept power generation system that utilizes waste heat of power generator for residential hot water supply Volume of CO 2 reduction per one million units: 1.2m tons/year CCS system Boiler Combustion exhaust gas Heat CO 2 <2% exchanger CO 2 >99% Absorber Absorbent Regenerator (CO 2 lean) (CO 2 rich) Membrane module Re-boiler Residential fuel cell Commercialization of CCS Reduce CO 2 emissions to zero by combining CCS and A-USC CCS is an innovative concept to reduce CO 2 emissions from thermal power plant dramatically. CO2 is separated, captured, and stored under ground. Volume of CO 2 reduction per unit: 5m tons/year 15

16 Achievement by Energy Approach Reduction of CO 2 emissions in energy supply: target figures Thermal Power 22% Reduce CO 2 emissions through innovations in energy technologies Nuclear Power 78% 4.2 million tons CO 2 /year 14 million tons CO 2 /year 47 million tons CO 2 / year FY2006 FY2010 FY2025 *Figures based on average emissions from design to operations, by fiscal year, and on comparison with similar commissioned equipment in FY2000 benchmark, i.e. coal-fired thermal plant 16
17 Eco Products Approach Two areas that must be addressed Creation of new value (sustainable growth) Symbiosis with the Earth (Improving the global environment) Eco-efficiency solution More productive lives Safer and more comfortable life Mitigation of climate change Optimization of resources Management of chemicals Contribute to sustainable development in diverse ways as a Corporate Citizen of Planet Earth Eco-products create value that helps to overcome environmental problems. 17
18 Eco Products Approach Technologies that change lifestyles Products that pursue efficiency Technologies that support products Process Innovation Energy management (HEMS, BEMS, Environmental impact display system) Diagnosis of energy saving (Refrigerator stock control, Measuring CO 2 ) High efficiency lamp (LED, Organic EL) High efficiency air-conditioning (Heat pump) High-efficiency kitchen (Cooker) High-insulation, Highly airtight houses/buildings (Vacuum insulating, High endurance construction materials) High performance Devices (SiC, GaN, Diamond Semiconductor) Energy-saving model network Large capacity, optical communication Value Innovation Universal communication (Virtual display, Producing highly realistic visual space, Body sensor) Home guard system Active consumer control, Demand forecast New lamps (Use of naatural sunlight,light-storage Biochemical synthesis) Super high insulation, Highly airtight houses/buildings (Active adjustment construction materials) New kitchen (New processing technology, Long preservation, Normal temperature preserved food) Common power supply, Standby power control Energy-saving network communication Grid/Quantum computer Single electron transistor 18


19 EcoProducts Process Innovation Home Network High efficiency LED lamp SpursEngine Home laundry with air-conditioning PDA with DMFC Qosmio with SpursEngine 19


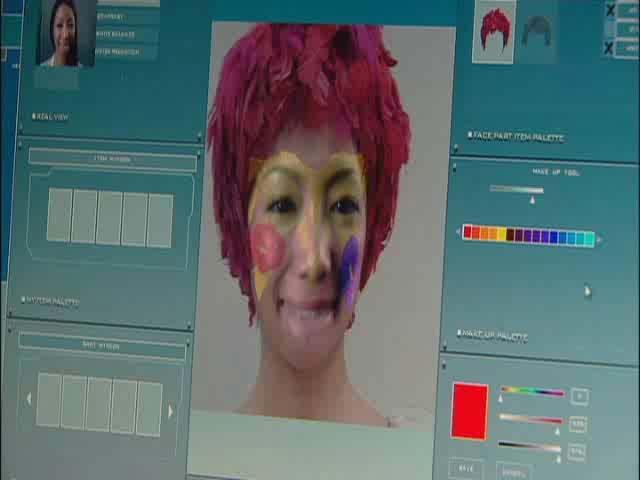
20 Eco Products Value Innovation New User Interface Media Streaming Processor Image Indexing High-quality Image Technology High-Speed Image Processing 20
 New")
 Chair with body sensor Energy saving")

21 Eco Products Value Innovation Creation of highly realistic visual space with virtual 3D display Universal Communication (Telecommuting, Home doctor) New Lamps (Use of natural daylight, Light-storage, Biochemical synthesis) Home guard system (Active consumer control) Chair with body sensor Energy saving network communication ApriAlpha Robot IT household appliances Highly efficient insulation, Highly airtight house (Active adjustment construction materials) 21

22 Achievements of EcoProducts Approach Reduction of CO2 emissions in products: target figures Home Appliances 41% Digital Products 14% 4.3 million t-co2/year Social Infrastructures 19% Electronic Devices 26% Reduce CO 2 emissions through innovations in eco friendly products 4.3 million t-co2/year 6.3 million t-co2/year 10.6million t-co2/ year FY2006 FY2010 FY2025 *Comparison based on product lifecycle of main products in each category against equivalent products in FY2000 benchmark. 22
23 Towards Environment Vision Contributions by Energy Approach 4.2 million tons CO 2 /year 14 million tons CO 2 /year 47 million tons CO 2 /year Environmental Vision 2050 Factor Factor 10 Creating Value 10 Harmony With the Earth Contribution by Products Approach 4.3 million tons CO 2 /year 6.3 million tons CO 2 /year 10.6 million tons CO 2 /year 23
24 24