Greater Utilization of Alternative Water Supplies (Irvine Ranch Avocados)
|
|
|
- Abigail Lang
- 5 years ago
- Views:
Transcription


1 2017 California Irrigation Institute Managing our Water Checkbook: Solutions for a balanced bottom line Greater Utilization of Alternative Water Supplies (Irvine Ranch Avocados) Mark Tettemer Irvine Ranch Water District Blake Sanden - Irrigation/Agronomy, Kern
2


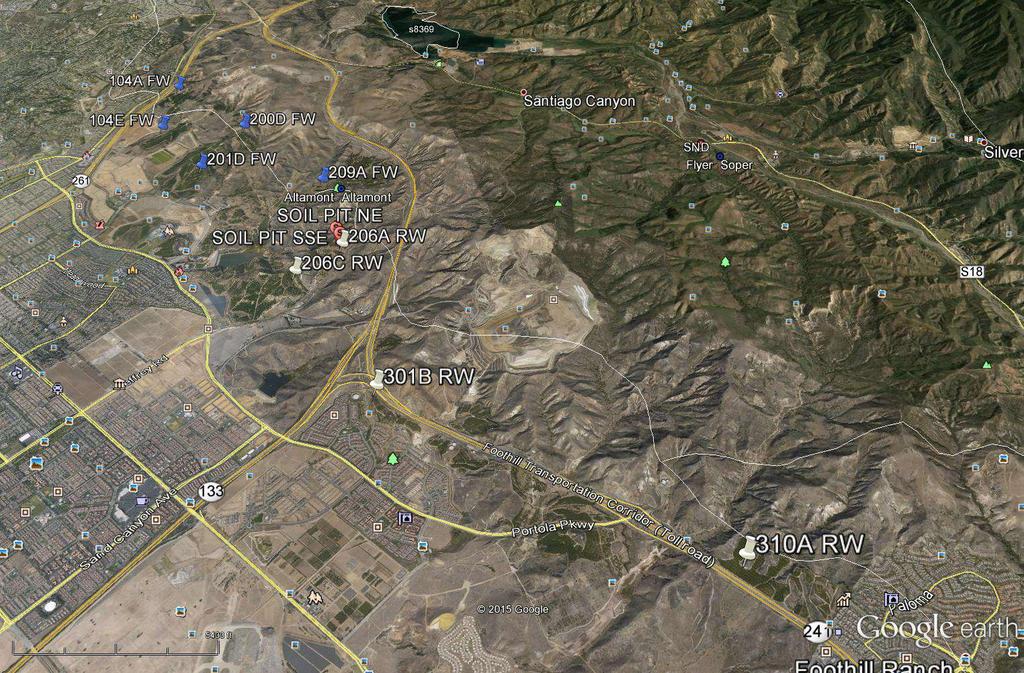
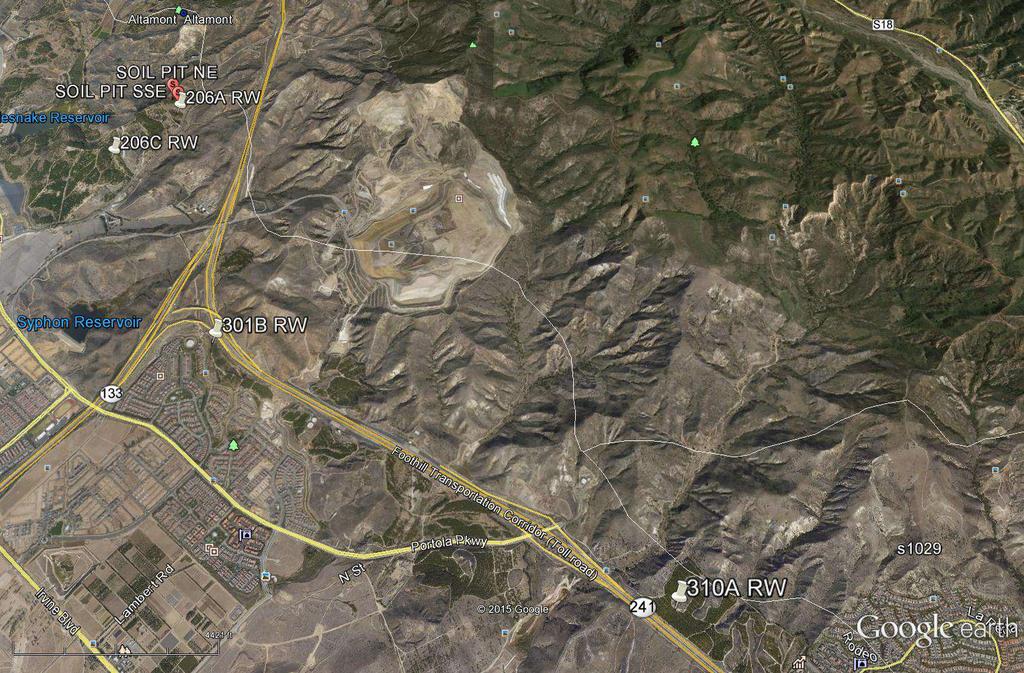
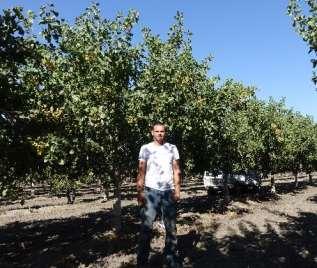
3 206A NE ig A NE showing tree size and canopy cover. Note the calcic salt precipitate weeping (lower right inset) from the side of the cut.


4 206A SSE Fig A SSE was the lower elevation site that had problem with excessive moisture and phytophthora.
5
6

7 SOIL SERIES CONTOURS DETAIL RANCH 206A
8 Figure 1. Production function model for avocado yields in relation to soil salinity. Model is based on the irrigation water EC and does not take into account accumulation of salts with inadequate leaching practices. (Adapted from Oster JD, Stottlemyer DE, and Arpaia ML Salinity and water effects on Hass avocado yields. J. Amer. Soc. Hort. Sci. 132: )
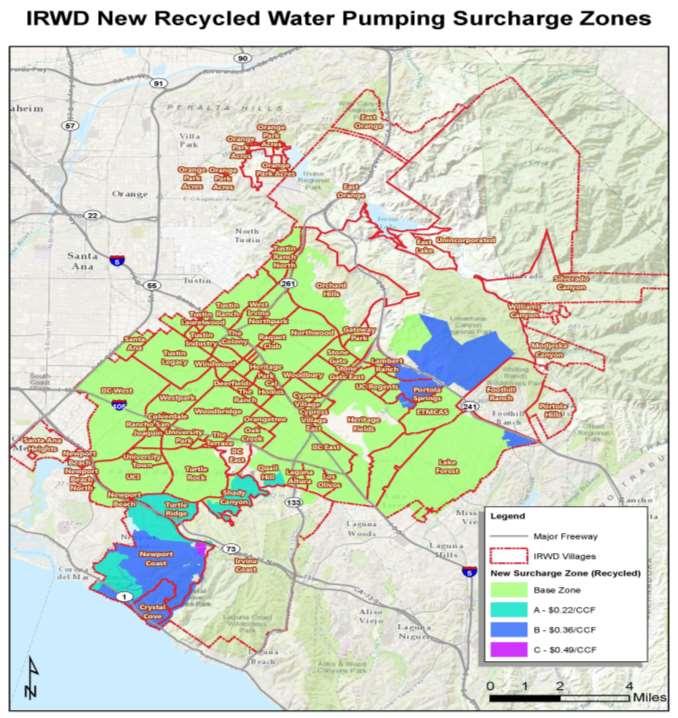
9 4/1/10 10/1/10 4/2/11 10/2/11 4/2/12 10/2/12 4/3/13 10/3/13 4/4/14 10/4/14 4/5/15 Recycled Water EC (µmho/cm) Variation in Recycled Water EC from Irvine Recycled Water District Average EC = 1.12 ds/m High EC = 1.48 ds/m Low EC = 0.92 ds/m Coef of Variation = 7.0% Fig. 4. Variability in Irvine Recycled Water District salinity over the last 5 years.
10 SALT LOADING AND ASSESSMENT OF LONG-TERM SUSTAINABILITY OF RECYCLED WATER FOR IRRIGATION OF IRVINE RANCH AVOCADOS (Final Report July 1, 2015) Objective: Utilizing real field data representative of Irvine Ranch avocado production, and recycled water quality data from the Irvine Recycled Water District assess the potential for long-term sustainable productivity and requisite management changes, if any, for groves transitioning from untreated fresh water to irrigation water typical of municipal recycled water. EXECUTIVE SUMMARY Existing literature: Avocado is generally considered one of the most salt sensitive crops commercially grown in California where rootzone salinity of 2 to 2.5 ds/m (laboratory electroconductivity of a soil saturation extract, ECe) is often associated with leaf injury and yield loss. Indeed, an average irrigation water salinity of 0.57 ds/m EC has been calculated as the threshold salinity with a 65% relative yield decline for every 1.0 ds/m added salinity above that threshold. But some of these studies present alternative results due to salt tolerant rootstocks and other mitigating effects of real soils that indicate viable long-term avocado production may be possible with irrigation water up to an EC of 2 ds/m and rootzone ECe s of 3 to 4 ds/m. (See Appendix B brief literature discussion for more detail.)
11 Soil Salinity: For the two sets of soil samples, rootzone EC ran 0.9 to 3 ds/m with sodium and chloride 2 to 12 milliequivalents/liter on the average. In general, for the May 5 samples, the RW blocks were 1.9 to 2.5 times the average level of these salts compared to the FW blocks. The June 5 soil samples were significantly lower in all salts with a rootzone ECe range of 0.7 to 1.7 ds/m and sodium and chloride ranging from 0.19 to 7.6 meq/l. The average RW soil salinity at 1.21 ds/m was only 1.3 times that of the FW blocks average. The consistency of EC, sodium and chloride concentrations from the May 5 th to June 12 th soil samples was very poor. Samples were taken from the same general area but not the same tree indicating the very large native variability in the Irvine Ranch soils and that soil salinity can reach upwards of 4 ds/m in some places that have never been irrigated with recycled water.
12 Irrigation Water Salinity: Fresh water irrigation salinity averages 0.6 to 0.8 ds/m EC. The salinity of the recycled water over the last five years averages 1.12 ds/m with a coefficient of variation (the standard deviation/mean) of 7.0%. Basically, you can expect the EC to run from about 1.0 to 1.2 ds/m over the long term. This is considerably above the Oster (2007) threshold for irrigation water EC. The SAR averages 4. RW was associated with a statistically significant increase in ph for the June 12 soil samples compared to the FW soil samples averaging 6.8. This was the reverse of the trend for the May 5 soil samples where RW soil ph was 6.8 and FW soil ph was 7.1 (not significant). Required Leaching Fraction (LF): Using the Allowable Concentration Factor approach proposed by Rhodes and Loveday (1990) for high frequency sprinkler/drip irrigation and assuming a constant salinity of 1.12 ds/m RW irrigation salinity, it would be necessary to maintain a 7.4% LF above crop ET on the average to maintain a steady-state rootzone ECe of 1.5 ds/m. The LF declines to 3.1% if a rootzone ECe of 2.0 is acceptable.
13 Table 7. Pearson Product Correlation values (R) for yield, salinity, irrigation water and USDA clay%. Irriga tion 5-5- Sat % 5-5- ph 5-5-EC ds/m 5-5-Na meq/l 5-5-Cl meq/l Sat % ph 6-12-EC ds/m 6-12-Na meq/l 6-12-Cl meq/l Avg Sample SP% USDA Clay (%) Cumulative Yield Irrigation Sat % pH EC ds/m Na meq/l Cl meq/l Sat % pH EC ds/m Na meq/l Cl meq/l Avg Sample SP% 0.47
14 CONCLUSION ON SUSTAINABILITY OF TREE HEALTH AND YIELD IRRIGATED WITH RECYCLED WATER: 1) Existing soil and topographical variability are existing factors most significantly impacting current yields and nsistent with their observations over the years leaf burn is seen here and there but no contree health. 2) Pervasive leaf burn indicative of excess salts (sodium, chloride and boron, most commonly) was not evident on the ranch in RW or FW blocks as of early June. Anecdotal comments by ranch staff indicate this is cosistent pattern. Mid-October would be the best time to rate trees. This should be done for every block this fall. 3) Soil and tissue samples collected in May and June corroborate the above observation no significant trend based on applied water. 4) The large majority of soil samples were < 2 ds/m EC, which appears to be a commonly found soil salinity level in many southern California groves. A long-term rootzone ECe of 1.5 to 2 ds/m should be attainable when using recycled water of 1.12 ds/m with a leaching fraction of 3 to 8% above water required for ET. 5) Sodicity of the recycled water nor any other specific constituent is at real problem levels and therefore no specific amendment recommendations are given at this time. Continued soil sampling is imperative and to be used to calculate potential gypsum / lime rates as needed in the future should soil structural problems / poor infiltration become a problem. 6) IN SUMMARY: Utilization of irrigation water from the Irvine Recycled Water District should be sustainable over the next 20 years. Increased vigilance and documentation is needed for ranch-wide soil and tissue sampling to identify potential problem areas and effect timely correction via amendment and irrigation scheduling strategies. This is especially important to take advantage of heavy rainfall years and still maximize both leaching and water use efficiency. Replanting should be done with salt tolerant rootstocks. Proper integration of these strategies should be able to maintain long-term yields between 80 to 100% of current ranch potential in my opinion.


15 UNIVERSITY of CALIFORNIA COOPERATIVE EXTENSION 2017 Annual Statewide Pistachio Day January 18, 2017 Visalia, CA Real World Pistachio Salt Tolerance for the San Joaquin Blake Sanden - Irrigation/Agronomy, Kern Craig Kallsen Subtropicals/Pistachios, Kern Louise Ferguson Pomology Specialist UCD
16 Salt tolerance and salinity trials review

17 The high profit margin of pistachios and the general assumption that this is a salt tolerant crop has resulted in trees planted to fields with severe salt problems often prone to water logging or sodicity and poor soil structure.

18 Salt increases osmotic potential, costing the plant energy and interfers with water uptake and limits critical processes like cell expansion for germination and shoot growth. Pistachios in Iran (irrigation EC 25 ds/m)


19 Site of Kern County Pistachio Salinity Trials 10 0 Development of pistachio plantings on the Westside of the San Joaquin Valley have yielded spectacular results
20 Yield Decline by Rootzone Salinity Total Inshell (lb/ac) Fitted Model (7-10th leaf total yield by average rootzone EC) 95% Confidence Boundary Total Inshell = *EC Salt tolerance from Sanden, et al Average Rootzone ECe 0-5 feet (ds/m)

21 Starrh (S ¼ section 9-3) S ds/m avg ECe, ds/m avg Zone 4 Least vigor Highest EC Zone 2 Less vigor 2 nd lowest EC Zone 1 Most vigor Lowest EC Zone 3 Less vigor Higher EC

22 BE avg ECe, ds/m
")


23 Expanded Salinity Survey: select the best (Area 1) to worst (Area 5) zone in a commercial field. Measure tree stature, rootzone salinity and yield Area 5: Average rootzone ECe to 5 ft 30.0 ds/m Area 1: Average rootzone ECe to 5 ft 14.2 ds/m (6/20/2014)

24 BW avg ECe, ds/m


25 BW avg ECe
 50 0 y = -7.505x + 156.53 R² = 0.")
26 Conductance (mmol H2O/m^2/sec) NDVI Tree Circumference (inches) Trunk Circumference (inches) 30 Tree Circumference 12/4/14 by Rootzone ECe to 5' 35 Trunk Circumference 12/09-11/ y = x R² = y = x R² = Rootzone Average EC to 5' (ds/m) 50 0 y = x R² = y = x R² = Average Rootzone ECe to 5 feet (ds/m) ECe to 5 Feet (ds/m) Cond 8/7/14 NDVI 8/7/ Tree trunk circumference, canopy Conductance (water stress) & NDVI by rootzone salinity
 with declining NDVI CERES")
 as a function of increasing")
27 CERES Flight 9/16/2016 Increasing water stress (as canopy temperature increase from field average) with declining NDVI CERES Flight 9/16/2016 Measured decrease in tree NDVI (normalized differential vegetative index) as a function of increasing salinity by ZONE/AREA


28 Rapid, non-invasive assay of combined soil salinity and water content using a Geonics EM38-DD ground conductivity meter
29 Correlation of summed EM38 ground conductivity (ms/cm, 12/19/2016) for vertical and horizontal readings for center of the Plot of berm Fitted Model and 30 inches out (Model is P = 0.001) AVG EC ds/m_1 = *Summed EM38-Hose AVG EC ds/m_ Summed EM38-Hose-30


30 Hand-harvest a group of 4 adjacent trees in each area
31 Cumulative Yield Decline by Plot of Fitted Model Average 3 Year Rootzone Salinity to 5 Feet Tree Edible Inshell (lb/ac) Total Edible Inshell = *Avg ECe R^2 = P< (With 95% confidence lines, P<0.0001) Salt tolerance from Sanden, et al Average Rootzone ECe to 5 Ft (ds/m)
32 Average 4 Tree Plot Plot of Fitted Model Yield Decline by Average 3 Year Rootzone Salinity to 5 Feet Plot Inshell Yld (lb/ac) Plot Inshell Yld (lb/ac) = * avg Plot ECe R^2 = P<0.017 Salt tolerance from Sanden, et al avg Plot ECe
 12000 10000 8000 6000 4000 2000 0 2014-16 Full Cumulative Yield = 5836.61-6.07043*Summed EM38 Hose-30 R^2 = 0.207 P<0.")
33 Cumulative Yield Decline by Increasing EM38 Readings possibly Plot of Fitted a Model more accurate and certainly easier tool than soil salinity sampling! Cumulative Edible Inshell (lb/ac) Full Cumulative Yield = *Summed EM38 Hose-30 R^2 = P< Summed EM38 Hose-30
 = 3745.6-3.47803*Summed EM38 Hose-30 R^2 = 0.167 P<0.")
34 2016 Yield only (lb/ac) 2016 Yield only (lb/ac) Yield only (lb/ac) = * AVG EC ds/m_1 R^2 = P< Plot of Fitted 12 Model AVG EC ds/m_ Yield only (lb/ac) = *Summed EM38 Hose-30 R^2 = P< Summed EM38 Hose edible inshell yield as a function of average rootzone salinity (above) compared to yield as a function of summed EM38 vertical and horizontal readings centered on the berm and 30 out (below).
35 Multiple regression model using ph, sodium, chloride, boron and average ECe as predictors of yield. Na and EC are NOT statistically significant! Standard T Parameter Estimate Error Statistic P-Value CONSTNT ph Na Cl B Avg ECe Total Edible Inshell = *pH *Na *Cl *B *Avg ECe (X 1000) observed R^2 = P< Plot of Total Edible Inshell (X 1000) predicted
36 Useful links CEKERN website ICAL_CONVERSIONS_AND_LEACHING_CALCULATIONS/ -Pistachio-Citrus_Regulated_Deficit_Irrigation/ GING_SALINITY,_SOIL_AND_WATER_AMENDMENTS/ ALUATION_AND_SOIL_PHYSICAL_MODIFICATIONS/ VING_WATER_PENETRATION/


37 Conclusions SOME ECONOMIC SENSE Pumped saline water cost ~$65/ac-ft. Expensive canal water ~$500/ac-ft in a drought. At 42 inches (3.5 ac-ft) to irrigate SJV pistachios the difference in water cost = $1522 $2.50/lb = 609 lb/ac pistachios maybe soil EC 8 for PG1, EC 10 for UCB
 published online: http://soils.usda.")
38 Happy planting and praying! California Soils Resource Lab (UC and NRCS): On-line Soil Survey UC Soils-to-Go: Use the following links for more information: Full California soil surveys (as PDF) published online: For georeferenced spatial and tabular data available for California (more difficult to access and requires use of GIS software): For locating NRCS offices in the US: