Shrinking the Footprint Energy Audit. User Guide
|
|
|
- Gilbert Long
- 5 years ago
- Views:
Transcription


1 Shrinking the Footprint Energy Audit User Guide
2 Table of Contents Introduction... 2 Getting Started... 3 Step 1 - Signing up... 3 Step 2 Set up your Church or School as a business... 4 Step 3 - Add your Church or School as a building... 5 Contact details... 5 Building details... 5 Meters... 6 Heating source... 6 Weather Station... 7 Fabric and equipment... 8 Using smeasure... 9 Logging in... 9 Finding your way around smeasure Reading your energy meters and submitting readings Enter a meter reading To view meter data Import meter readings Exporting data Review and understand your Energy Performance Finding your way around smeasure Snapshot Profile Members Data Peer Group
3 Introduction The Church of England Shrinking the Footprint Campaign is offering smeasure a web-based energy management tool - to all Church of England buildings at no cost to your building to encourage energy monitoring and reduction. Benefits of energy monitoring and using smeasure? - Understand your building s energy usage and compare it to the local weather to see energy efficiency and assess energy waste - Control and reduce energy costs energy management can save you up to 40% by: Quickly displaying any abnormal energy use, high consumption weeks and seasonal use as Providing you with the evidence to know what you have saved and what you would have spent if you did not take energy reduction action - Demonstrate you are taking measurable energy action and communicate this to your local community - View your buildings energy efficiency rating from A-G. If you are energy monitoring more than one building these can be ranked so that you can target your resource and energy saving measures. - Help the Church of England meet it s carbon reduction target - Protect the environment Cutting our energy use is vital because: - We are wasting money when we use fuel inefficiently - We are abusing God s creation by using more than we need and creating unnecessary pollution - We are actively affecting our global neighbours by adding to climate change through carbon emissions, which is already and will continue to have a catastrophic impact on the poorest people around the world. Many of whom we seek to support in other ways To get started, visit If you need help do not hesitate to us: kate.symonds@churchofengland.org Checklist to get started quickly: Information it is helpful to have to hand when signing up to the energy audit: Floor area (m2) of each building to be energy monitored (optional, but required for getting energy benchmark results) Number of meters for each fuel type. If you have gas meters note the units, which will be cubic metres and cubic feet - THIS IS VERY IMPORTANT. Price per kwh for each fuel type (optional as you can use the default values provided) Setting up your smeasure account should not take more than 30 mins 2


4 Getting Started This section is designed to guide you through the sign up process on smeasure. You will also notice prompts and help options next to relevant fields with links shown where additional information and guidance can be found. If you need help in signing up please contact Step 1 - Signing up Go to and click Free Sign Up in the top right. Fill in your details on the form, choose an available username, enter your address and choose a password. Make sure you tick if you agree to the Terms and Conditions to sign up. 3

5 Step 2 Set up your Church or School as a business Complete the business details form. Number of employees: Church = number attending Sunday services Church hall or office = number on an average day (need better advice Sunday congregation, total weekly numbers or staff?) School = number of students and staff 4
: Church or church hall = select churches under Public Buildings School = select relevant")

6 Step 3 - Add your Church or School as a building Go through and complete each step in the form You can add more than one building simply repeat the process Contact details - Fill in the contact details for the building Building details - Fill in the building details Building type (dropdown list): Church or church hall = select churches under Public Buildings School = select relevant building type under Education or Education Schools Number of occupants Church = number attending Sunday services Church hall or office = number on an average day School = number of people using that building Floor area the total heated floor area in squared meters. This information is essential for benchmarking your building but can be entered later if you don t have the measurements to hand. Find out how to measure the floor area 5


7 Meters Complete the form and follow instructions and tips displayed on the right of the screen including links to detailed instructions on understanding electric and gas meters Enter details of every meter in the building Heating source Heating source - Enter how the building is heated Heating base temperature this is the outside temperature below which a building needs to be heated. Typical base temperature for most buildings in the UK is 15.5 C. 6

8 Weather Station Select your building s local weather station from the dropdown list if you know if or locate it on the map by zooming in to your area. 7
9 Fabric and equipment Enter details of the building s heating equipment and if you have solar pv panels, window glazing and insulation. Registration is now complete! You can now start regularly energy monitoring 8
10 Using smeasure Logging in Visit and select Login in the top right-hand corner. Log in to the website using your username and password. If you have forgotten your password click Forgotten password? to receive an allowing you to reset your password. 9

11 Finding your way around smeasure in brief Snapshot of your building s performance To see your profile and edit and update it To enable analysis of your energy data To enter and edit meter readings To see peer group energy performance Reading your energy meters and submitting readings We recommend weekly meter readings for the best results as you will be able to quickly spot energy waste. We will send a weekly reminder to help you remember. Reading your meters and submitting them to the website should take just 5-10 minutes a week. You can enter the readings online every week or save up the readings to enter when it is convenient. You can also set up the account so that more than one person can enter data by inviting members. Enter a meter reading Enter a meter reading by either clicking Add new meter readings from the snapshot tab or from the data tab. - Select relevant meter from dropdown - Add reading - Select relevant date from calendar 10


12 Repeat this for each meter you would like to enter readings for and select the Add new reading(s) orange button. To view meter data Select All Meters from the left navigation bar within the data tab, which lists all meters. Click the name of the meter to view all the relevant data View data by data, reading, consumption, cost and carbon plus add a comment Click the pencil on the left of each reading to edit a reading and add comment Import meter readings To import readings from a CSV file, select File Import on left menu. CSV files should be created in excel for each meter to contain a date column and reading column, with no headings (see below). 10/12/ /12/ /12/ Save as type CSV (comma delimited) 11


13 Import file by browsing to find it, choose relevant meter from dropdown list and select Send file. Exporting data To export meter data, select File Export on the left navigation to export data into a CSV file. - Select meter from dropdown list and select Export meter. - This will download an excel file for all the meter readings for this meter, displaying the date, reading, energy consumption, cost and carbon. 12
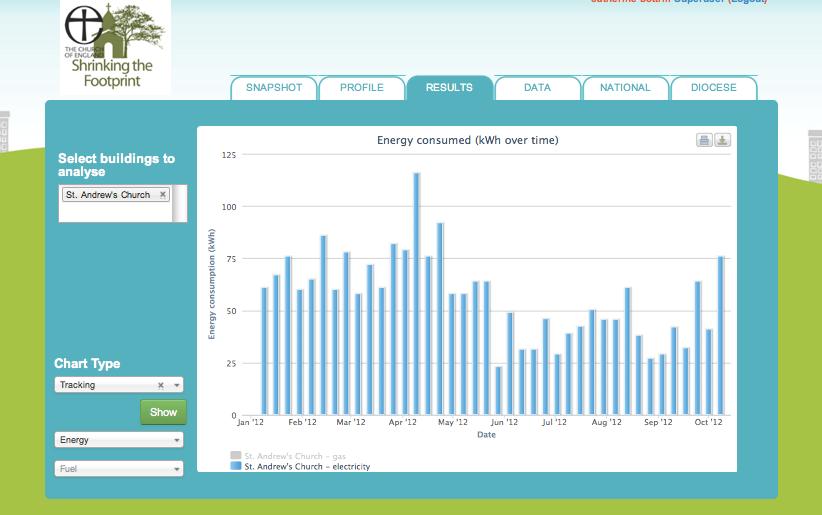
14 Review and understand your Energy Performance Once you have a few readings entered, you start to get analysis of how efficiently you have been using your energy. Select the Results tab to view a range of charting and graphing options. Select building to be analysed from list Select chart type from the dropdown list Downloading charts and graphs - All charts and graphs can be printed or downloaded (options of png image, jpeg image, pdf document or svg vector image) by selecting one of the two buttons on the top right of the chart. These can then easily be used to display in your building and share with others. Chart and graph options: Tracking by energy consumption, by cost and by carbon Annual performance overspend v underspend, summary by building or all buildings Weather efficiency - Heating efficiency, actual v predicted heating, evaluate heating interventions and weather conditions Building comparison A-G rating to benchmark your building Tracking This chart type allows you to see energy usage, cost and carbon. You can hover above a particular point on the chart to see usage details and the date, which will help you to identify high usage weeks if monitored regularly and investigate why. Be aware that when gas and electricity are displayed together, gas requires a much larger scale and so electricity data will typically be displayed as relatively consistent. See charts on energy below showing the electricity and gas together and the same data shown separately. - Energy shows electricity, gas and oil by default it shows all together. Click on each energy type from the bottom right of the chart to see individual energy chart. 13

15 Electricity 14

16 Gas - Cost 15
17 - Carbon Annual performance This chart type allows you to compare annual energy usage for different calendar years. This will allow you to see if your building is on track to meet your target for reducing energy consumption. This will be most useful once you have recorded more than a complete year of data inputting. Meter readings from previous years can be imported if available (see Reading your energy meters and submitting readings) and could be found on energy bills. By building (table) displays annual performance in a table - Carbon 16

18 - Cost - Consumption All buildings displays annual performance of all buildings you manage energy together if you have more than one building in the energy audit. 17


19 Annual performance chart displays annual performance in a chart - Consumption - Carbon 18
20 Weather efficiency Heating efficiency This chart type compares your building s heating energy with the outside air temperature in your area, displaying the heating efficiency. It will help you to understand how energy efficient your building is as well as identify weeks with unexpectedly high usage of heating. Degree days is a measure of the difference between the baseline (typically 15.5 C) and the actual outdoor air temperature multiplied by the number of days for the week. - The blue line displays the predicted heating needs for the building based on previous performance and in an ideal situation all the dots will fall close to or along the blue line. - 0 = the building s base-load standard level of energy used without heating. - The steepness of the blue line shows the energy efficiency of the building. If the line is very steep it means that as the outside temp increases energy demand increases a lot, which is not very efficient If the line is only slightly sloping it means that as the outside temperature increases energy demand increases only slightly, which is very energy efficient - Red dots are individual meter reading points and can be hovered over to see the date, number of degree days and energy usage. - high above the blue line are weeks where more heating was used that expected this sould be looked at in further detail, especially if seen over several weeks to find out why eg was there more activity in the building that week, was the heating thermostat turned up, was someone else in charge of heating levels? - Red dots below the line mean lower energy usage than expected this is a great thing and could mean that if everyone was comfortable in the building that week and there was normal usage of the building that week then the thermostat could be turned down! 19

21 Control chart heating This chart displays consumption of energy for heating compared to predicted heating - 0 is predicted energy usage and red dots are displayed in chronological order - If dots sit along the 0 energy consumption line then you are using predicted heating energy - If dots sit above the 0 energy consumption line then you are using more than predicted and should assess why this is if it appears over a number weeks. - If dots sit below the 0 energy consumption line then you are using less than predicted, which could be because you have made energy efficiency improvements or could mean that you were overheating the building previously. Building comparison - shows the building s A-G benchmark rating compared to national standards for similar buildings 20


22 Finding your way around smeasure in detail Snapshot The snapshot is for you to see your buildings energy performance, including energy tracking, weather performance, money performance, heating waste and carbon targets. It also details the number of members and buildings set up on smeasure and includes ideas for energy saving. Add new meter readings link on Snapshot page clicking on this link will take you straight to the page to add meter readings. 21


23 Profile - Select the profile tab to see your profile and edit / update it. This includes the building information, inviting members to your buildings and managing your membership to Peer Groups including requesting to join relevant Peer Groups, eg Shrinking the Footprint National Peer Group. Selecting the pencil icon next to the relevant building name allows the building manager to edit and update the building profiles. The navigation panel on the left side displays the order of section. Either scroll down or click on a section in the navigation panel to jump to that section. 22


24 Members - Building managers can invite additional managers to help them manage their account or invite guests to view only, by selected buildings. Results Select this tab to view a range of charting and graphing options. See page for detailed information on understanding energy performance. Data - To enter and edit meter readings 23

25 Peer Group - To see peer group energy performance for peer groups you are a member of eg Church of England: National Shrinking the Footprint Campaign This can be displayed by consumption, cost or carbon emissions so you can keep track of collective energy usage for peer groups you are members of. 24