Temperature Trend, Variability and Global Warming. Tarendra Lakhankar NOAA-CREST Center, The City University of New York
|
|
|
- Marvin Jonas Murphy
- 5 years ago
- Views:
Transcription
1 Temperature Trend, Variability and Global Warming Tarendra Lakhankar NOAA-CREST Center, The City University of New York
2 Overview Global Climate Change Greenhouse effect Watch Climate change mitigation Video Group Activity Plan of action
3 Global Warming Global warming is the increase in the mean surface temperature of the Earth. In the last century, the Earths average temperature has increased by 1 to 1.5. The last 30 years has seen a 10% reduction in the polar ice caps. Causes for global warming include: Burning of fossil fuels Removal of trees and plants Effects of global warming include: Rise in the sea level Precipitation pattern and amount changes Increase in size of subtropical desserts
4 4
 recorded from 1976-2013;")
; about a 50% reduction in European Alps glacier ice in the last 100 years; Source: National Geographic, Sept.")
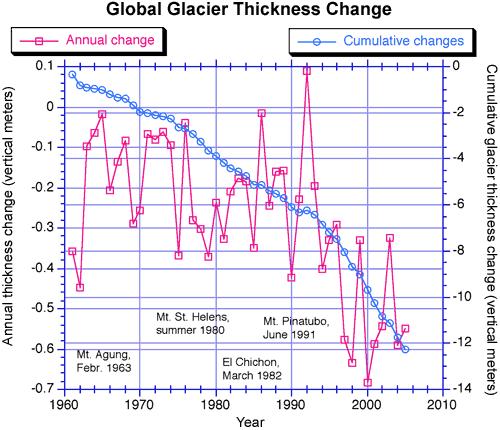
5 Global Warming Evidence There is firm evidence that the greenhouse effect is being enhanced and that we are entering a global warming period This evidence includes: 29 of the highest world average annual temperatures ever recorded (since 1880) recorded from ; with the exception of 1998, the nine hottest years have occurred since 2001 (2013 was the fourth hottest global year on record, 2005 and 2010 the hottest); about a 50% reduction in European Alps glacier ice in the last 100 years; Source: National Geographic, Sept. 2012
 collapsed into")
6 Global Warming Evidence an average rise in world sea levels of about 1 foot during the last century; a decline of about 42% in Arctic sea ice volume in the last 30 years; and the quick melting of portions of the Greenland and Antarctic ice sheets and Antarctic ice shelves (1995, 2002 and 2008 in March 2002 a portion of the Larsen ice shelf the size of Rhode Island (1250 mi 2 ) collapsed into the Antarctic Ocean) Change in Arctic Sea Ice Minimum
7


8 Global Warming Evidence

9 Identifiable change in the climate of Earth as a whole that lasts for an extended period of time (decades or longer) When due to natural processes, it is usually referred to as global climate variability Usually refers to changes forced by human activities that change the atmosphere Global Climate Change
10 What causes Earth s climate to change? Natural processes Volcanoes Tectonic plate movement Changes in the sun Human activities any activity that releases greenhouse gases into the atmosphere
11

12


13 Which gases in the atmosphere trap heat? The atmosphere is made of 78% Nitrogen and 21% Oxygen. But these gases don t trap heat and cause global warming or climate change. What % of the atmosphere is left? The gases which trap heat make up less than 1% of the atmosphere! They are called the greenhouse gases. The main greenhouse gases are: Carbon dioxide Methane Nitrous oxide Ozone Water vapour Halocarbons Human activity increases the amount of these gases in the atmosphere

14 How do humans increase carbon dioxide levels in the atmosphere? Burning fossil fuels releases the carbon dioxide stored millions of years ago. Most of the increased carbon dioxide comes from fossil fuels Deforestation releases the carbon stored in trees. Less trees also means less carbon dioxide can be removed from the atmosphere.

 The amount of methane in the atmosphere has increased by")
15 How do humans increase methane levels in the atmosphere? Methane is produced when bacteria rot organic matter Increased rice growing Increased livestock farming Methane is also released when fossil fuels (coal mines) are extracted Increased rubbish in landfill (gas) The amount of methane in the atmosphere has increased by two and a half times since the Industrial Revolution.
16 Nitrous Oxide (N2O) Emissions Nitrous oxide is emitted during agricultural and industrial activities, as well as during combustion of solid waste and fossil fuels. 16
17 Perfluorocarbons (PFC s) Aluminum production perfloromethane (CF4) GWP = 6500 perfloroethane (C2F6) GWP =
18 Insulator for electrical equipment Sulfur Hexafluoride (SF6) Emissions Fugitive emission from semiconductor manufacture Cover gas for magnesium production prevents the oxidation of molten magnesium in presence of air 18


19
20

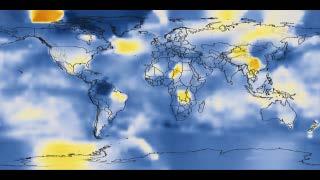
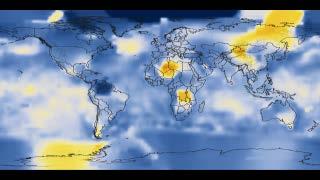
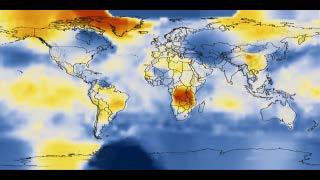
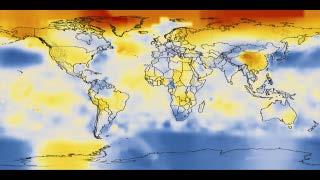
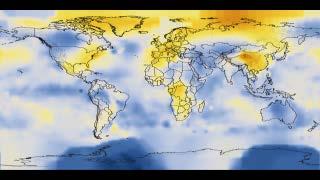
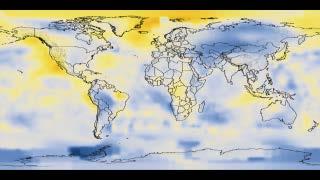
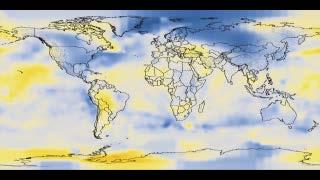
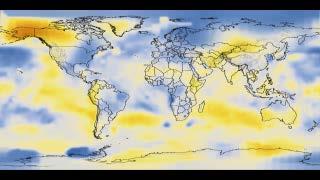
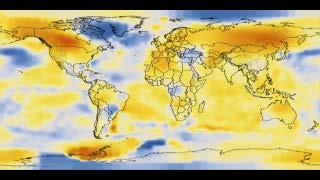
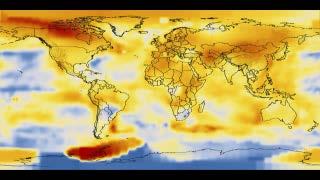
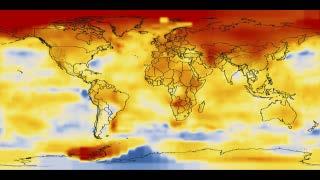
21 Research Almost 1000 studies dealing with different aspects of climate change have been conducted and published So how do we make sense of all this?

22 Intergovernmental Panel on Climate Change (IPCC) Why was it created? Created in 1988 by the United Nations Environmental Program Established to provide policy-makers with an objective source of information about climate change

23 Intergovernmental Panel on Climate Change (IPCC) Who is it? Governments Members of the UN Participate by naming experts and reviewing the reports before they re published Scientists Close to 1000 scientists Climatologists, ecologists, atmospheric physicists, and others Dr. Susan Solomon, a NOAA atmospheric chemist, an IPCC member and one author of IPCC summary
24 Intergovernmental Panel on Climate Change What do they do? Review current scientific and technical literature relevant to global climate change Provide reports on their findings at regular intervals Reports are designed to be politically neutral and of high scientific and technical standards
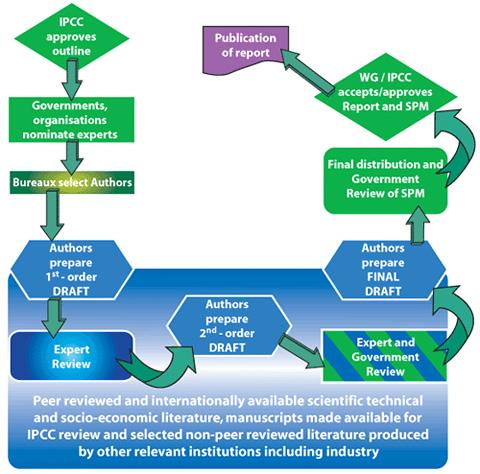
25 How do they create their reports? It s a multi-step process
26
27 When they discuss data: IPCC Words Used in Reports Very high confidence to very low confidence that the data is accurate When they discuss the likelihood of something occurring: Virtually certain to exceptionally unlikely


28

29 Observed Changes and Effects
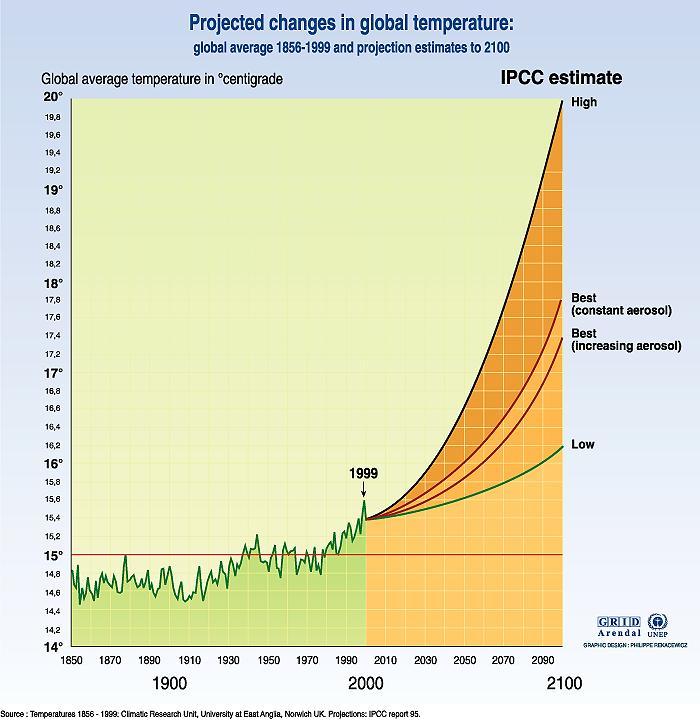
30 Warming of Climate Warming of the climate is definitely occurring and can be observed by the: Increases in global sea and air temperatures Widespread melting of snow and ice Rising global sea level

31 Source: IPCC 2007

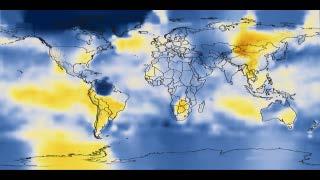
32 Temperature Change Data

33
34
35
36
37
38
39
40
41
42
43
44
45
46 Other Observed Changes and Effects 89% of current changes in ecosystems are consistent with changes expected due to global climate change Carbon dioxide, methane, and nitrous oxide levels in atmosphere have increased greatly due to human activities since 1750 and now far exceed previous levels Carbon dioxide has increased by approximately 80% since 1970

47 Human-Produced Greenhouse Gas Levels
48 New York s Urban Heat Island Project by: Brian Vant-Hull
49 Health Impacts of Temperature Vulnerable populations: - Elderly - Sick - Poor, no AC Curriero et al, 2011, American Journal of Epidemiology

50 "Forecasting the New York City urban heat island and sea breeze during extreme heat events". Meir, Orton, Pullen, Holt, Thompson and Arend, Weather and Forecasting. AMS.
51 UHI intensity = Turban - Trural Temperatures Differences Diurnal Variation in Urban vs Rural Temperatures (Granada) Montavez, Rodriguez, Jimenez, Int. J. of Climatology, 2000.
52 Change of Temperature with Time Slope = Heat Flow Heat Capacity Day Night Heat Flow Sun: high Thermal radiation: low Buildings Vegetation H. Capacity High Low

53 Complexity in the Urban Environment Satellite thermal imagery sees surface not air temperatures

54


55 Dewpoint calculated from RH and T Dewpoint is the temperature at which Evaporation balances Capture for water. Evaporation rate depends on Temperature. Capture rate depends on water vapor Density. So Dewpoint Temperature reflects water vapor Density
56
57 Color Scheme for all Measurement Units Black Blue Light blue Green Yellow Orange Red Purple White < units to units to units to units +/ units; neutral to units to units to units > units Bluer is lower: Yellow is Neutral: Redder is higher

58 Temp Avgs < In the shaded street data, low buildings are warmer, vegetation and higher elevations are cooler. In the sunny avenues > high buildings are warmer, proximity to water is cooler. There is also a patchwork effect between routes.

59 Fixed Avgs Hobo instruments, ~3.5 m high, 3 month averages at 1:30-2:30 pm. << Temperature Dew Point >>


60 Inputs to statistical model Albedo vegetation Building Area fraction Building Height Elevation Water fraction and nonlinear combinations thereof
61 Multi-variable Linear Regression Y = k + ax + bw + cz +... T = T 0 + a Albedo + b Vegetation + c Buildings +... Low positive correlation High negative correlation
 Multivariable")
 Increasing building height,")
62 Temperature Anomalies based on Surface Characteristics Streets (shadow) Multivariable Correlations < > Avenues (sun) Increasing building height, albedo cools in shade, heats in sun
63 Sunny versus Shady Regression Coefficients (corr) Surface variable Shady Sunny Vegetation (-0.24) -1.3 (-0.16) Albedo 5.3 (0.16) -4.9 (-0.21) Building area fraction -1.4 (-0.12) 5.6 (0.04) Building Height 0.03 (-0.09) 1.2 (-0.12) Elevation (-0.42) 0.01 (0.05)
64 GLOBAL CLIMATE CHANGE So.. What can we do?
65 There are several types of options Reduce emissions of greenhouse gases Attempt to develop alternatives energies Allow emission to continue, but prepare for global climate changes Allow emissions to continue as normal and leave preparations up to individual countries Combine any of these ideas Come up with your own unique plan!
66 Global Warming Video
67 Climate Change: The State of the Science Climate Change 2013: The Physical Science Basis IPCC Fifth Assessment Report Synthesis Report Climate Change 2014: Mitigation of Climate Change Home" 2009 documentary by Yann Arthus-Bertrand Saving Planet Earth & Stop Climate Change - Documentary The Science Behind Global Warming (Documentary)