Lower Rio Grande Valley Groundwater Transport Model: Predictive Simulations
|
|
|
- Edgar Wright
- 5 years ago
- Views:
Transcription
1 Lower Rio Grande Valley Groundwater Transport Model: Predictive Simulations Region M Meeting Sorab Panday, Bill Hutchison, Jim Rumbaugh, Staffan Schorr July 12, 2017
2 Topics Background and Project Status Status of Three Reports Predictive Simulation Results Next Steps
3 Background 2016 Region M plan recommends an additional 23 water management strategies involving Brackish groundwater (14): 24,160 AF/yr Fresh groundwater (9): 9,215 AF/yr Model is needed to: Evaluate groundwater level changes Evaluate groundwater quality changes Evaluate impacts to surface water Evaluate potential for subsidence
4 Project Status Conceptual model report delivered to TWDB on January 31, 2017 updated on June 30, 2017 based on comments to numerical report Numerical model report delivered on June 30, 2017 Responses to 100 specific comments to draft report in Appendix E Draft Predictive Simulations report delivered on June 30, 2017 All reports can be found at: gv_t/lrgv_t.asp

5 Model Domain and Grid

6 Model Layering

7 Calibrated Model Results for 2013 Chicot Aquifer

8 Calibrated Model Results for 2013 Evangeline Aquifer

9 Calibrated Model Results for 2013 Jasper Aquifer
10 Predictive Simulations Evaluate the potential impacts of each individual water management strategy individually and the cumulative impact of all strategies 25 Simulations of Flow and Transport from 2014 to 2070 Base case (2013 pumping) All water management strategies implemented 23 simulations where each strategy is implemented individually
11 Impacts of Pumping Changes in groundwater levels Changes in groundwater quality (TDS) Potential for subsidence Impacts to surface water flows
12 Summary of Predictive Simulation Report Section 2 documents how wells were located for the simulation Section 3 documents how the simulations were developed in Groundwater Vistas Section 4 provides an overview of the simulations Section 5 documents the post processors used for the simulation results, including how subsidence was estimated Section 6 presents the results of the base case, including uncertainty Section 7 presents results of individual strategies simulations and simulation of all strategies
13 Figure 1. Location of Brackish Groundwater Wells for Predictive Simulations

14 Figure 2. Location of Fresh Groundwater Wells for Predictive Simulations
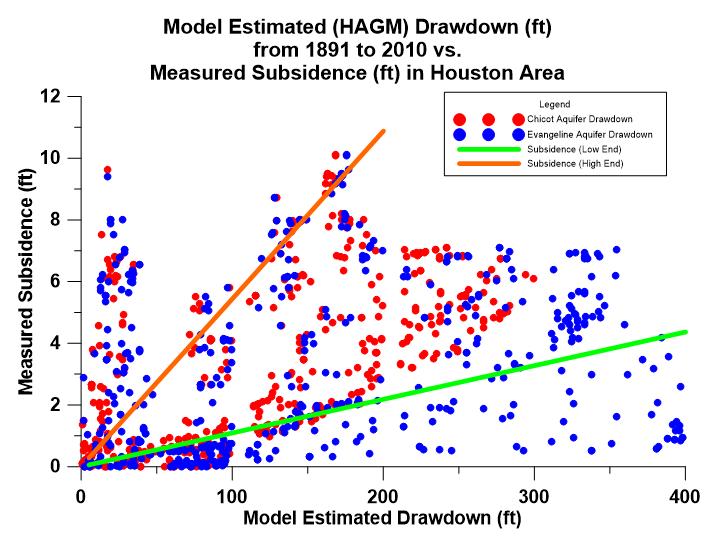
15 Subsidence Subsidence can result in some areas due to pumping of groundwater Function of drawdown and clay content LRGV has not experienced a high level of pumping Difficult to estimate subsidence with any accuracy with no ability to calibrate analytical or numerical models Geologically similar to other areas of the Gulf Coast Aquifer Subsidence has been observed in the Gulf Coast Aquifer in the Houston area Recent groundwater management is concerned with reducing groundwater pumping to halt subsidence
16
17 Use of Houston Area Data and Models HAGM: Houston Area Groundwater Model HAGM is calibrated to estimate subsidence over long periods of time Developed a relationship between drawdown and subsidence from HAGM to estimate range of potential subsidence in LRGV
18
19
20 Individual Strategy Results Details in Section 7 of report For each strategy: Number of wells Pumping amount Change in groundwater elevation and TDS Baseline 2013 to 2070 Attributable to strategy Results highlight the importance of design level investigations to understand clay content and water quality of surrounding area
21 Drawdown ~90 ft Subsidence ~ 1 to 5 ft

22 TDS increase ~27 percent
23 All Strategy Results Tabular data (Appendix A) Figures to show limited cumulative effects Drawdown and TDS impacts are generally localized Cumulative impacts: Drawdown increase with all strategies generally about 1 to 2 feet of additional drawdown TDS impacts is generally about 4 percent (increase or decrease)


24

25
26 Water Budget Analysis Initial response to pumping is decreased storage Over time, pumping captures other flow Component 2 Years of Pumping 57 Years of Pumping Decreased Storage 16% 2% Captured flow (Gulf) 31% 33% Captured flow (ET) 7% 9% Induced recharge (Rio Grande) 47% 49% Induced recharge (canals) 3% 4%
27 Takeaways Historic groundwater pumping in LRGV has been low Region M strategies represent a large increase Increased Groundwater pumping: Lowers groundwater levels (potential for subsidence) Induces flow from surrounding areas (potential for groundwater quality improvement or degradation) Reduces surface water flow about a 2 to 1 ratio (2 AF/yr of pumping means 1 AF/yr less surface flow)
28 Next Steps Predictive Simulation Report open for comment until August 4, 2017 Project completion date is October 31, 2017

29 Questions and Discussion net.com