Marek Gnatowski, Ph.D. Polymer Engineering Company Ltd.
|
|
|
- Claude Stevenson
- 5 years ago
- Views:
Transcription


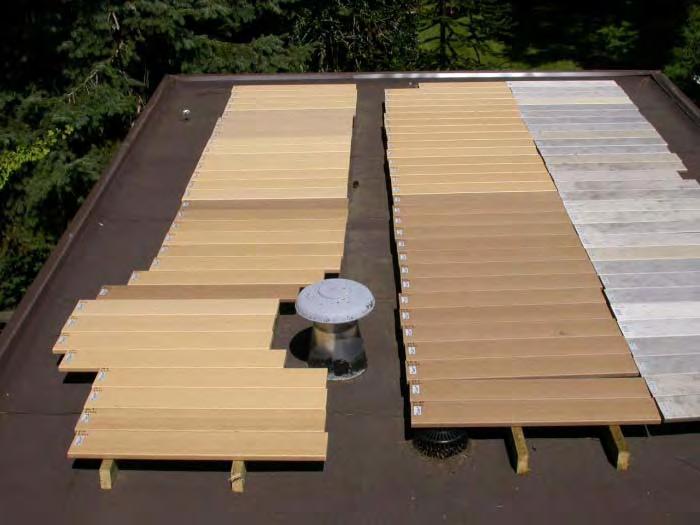
1 Marek Gnatowski, Ph.D. Polymer Engineering Company Ltd. 8 th Global WPC and Natural Fibre Composites Conference and Exhibition June 22-23, 2010 Fellbach/Stuttgart, Germany
2 Decking and fencing 51% Moulding and trims - 39% Windows and doors - 4% Others - 6% WPC sales are expected to advance % annually thru 2013* *Freedonia report

3


4

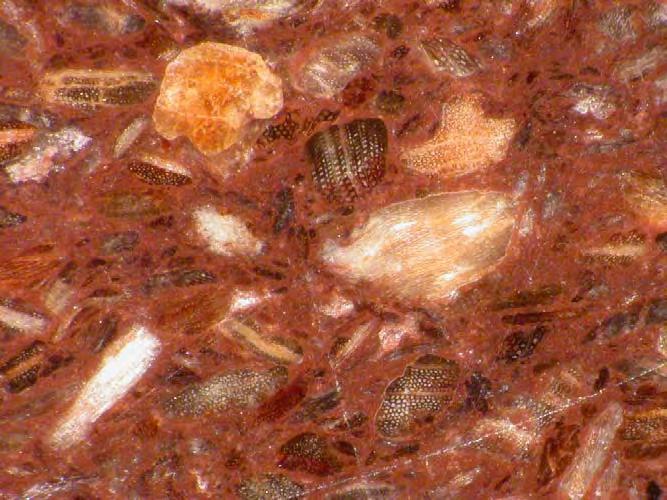


5 Wood particles are encapsulated in plastic Polyethylene water saturation ~0.01% Wood fiber water saturation ~25%
 50 40 30 20 10 0 A1 A2 C D1 D2 F1 F2 G1 G2 H #5 #6 #12 #13 Commercial")
6 Comparison of Water Absorption at Equilibrium for Experimental and Commercial WPC's Water Absorption (%) A1 A2 C D1 D2 F1 F2 G1 G2 H #5 #6 #12 #13 Commercial Experimental
7 Ingredients Formulation ID # Wood - Pine Wood - Oak HDPE Talc % Lubricants % UV Stabilizer Yes Yes Yes No No Yes Yes Yes No No Yes Yes Yes Yes Zinc Borate % Board Cross-section 6 x ½ 6 x ½ 6 x ½ 6 x ½ 6 x ½ 6 x 1 6 x 1 6 x 1 6 x 1 6 x 1 6 x ½ 6 x ½ 6 x 1 6 x 1 (inches) Quantities are approximate


8


9 Hilo, Hawaii Vancouver, BC
 hours of sunshine: 1950 pan evaporation: 22 (Bellingham, WA) Scheffer index:")
10 Vancouver, BC Annual Weather Data precipitation: 1118 mm average low temperature: 0 o C (January) average high temperature: 23 o C (July) hours of sunshine: 1950 pan evaporation: 22 (Bellingham, WA) Scheffer index: ~50
 Scheffer")
11 Hilo, Hawaii Annual Weather Data precipitation: mm minimum temperature: 12 o C maximum temperature: 34 o C hours of sunshine: 2100 pan evaporation: 91 (Honolulu) Scheffer index: ~330
12 Location Scheffer Index* Vancouver, B.C. ~50 Prairie Provinces ~35 Denver, CO ~35 Phoenix, AZ ~7 Wilmington, NC ~80 Miami, FL ~120 Hilo, HI ~350 *Tool for quantifying climatic exposure conditions and predicting wood above-ground performance based on Average Annual Temperature and the # days/month with measurable precipitation
 Moisture Content 60 50 B C #12A 70 Months Exposure MOISTURE CONTENT (%) 40 30 20 10 0 0 2 4 6 8 10 12")
13 Water Absorption / Moisture Content (%) Water Absorption 65% Pine (#12) Moisture Content B C #12A 70 Months Exposure MOISTURE CONTENT (%) DISTANCE FROM SURFACE (mm)
14 Sunny Exposure in Vancouver, BC Moisture content over time Months 46 Months 70 Months 35.0 MOISTURE CONTENT (%) 5A #5A 70 Months Exposure 45 #5A 46 Months Exposure 40 #5A 21 Months Exposure Moisture content (%) % Pine (#5) 65% pine (#12) MOISTURE CONTENT (%) DISTANCE FROM SURFACE (mm) 12A #12A 70 Months Exposure #12A 46 Months Exposure #12A 21 Months Exposure DISTANCE FROM SURFACE (mm)
15 Sunny Exposure in Vancouver, BC MOISTURE CONTENT (%) A & 12A 21 months #5A 21 Months Exposure #12A 21 Months Exposure Moisture content (%) % Pine 65% Pine 21 Months 46 Months Months MOISTURE CONTENT (%) DISTANCE FROM SURFACE (mm) A & 12A 70 months #5A 70 Months Exposure #12A 70 Months Exposure DISTANCE FROM SURFACE (mm)
 #1A 70 Months Exposure 45 40 35 30 25 20 15 10 5 0 0 2 4 6 8 10 12 45 #28A 70 Months Exposure")
 50% wood, 2% ZB (#3, #27) 65% wood, no ZB (#8, #33) 65% wood, 2% ZB (#10, #31) MOISTURE CONTENT")
16 Sunny Exposure in Vancouver, BC (70 months) Moisture content (%) Pine Oak MOISTURE CONTENT (%) #1A 70 Months Exposure #28A 70 Months Exposure DISTANCE FROM SURFACE (mm) #3A 70 Months Exposure #27A 70 Months Exposure % wood, no ZB (#1, #28) 50% wood, 2% ZB (#3, #27) 65% wood, no ZB (#8, #33) 65% wood, 2% ZB (#10, #31) MOISTURE CONTENT (%) DISTANCE FROM SURFACE (mm)
17 Exposure in Vancouver, BC (46 months) and Hilo, Hawaii (51 months) Moisture Content (%) % pine, UV stabiliser, ZB (#4) Sun 50% pine, no UV stabiliser, ZB (#6) 65% pine, UV stabiliser, ZB (#11) Vancouver Hilo 65% pine, no UV stabiliser, ZB (#13) Moisture Content (%) MOISTURE CONTENT (%) 50% pine, UV stabiliser, ZB (#4) Shadow 50% pine, no UV stabiliser, ZB (#6) 65% pine, UV stabiliser, ZB (#11) Vancouver #11 51 Months Sun Exposure Hilo #11 51 Months Shadow Exposure Hilo Hilo 65% pine, no UV stabiliser, ZB (#13) #11 46 Months Sun Exposure Vancouver #11 46 Months Shadow Exposure Vancouver DISTANCE FROM SURFACE (mm)
18 Moisture content (%) Sunny Exposure in Vancouver, BC (70 months) % pine, no ZB (#1,#5) No UV stabiliser UV stabiliser package 50% pine, 3% ZB (#4,#6) 65% pine, no ZB (#8,#12) 65% pine, 3% ZB (#11,#13) MOISTURE CONTENT (%) MOISTURE CONTENT (%) 1A & 5A 45 #1A 70 Months Exposure 40 #5A 70 Months Exposure DISTANCE FROM SURFACE (mm) 8A & 12A #8A 70 Months Exposure #12A 70 Months Exposure DISTANCE FROM SURFACE (mm)
19 Sunny Exposure in Vancouver, BC (70 months) Moisture content (%) % pine, UV stabiliser (#1,#4) 50% pine (#5,#6) 0% ZB 3% ZB 65% pine, UV stabiliser (#8,#11) 65% pine (#12,#13) MOISTURE CONTENT (%) MOISTURE CONTENT (%) #5A 70 Months Exposure #6A 70 Months Exposure MC DECAY DISTANCE FROM SURFACE (mm) #12A 70 Months Exposure #13A 70 Months Exposure DISTANCE FROM SURFACE (mm)
20 Density (g/cc) Density of WPC (#8) Exposed in Different Climatic Zones Hilo (HI) Vancouver (BC) Months of Exposure


21


22 Carbonyl index Weathering Exposure (hours) Carbonyl Index = h href h Abs h h 0 h cm
 0.011 3.")

23 Carbonyl Index 1. WPC (100 hours QUV) WPC (unexposed) HDPE Strip (100 hours QUV) WPC Exposed 2. WPC Unexposed 3. HDPE Strip
 Carbonyl Index: 0.")
 Carbonyl Index: 0.")
 Pine 50% UV Stablizer")
24 Carbonyl Index: (36 months) (4 months) Carbonyl Index: (36 months) (4 months) Carbonyl Index: (36 months) (4 months) Pine 50% UV Stablizer Zinc Borate 3% Pine 50% UV Stablizer Pine 50%

25 0.35 UVB 340 lamps irradiance 0.77 W/m 2 /nm 8 hours of light (60 o C) 4 hours of condensation (50 o C) cycle) Carbonyl Index mo s 28 mo s 4 mo s 4 mo s 4 mo s Accelerated Weathering Period (hours) Hawaii BC California

26 Raman spectroscopy* oxidized HDPE layer thickness ~0.6 mm Oxidation increase * Courtesy Thermo Nicolet
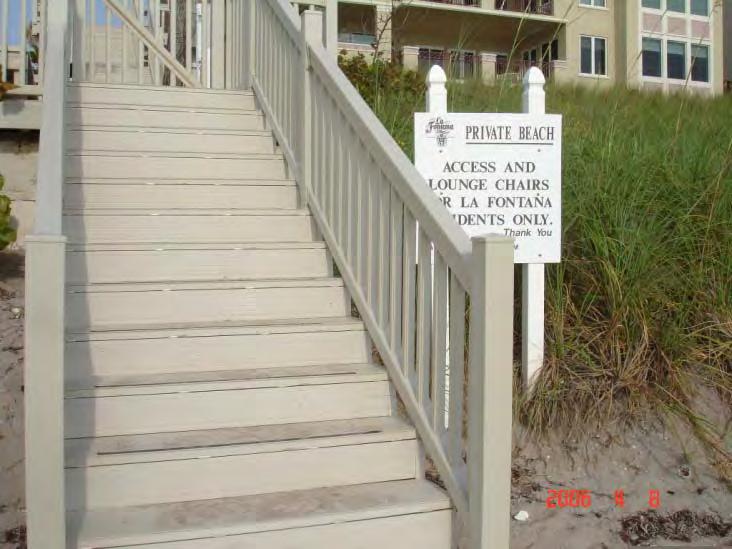
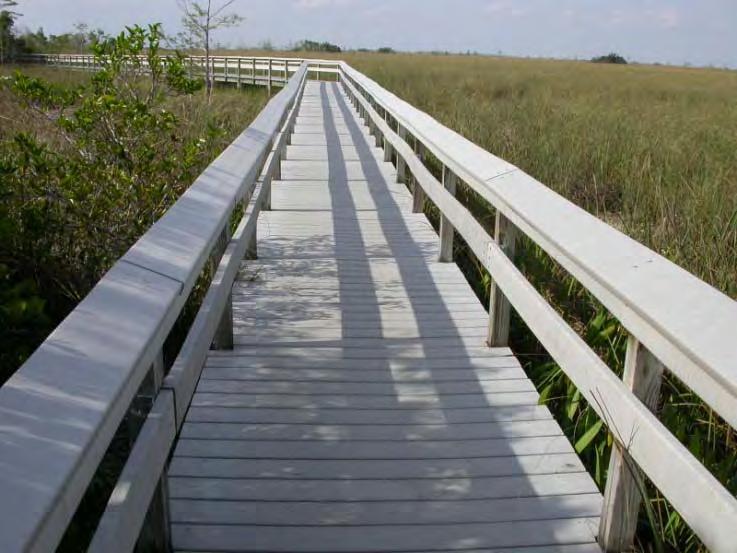
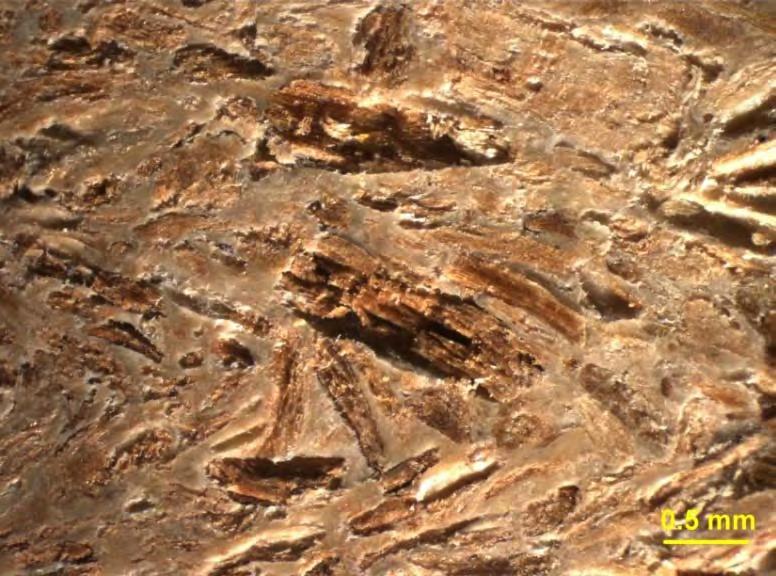
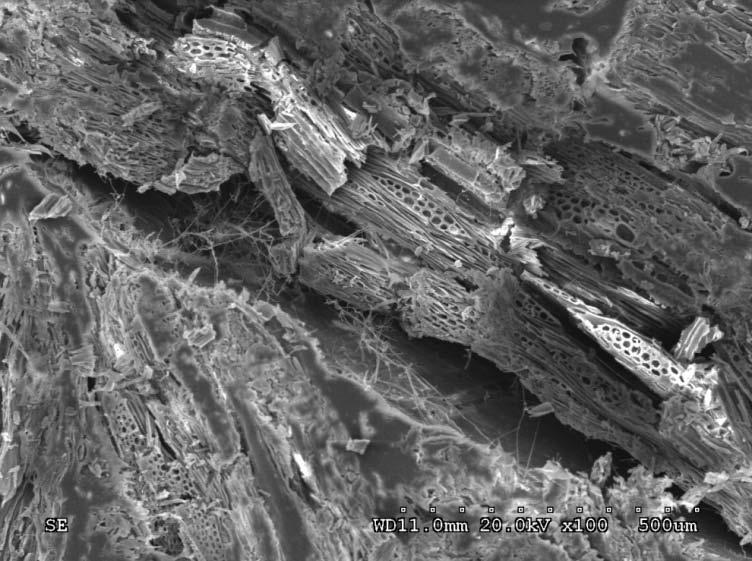
27 Wood Plastic Composite (WPC) boards progressively absorb a significant quantity of water during exterior exposure. Moisture content distribution in the board cross-sections has a characteristic U-shape, frequently exceeding the concentration required for decay initiation. Decay was observed for some samples exposed in extreme conditions. A major factor in water absorption by WPC was the ratio of wood to plastic binder; with the increase of wood content, moisture content progresses very quickly. Another factor in water absorption is the composition of WPC. Certain additives may significantly increase or decrease water absorption (for example zinc borate decreased water absorption in the tested formulations). Climate may not be a major factor here. Various FTIR techniques can be used to track the oxidative degradation of polyethylene binder in WPC. Analysis of FTIR spectroscopic data can be used for assessment of the relative progress of weathering and the effect of different additives. FTIR analysis of WPC after a few months of exterior exposure may serve as an indicator of long-term performance. Wood can accelerate photo-oxidation of polyethylene in WPC. The intensity of the process seems to be related to wood species. WPC degradation by UV light seems to be only a surface and shallow subsurface phenomenon Some additives commonly used in WPC may have a positive or negative effect on polyethylene photo-oxidation. Zinc borate can be seen as an example of a biocidal additive which also inhibits photo-oxidation.
28 Polymer Engineering staff involved in this research: Cecilia Stevens, Ph.D. Mathew Leung, B.Sc. Kate Mao, B.Eng. David Lesewick Christine Mah, B.Sc. Beverly Start Washington State University (Wood Materials and Engineering Lab) Raman spectroscopy Courtesy Thermo Nicolet