Annual State of Drinking Water Quality Report
|
|
|
- Shon Walsh
- 5 years ago
- Views:
Transcription

1 Annual State of Drinking Water Quality Report 2009 Reporting Briefing to Operating Board June 2010
2 Presentation Overview Regulatory Status Source Raw Water Quality Source Treatment (Cedar & Tolt Supplies) Distribution System Water Quality Water Quality Capital Improvements Key issues for 2010 and Beyond
3 Regulatory Status In 2009, we remained in compliance with water quality regulations, including: Source Water Quality Monitoring Surface Water Treatment Rules Lead and Copper Rule Disinfection By-Product Rule Total Coliform Rule Completed required DOH inspections: Cedar watershed and treatment facility inspection (annual) Tolt Treatment Facility sanitary survey (every 3 years)


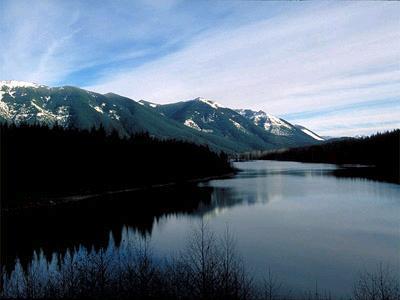
4 Source Water Quality Tolt Reservoir Raw water coliform levels were high in September and October 2009 no impacts downstream. Chester Morse Lake Lake Youngs Large Tabellaria bloom occurred in February Cyclotella bloomed in May 2009 at much lower levels than 2008.
5 Algal Biovolume, mm 3 /L Lake Youngs Total Algal Biovolume Historical Weekly Average (1991 to 2007) versus 2008 and Historical Weekly Average Dominant Species = Tabellaria Dominant Species = Cyclotella 2 0 Jan Feb Mar Apr May Jun Jul Aug Sep Oct Nov Dec
6 Cyclotella Biovolume, mm 3 /L Lake Youngs Cyclotella Biovolume 2008 versus Jan Feb Mar Apr May Jun Jul Aug Sep Oct Nov Dec
7 Source Treatment - Tolt Tolt Treatment Facility is performing very well. All regulatory requirements were met in Service Agreement performance targets - % time met: Turbidity (CFE): 99.93% Turbidity (IFE): % Ozone (Crypto): 99.98% Chlorine residual: 99.79% Fluoride: 99.96% ph: 98.64%
8 Tolt TF: Events and Issues Failure of domestic water pumping system (drives chlorination) shut down plant (April 2009) A slight off taste/odor detected in Spring 2009, but could not confirm source
9 Source Treatment -Cedar Cedar Treatment Facility is performing very well. No regulatory violations in Service Agreement performance targets - % time met: Chlorine residual: 99.98% ph: 99.99% Disinfection: %


10 Cedar TF: Events and Issues Algae screening improvements installed on side streams Very little impact from algae in 2009


11 Cedar TF: Events and Issues UV inlet valve leakage Small amount of water, but compliance by time All valve seats replaced Work ongoing with DOH and Service Agreement issues Other issues Minor taste & odor in spring Failure of UV inlet valve #13 Oct UV lamp break July
12 Distribution WQ Lead & Copper Rule All regional water systems remained in compliance with the Lead and Copper Rule in Cedar wholesale customers collected samples in th percentile lead level of 6.3 ppb, well below the lead action level of 15 ppb. Tolt wholesale customers and SPU were not required to sample in Seattle will sample in Tolt wholesale customers will sample in 2011.
13 Distribution WQ - Disinfection Byproducts Only Stage 1 DBP Rule sampling occurred in Stage 2 sampling will begin in All wholesale customers met the THM and HAA regulatory limits.

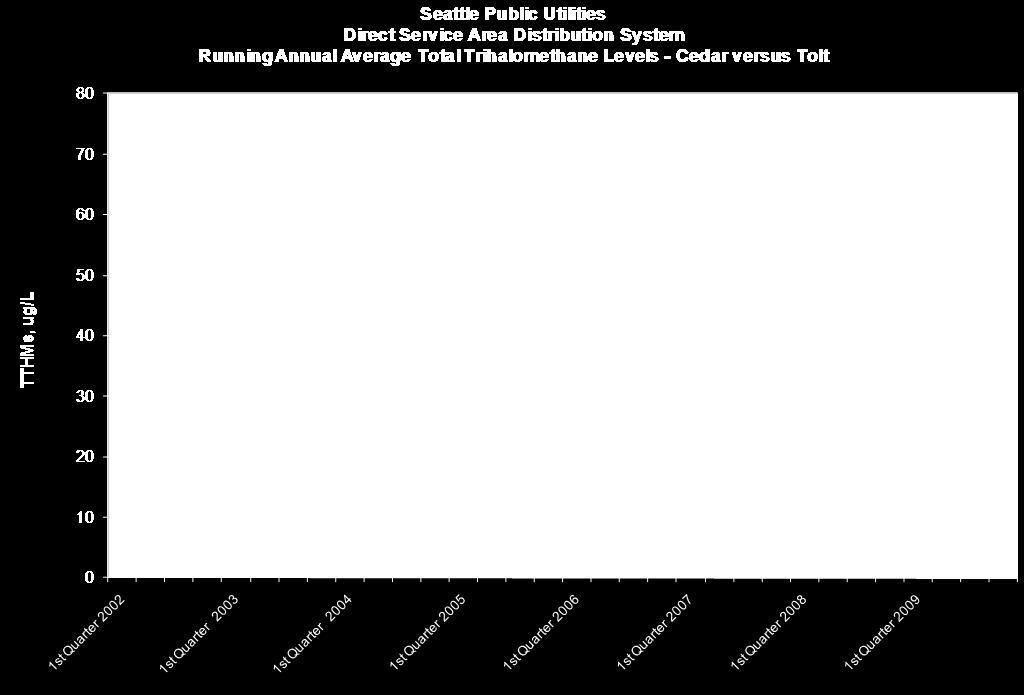
14 THM Results
15 HAAs (5), ug/l HAA Results Seattle Public Utilities Direct Service Area Distribution System Running Annual Average Haloacetic Acid Levels - Cedar versus Tolt 60 Cedar Regulatory Limit = 60 ug/l 50 Tolt
16 Distribution WQ - Total Coliform Rule (TCR) All regional systems remained in compliance with the TCR in There were 10 positive coliform samples out of 7038 samples in the wholesale service areas. In March, two wholesale customers each had one positive E. Coli sample on the same day. Repeat samples were all good. In follow up, we had a regional communications workshop.
17 Number of Positive Coliform Samples Wholesale Service Area Coliform Positives in Distribution System (weekly) WSA 4 Average 2002 to 2007 WSA January April July October
18 Percent of samples < 0.2 mg/l 10 Wholesale Service Area Low Chlorine Samples in Distribution (< 0.2 mg/l) Monthly Average Average 2001 to January April July October

19 Water Quality Capital Improvement Maple Leaf Reservoir Construction Began in spring 2009 On target for completion in Spring East cell of the reservoir is approx. 12% complete. Excavation for the west cell is underway.

20 Water Quality Capital Improvement West Seattle Reservoir Construction Began in June 2008 Returning to service June or July 2010.
21 Key Issues for 2010 & Beyond Capital Improvements Maple Leaf Reservoir and West Seattle Reservoir Covering Security improvements at Cedar and Tolt TFs (2010/2011) Possible fluoridation relocation from Landsburg to Lake Youngs Possible change from gas chlorine to hypochlorite at Landsburg Cedar TF UV Inlet Valve Leakage
22 Key Issues for 2010 & Beyond Cedar Water Quality Work Plan: Refine lake bypass operations Evaluate relocating fluoridation to downstream of Lake Youngs Concept plan & preliminary cost estimate completed by CH2M Hill Project is roughly $3M capital, $100K annual O&M Business case being prepared Improve surveillance and management of invasive species Evaluate existing Lake Youngs water quality model for use in lake management decisions Install continuous WQ & weather monitoring station in the lake (summer 2010) Develop phosphorous budget for Lake Youngs (implement 2010)
23 Key Issues for 2010 & Beyond Ground Water Rule (effective Dec 2009) Source monitoring (E Coli) or chlorination for viruses Revised Total Coliform Rule 5% limit on total coliform remains, but without violation/public notice requirement. Proposed rule expected in Effective date expected in EPA researching other distribution WQ issues separately.
24 Questions?