Nutrient distributions and the interaction between coastal wetlands and the nearshore of Lake Ontario
|
|
|
- Erin Barton
- 5 years ago
- Views:
Transcription

 56 39 78 ~ Watershed (ha) 33,289,652 28,653")


1 Nutrient distributions and the interaction between coastal wetlands and the nearshore of Ontario Krista Chomicki and Gary Bowen International Association of Great s Research, 25 Type Durham Region Coastal Wetland Monitoring Project Frenchmans Drowned River Barrier Beach Lagoon Drowned River and undergoing Restoration Efforts Drowned River Size (ha) ~ Watershed (ha) 33,289,652 28,653 3,69 Watershed:size Vegetation type Marsh 64% Swamp 36% Long term monitoring program that assesses the conditions of 5 wetlands in the region Water and sediment quality Watersheds and landuse Submerged aquatic vegetation Aquatic macroinvertebrates Fish Breeding amphibians and birds Marsh 99% Swamp % Marsh 88% Marsh 24% Swamp 76% Water Quality Fair Fair Fair Poor Trending Improving Mixed Improving Mixed

 Outlet")
 Marsh (DRM)")
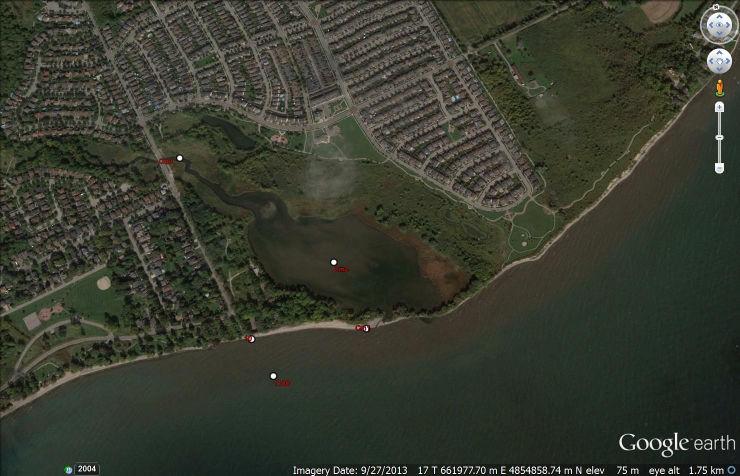
2 Drowned River vs. Barrier Beach Lagoon Marsh (DRM) Frenchmans Bay Marsh (BBL) Outlet closed in droughts Marsh (DRM) Marsh (DRM) Marsh (DRM) Frenchmans Bay Marsh (BBL) Marsh (DRM) Marsh (DRM) 2

3 This program differs from the DRCWM Project Sampling occurred concurrently with lake monitoring program 3 to 6 locations sampled in each marsh 27 to 29, generally monthly between April and November Frenchmans Bay Marsh not sampled until 28 Water quality York-Durham Regional Environmental Lab TP, SRP NO 2, NO 3, TKN, NH 3 E. coli ph, alkalinity, conductivity Suspended solids Frenchmans Bay Marsh Marsh Marsh Seasonal differences Marsh Spatial differences Water quality in relation to lake levels 5, From Land to, Increasing Total Phosphorus concentration (µg/l) IJC OBJECTIVE for open-waters. Creeks Storm Drains Marshes Diffuser (TOP) Diffuser (BOTTOM) (< km) (< km) BOTTOM (> km) (> km) BOTTOM DW Intake 3
4 Marsh: TRCA (wet weather) and MOE Figure reference: Todd Howell, MOECC Marsh: TRCA (wet weather) Wet weather Regional Monitoring Program m m 8 Jan Feb Mar Apr May Jun Jul Aug Sep Oct Nov Dec Jan Feb Mar Apr May Jun Jul Aug Sep Oct Nov Dec Total P (µg/l) 6 4 Discharge (m 3 /s)
5 In relation to discharge to the lake Summer 27 (very dry) 25 Total Phosphorus (µg/l) 2 5 Fall and Spring Total Phosphorus (µg/l) Discharge (m 3 /s) Discharge (m 3 /s) TN Greater flows TN 3 Summer /Fall Nitrate + Nitrite TKN 3 Increasing concentrations Nitrate + Nitrite TKN Nitrogen concentration (µg/l) (very dry) Nitrogen concentration (µg/l) Discharge (m 3 /s) Discharge (m 3 /s) E.coli generally decrease towards the lake E.coli (counts/ ml) Frenchmans Bay 29 4/29/29 5/29/29 6/3/29 7/3/29 8/3/29 /2/29 /4/29 E.coli (counts/ ml) 29 4/29/29 5/29/29 6/3/29 7/3/29 8/3/29 //29 /4/ E.coli (counts/ ml) 4/29/29 5/29/29 6/3/29 7/3/29 8/3/29 E.coli (counts/ ml) 4/29/29 5/29/29 6/3/29 7/3/29 8/3/29 /2/29 //29 /4/29 /4/29 5
 Tributary discharge, lake circulation and lake biology as drivers of water quality in the Canadian Nearshore of Ontario.")
6 Phosphorus Distributions by Marsh s High variability, and concentration gradients are observed on the scale of meters by Creek mouths illustrate localized nature of tributary runoff Creek Creek Taken from Figure 3 in: Howell, E.T., Chomicki, K.M., and Kaltenecker, G. (22) Tributary discharge, lake circulation and lake biology as drivers of water quality in the Canadian Nearshore of Ontario. Journal of Great s Research 38(S4): of Marsh SRP (µg/l) of Marsh TP (µg/l) of Marsh TP (µg/l) Frenchmans Bay Frenchmans Bay Through the marsh and Marshes Appears to be a mix between loss of nutrients and introduction of nutrients Marsh TP source between top and mouth of marsh, but SRP is decreasing (consumption? dilution?) Frenchmans Marsh Is phosphorus being processed? Is there dilution from the? Note the line Frenchmans marsh samples at the mouth of the marsh of Marsh SRP (µg/l) 6
 25 2 5 5 TP (µg/l) Frenchmans Bay")
7 of Marsh TP (µg/l) Frenchmans Bay What happens at the lake? and Marshes Appears to be consumed or diluted Some exceptions where TP is greater than Marsh mouths Marsh Appears to be consumed or diluted of Marsh SRP (µg/l) TP (µg/l) Frenchmans Bay Frenchmans Marsh No samples at the Assuming a simple dilution from the River to the Offshore : more P than expected : more P than expected : more P than expected Exceptions: sometimes spring/fall SRP (µg/l) 4 3 The same holds for Suspended Solids! - appears to be a mix between loss and introduction of SS (resuspension?) Frenchmans TP (µg/l) 2 TP (µg/l) 5 Settling? Dilution from? Still in a line like P Suspended Solids (mg/l) Suspended Solids (mg/l) TP (µg/l) 8 6 TP (µg/l) 3 2 Source between and Suspended Solids (mg/l) Suspended Solids (mg/l) 7
8 25 of Marsh Nitrate+Nitrite (µg/l) of Marsh Nitrate+Nitrite (µg/l) of Marsh Nitrate+Nitrite (µg/l) Frenchmans Bay Frenchmans Bay of marsh has higher nitrate concentrations than the mouth Nutrient processing? Dilution from sources with lower concentrations (e.g. lake, groundwater, etc)? Nitrate + Nitrite Sometimes for nitrate + nitrite lake > marsh particularly in (DRM) Nitrate+Nitrite (µg/l) Total N Difference Total N (µg/l) - - (µg/l) Frenchmans Particularly during the dry year > < Not a clear relationship between changes in total nitrogen between top and mouth of marsh Rain? Vegetation? Release from sediments? Total N Total Difference N (µg/l) (µg/l) > < Frenchmans has higher TN than the lake 8


9 % Nitrate+Nitrite Generally between the top and mouth, we see: nitrate + nitrite - TKN % TKN % Nitrate + Nitrite 29 Marshes are exporting TKN which is becoming oxidized to Nitrate in the nearshore How does seicheofaffect The lake influence marsh seichechemistry? Regional Monitoring Program MOECC LOBO 9
10 Flushing Rate Based on Low Water Levels Flushing Rate (days) Discharge (m 3 /s) Water Level Year Median Flushing rate: - 4 days Low Medium High Flushing Rate (days) Based on Low Water Level Dry 25 Dry Ac Dry Dec Jan Feb Mar Apr May Jun Jul Aug Sep Oct Nov Dec Jan Median range Spring Summer Fall Winter Low Medium High
, there is little/no access between the marsh and lake Ontario Levels Ontario water level Water level (m: IGLD 985) 75.4 75.2 75. 74.8 74.")
11 Ordinary High Water Line m CGD When levels are below ~74.5 m (CGD), there is little/no access between the marsh and lake Ontario Levels Ontario water level Water level (m: IGLD 985) Record low to Record high Toronto (daily) 74.4 WET DRY WET WET AVG WET AVG WET WET Date
 Frenchmans Bay Marsh (BBL) Behave similarly - Mix between loss and introduction of nutrients/solids - Increases in E.")
12 TRCA Stream Gauge: affected by backwater from Ontario MOE Stream Gauge: affected by backwater from Ontario Drowned River vs. Barrier Beach Lagoon Marsh (DRM) Frenchmans Bay Marsh (BBL) Behave similarly - Mix between loss and introduction of nutrients/solids - Increases in E.coli between top and mouth of marsh - TP concentrations drop from marsh to lake, but generally higher than expected - TN concentrations drop from marsh to lake, %TKN decreases and %NO3+NO2 increases Behaves different from DRM - TP is either being processed or settling out - interactions to be determined in upcoming years Marsh (DRM) Marsh (DRM) Behaves different from other DRM - source of TP and solids (top and mouth), decline in SRP - Decreases in E.coli between top and mouth of marsh - TP concentrations drop from marsh to lake, but generally higher than expected - TN concentrations drop from marsh to lake, %TKN decreases and %NO3+NO2 increases 2
13 Take home messages TP and TN decrease between the marsh mouth and the lake Marshes are releasing TKN which oxidizes to NO 3 in the lake TP concentrations are greater than expected Although the lake response to marsh inputs is consistent, marshes respond differently to nutrients The role of coastal marshes in nutrient dynamics should be taken into account prior to marsh restoration Loading estimates for the lakes do not consider processing that occurs between the sampling station and the lake, coastal marshes could affect load estimates Future efforts will consider marsh levels, diurnal changes, redox conditions, and lake seiche Acknowledgements Environment Canada Ontario Ministry of the Environment and Climate Change Regional Municipalities of York and Durham Toronto and Region Conservation Authority field team Jamie Duncan, Chris Menary, and Cathy Eden, TRCA 3