Management of Water Systems under Uncertainty
|
|
|
- Abraham Skinner
- 5 years ago
- Views:
Transcription
1 UCOWR/NIWR/CUAHSI Annual Conference Water Systems, Science, and Society Under Global Change Tufts, June 2014 Management of Water Systems under Uncertainty Uri Shamir Technion Israel Institute of Technology and The Interdisciplinary Center (IDC) Consultant to the Israeli Water Authority Chair, Kinneret and Watershed Monitoring Team
2 A Management Model is a Platform for Disciplined Discourse In fact, any model: conceptual, verbal, mathematical, ecological, deterministic or stochastic, simulation or optimization, singleobjective or (always!) multi-objective Discourse: in formulation of the model, examination of intermediate results, evaluation of final results and of re-formulation and re-run A well-structured model enables/enforces a disciplined discourse
3 A Management Model is a Platform for Disciplined Discourse Today: management under uncertainty of the Israeli national water system Uncertainty on the supply and demand sides, leaving out uncertainties in the distribution system, and in economics, finances, management, politics Brief mention of the methodology we use for robust optimization under uncertainties


4 WATER SOURCES Haifa Western Galilee Aquifer Carmel Aquifer Kinneret Watershed Lake Tel Aviv Jerusalem Coastal Aquifer ~100 km N. East Mountain Aquifer East West Gaza Aquifer Negev Aq. Arava Aq. Highly integrated national and regional water systems Average Annual Potential Med-Jordan R.: ~1,700 mcm/yr Israeli system: ~1,200 mcm/yr
5 Standard Precipitation Index (SPI) for the National System 2-year backward moving average of the total precipitation (Amir Givati, Meir Rom & Uri Shamir, IHS, March 2012) 3 Israel, Time Scale: 2 years 2 1 SPI S P I SPI SPI שנים

6 Standard Precipitation Index (SPI) History Forecast Longer, more frequent & deeper droughts 6
7 Natural Replenishment (mcm/year) All Sources from Mediterranean Sea to Jordan River (exc. Gaza) Data: The Natural Water Resources Between the Mediterranean Sea and the Jordan River, IHS /1992-3,839 mcm (Pinatubo?) Av = 1,848 SD = Av = 1,748 SD = 584 Cum. Deficit 1,530 mcm? Cum. Deficit ~1,770 mcm Av = 1,643 SD = 465
8 700 Water (incl. effluents) לנפש, מ"ק consumption, צריכת מים m 3 /cap/year Agriculture (including effluents) Total Urban ~60% effluents Industry Source: Prof. Yoav Kislev חקלאות תעשייה משקי בית סך הצריכה Since 1960: 7-fold reduction in per capita fresh water use for agriculture, and 3.5-fold reduction is total (water+effluents) use per capita for agriculture

9 Urban Consumption (m 3 /cap/year) & 2012 est. Total settled sector ~15% Municipal areas (w/o Ag. & Ind.) Private homes & gardens From: Sharon Nussbaum, IWA
 1996-2011 & 2012 est.")

10 Total Urban Consumption (m 3 /cap/year) & 2012 est. m 3 /cap/year 15 m 3 Delta = (105-90) x14 million = 210 mcm/year From: Sharon Nussbaum, IWA

11 Long Term Master Plan for the National Water Sector Part A Policy Document Version 4 August 2012
12 2012 Master Plan for the Israeli National Water Sector: Stochastic simulation with an aggregate model of the national water system Max Storage Replenishment Desalination Shutdown Water table Pink Line Red Line Flows min Level Reference Line Desalination Demand Deficit Flows & Spills Deficit

13 1,700 1,600 1,500 1,400 1,300 1,200 1,100 1, The Stephen and Nancy Grand Water Research Institute שנה Desalination ק " Capacity, התפלה, מלמ mcm/year Development of Desalination Capacity as אספקה* a function במדיניות אמינות of Required נדרשת כתלות Reliability התפלה 75% 90% 95% 100% מחסור מקסימאלי 250 מלמ"ש תוכנית מאושרת תוכנית מומלצת * נבחנה על בסיס תרחישים שהוגדרו Technion Israel Institute of Technology

14 Sea-Water desalination program started in : Existing desalination capacity 587 mcm/y 50% of the average natural replenishment Hadera: 127 mcm/y started end of 2009 Palmachim: 90 mcm/y started forecast: ~1,100 We offered the Palestinians to locate a mcm plant at Hadera for direct supply to the WB Ashkelon: 120 mcm/y started 2006 Sorek 150 mcm/y in 2013/4 Ashdod: 100 mcm/y in mcm/y desalinated brackish
15 Development of Expected Storage (above Red Lines ) תוחלת האוגר כתלות באמינות 3,000 2,500 Storage MCM אוגר, מלמ"ק 2,000 1,500 1, שנה Year אוגר רצוי 100% מחסור 250 מלמ"ש 75% 90% 95%


16 צריכה לנפש 100 HIGH Weighted scenarios of: hydrology, population growth, consumption: per capita, agriculture תכנית התפלה מילוי ממוצע פחות 15% אוכלוסיה למ"ס גבוה: קצב %, מיליון ב מחסור מקס' 560 מלמ"ש חקלאות 550 מלמ"ש. W 1 =30% צריכה לנפש 90 MEDIUM תכנית התפלה W 2 =60% SUGGESTED PLAN מילוי ממוצע רב שנתי אוכלוסיה למ"ס בינוני: קצב %, מיליון ב מחסור מקס' 640 מלמ"ש חקלאות 500 מלמ"ש צריכה לנפש 80 LOW תכנית התפלה W 3 =10% מחסור מקס' 550 מלמ"ש מילוי ממוצע רב שנתי אוכלוסיה למ"ס נמוך: קצב %, מיליון ב מחסור מקס' 0 מלמ"ש חקלאות 400 מלמ"ש W i =100%
17 In October 2013 the Gov t decided to reduce the purchase of desalinated water this year from 585 to 345 mcm We used an aggregate optimization model for determining the optimal reduction plan And are now making it monthly, for preparing next year s plan


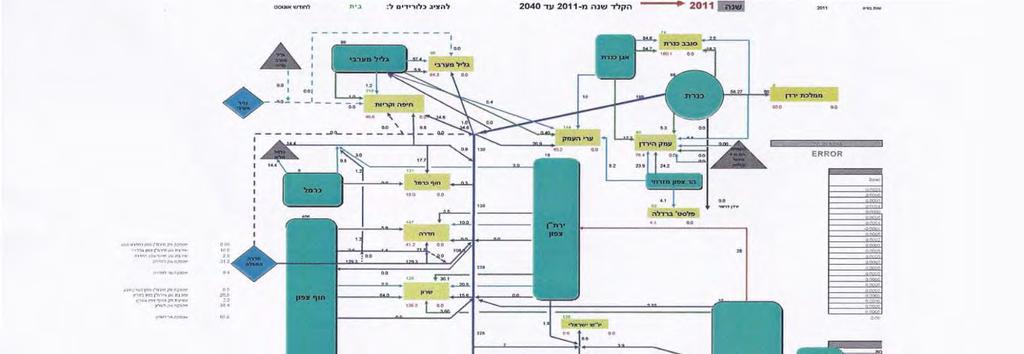
18 D S<Smax 18 3 demand zones, 8 natural sources, 5 desalination plants
19 New developments in Optimization under Uncertainty Based on the 2011 PhD of Mashor Housh Highly efficient solution of the deterministic model for solving (many) scenarios Efficient Stochastic programming, wait and see here and now, two-stage and Multi-stage (MSP) Limited Multi-stage Stochastic Programming (LMSP) Info-Gap model Robust Optimization: Robust Counterpart (RC), Affine Robust Counterpart (ARC), Affine Adjustable Robust Counterpart (AARC)
20 Robust Counterpart. Recharge 2 R 2,max R 1,min ( Rˆ, Rˆ ) 1 2 R 1,max Recharge 1 R 2,min The size of the ellipse is set by a user defined parameter ϴ
21 Central part of the INWSS: 15 year operation Aquifer 2 Aquifer 3 Aquifer 1 3 aquifers, 5 desalination plants, 9 consumer zones, 14 network nodes


22
 RP(Θ=3) CP Reliability (%) 90 80 70 60 RP(Θ=1) A good")
23 Reliability vs. Mean Cost 100 RP(Θ=2) RP(Θ=3) CP Reliability (%) RP(Θ=1) A good compromise solution Mean Cost (M$/year)
24 A Management Model is a Platform for Disciplined Discourse In fact, any model: conceptual, verbal, mathematical, ecological, deterministic or stochastic, simulation or optimization, singleobjective or (always!) multi-objective Discourse: in formulation of the model, examination of intermediate results, evaluation of final results and of re-formulation and re-run A well-structured model enables/enforces a disciplined discourse
25 UCOWR/NIWR/CUAHSI Annual Conference Water Systems, Science, and Society Under Global Change Tufts, June 2014 Management of Water Systems under Uncertainty Uri Shamir Technion Israel Institute of Technology and The Interdisciplinary Center (IDC) Consultant to the Israeli Water Authority Chair, Kinneret and Watershed Monitoring Team