Water Treatment Plant Year-end Report for 2014
|
|
|
- Hollie Newman
- 5 years ago
- Views:
Transcription
1 Water Treatment Plant Year-end Report for 2014 Water demand The total influent volume of water drawn from the Assiniboine River for treatment was approximately 6.03 % higher in 2014 than in had an influent volume of 6,502,784 m3, as compared to 6,895,196 m3 in Treated effluent increased by 4.56 % as effluents were 5,821,012 m3 in 2013 as compared to 6,086,615 m3 in The volume of water used internally for the treatment process in 2014 was 254,385 m3. This water is used in the process production for mixing chemicals, dilution of chemicals for pumping purposes, backwashing of filters and flushing pipes after sludge removal from process systems. Raw Water Quality The raw water quality for the past year has had lower turbidity and hardness in 2014 than what has been seen in recent years. The average raw water hardness for the winter months; January, February, March, October, November and December 2014, was 480 ppm. The raw water hardness average for the other six months was 356 ppm. The treated water average hardness was 238 ppm and 189 ppm for the respective periods. The 2014 yearly average hardness for Raw Water was 418 and Treated Water was 213 ppm. Turbidity peaks were coincident with the spring runoff, flooding and the draining of the Assiniboine River impoundment area in the fall. The Actiflo clarifier was able to reduce the high levels of turbidity to minimize the impact on the downstream treatment process. Removal of sand and silt from the north side of the river impoundment area was scheduled for late 2014 and is proceeding into 2015.
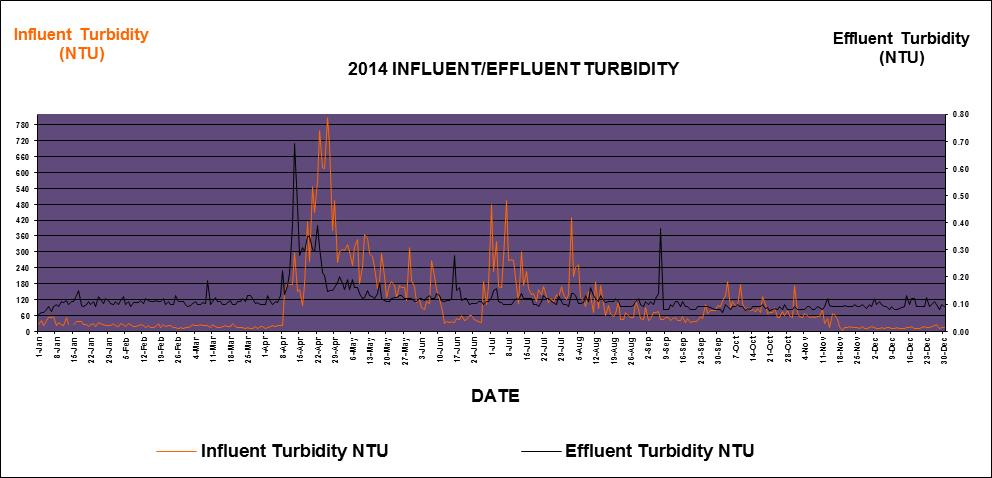
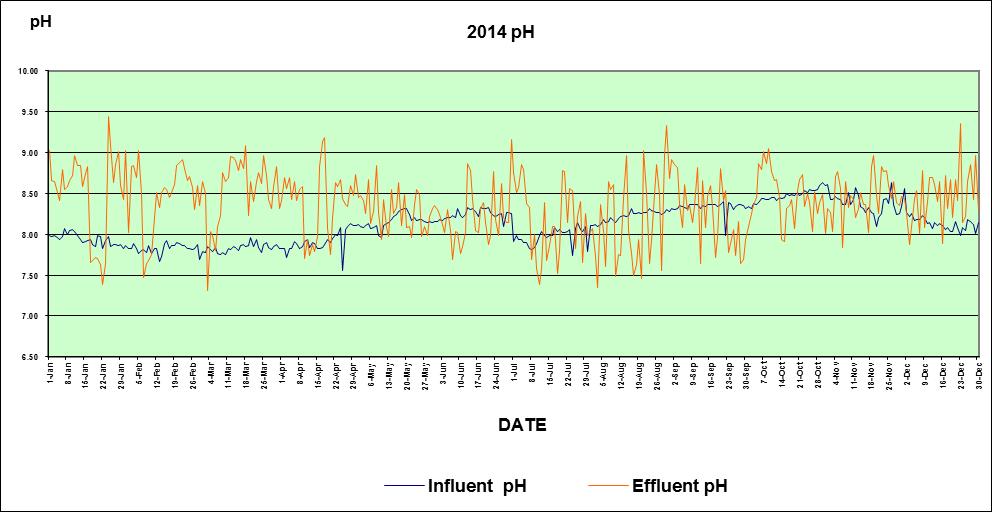
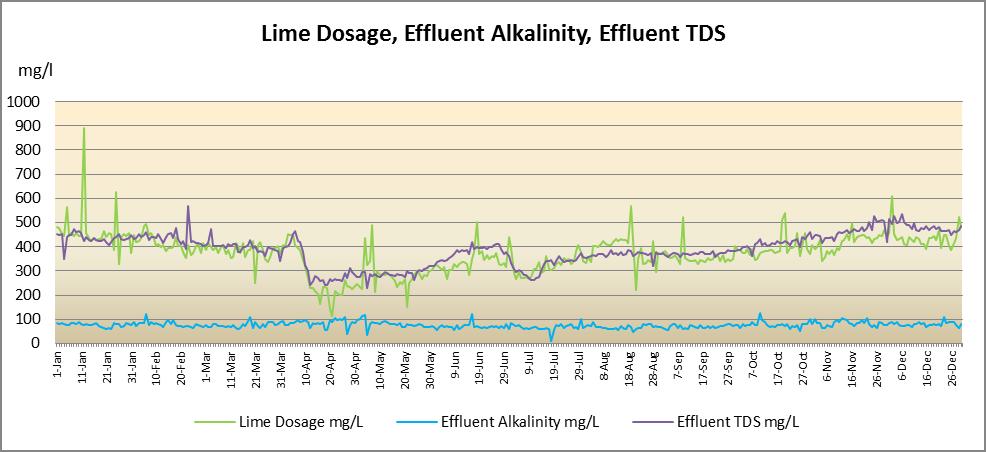
2 Operator overtime and shift changes were required during the spring runoff to service equipment around the clock to insure water production continued. The problems with the River impoundment area are being addressed by the Province and they are removing the silt and sand from the south side of the impoundment area. This will provide temporary reprieve from the excessive overtime requirements and pump damage as they plan to remove more sediment over the next few years. Distribution System Water Quality Distribution testing for 2014 was done on a weekly basis for Total Coliforms and Escherichia Coli. All Drinking Water Regulation treatment parameters were met. Metals sampling and testing was conducted on bi-monthly basis for the assessment of lead concentrations found in some household service lines. The samples were sent to an independent lab and all results forwarded, by the lab, to the Manitoba Water Stewardship Office of Drinking Water Officer for our area. The practice of running cold water for 2 to 3 minutes, following extended periods of non-use, and before consuming, is recommended for all homes with lead services. More information may be obtained from the City s web page. Water Quality Monitoring and Analyses The 2014 annual audit report from the Office of Drinking Water, as prepared by the Drinking Water Officer for the Portage la Prairie area, was submitted to the City in February Manitoba Water Stewardship and the City of Portage la Prairie will continue implementing testing changes at the Water Treatment Plant to enhance the water quality and will continue to work jointly with the local Drinking Water Officer. The attached graphs for the Hardness shows the Raw Water was lower than the seasonal trend from May to November. Lower hardness levels were prevalent during the year and the effluent hardness rose accordingly. The low levels of hardness are shown during the spring runoff also. The attached graph for the Turbidity shows the Raw Water peaks in the spring during run off and again in the fall during the river reservoir maintenance drain down for service work on the Dam. The effluent turbidity follows the yearly trend also. There were several peak turbidity events that followed rainfall entering the river flow. The graph for the effluent ph shows some peaks above 8.5 due to over-feed of sodium hydroxide. The raw water ph tends to follow seasonal trends for highs and lows and the effluent ph is adjusted with Sodium Hydroxide to maintain positive Langlier Index to prevent metal corrosion and metals from leaching into the water from too low of a ph. The Graph for Fluoride shows a consistent feed throughout the year. The test results are from the morning sample and represent the reading in the effluent water at that time and not as a daily average. Cost of chemical testing negates the continuous sampling over a 24 hour time line. The average level of Fluoride feed is 0.87 mg/l. A concentration of 0.70 mg/l has been deemed optimum by Health Canada. At present we are meeting the Tri-halomethane (THM) regulation for our drinking water. The taste and odor is removed by the activated carbon but shows higher levels of other total organic carbon (TOC) that could react with chlorine to form THM S. The graphs tend to
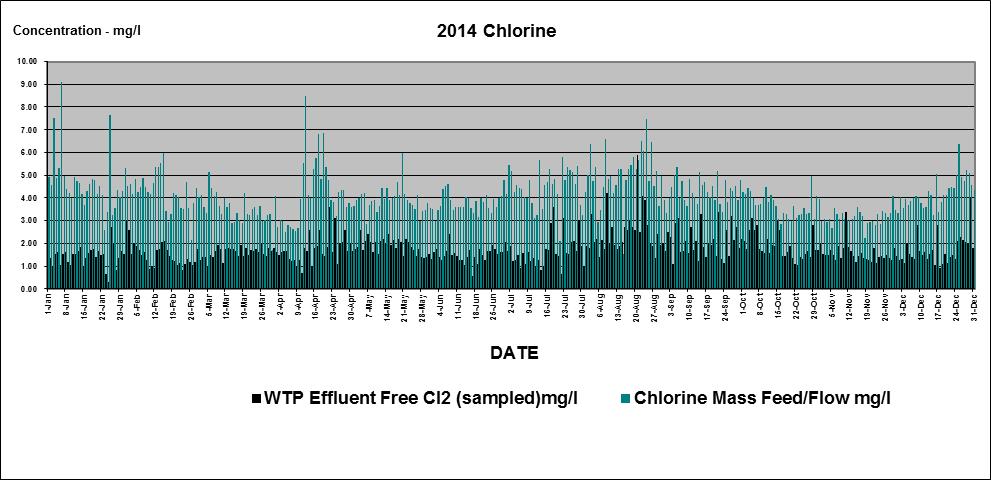
3 show a problem that might be in the chemistry of the raw water that could affect the Granular Activated Carbon (GAC) by shortening the effective life of the product. The effective removal of THM-forming compounds is limited. The expected life rating of the GAC media life is well below the original anticipated three years, but the replacement of the GAC media annually, or more frequently, would be cost prohibitive. Monitoring of the raw and treated water will continue in an effort to detect problems within the raw water that would cause this. Further studies with chemical treatment alternatives have continue in 2014 to help find a solution for the elevated THM s. The City of Portage la Prairie and AECOM Engineering will participate in the 2014 Water Quality Study to enhance the finished water product. Sodium Hydroxide and Soda Ash trials were conducted in 2014 and further fullscale testing is set to start in early February 2015 The graph for the chlorine feed shows higher free chlorine concentration in March due to component failure. The feed units were put on manual while the feed controller was sent out to be repaired. The effluent chlorine levels are higher as it enters the distribution system. Weekly sampling of the distribution areas for chlorine residual was done and samples sent to an independent lab for analyses and reporting to the Drinking Water Officer and Water Plant Management. All samples were shown to be free of Total Coliform and Escherichia Coli. Major Maintenance 31,000 kg of Anthracite (Filter Coal) media was added to the four duel media filters. Two pump motors at McKay Reservoir were rebuilt. Two new raw water pumps were installed at the raw water pumping station. Lime sludge holding pond has been cleaned, with approximate 25,000 m3 of sludge removed. New pump and VFD for Poplar Bluff Industrial Park were installed in the WTP Reservoir. Ongoing Water Quality Studies will result in better ways to treat the raw water so as to have a safer product for our consumers. The plant was kept in operation during maintenance work and plant shutdowns were done in a manner so as to keep the consumers supplied with water. Operating staff will continue to abide by all Government operational requirements and work with the local Drinking Water Officer to insure the best quality of water for all persons. City of Portage la Prairie Water Treatment Plant Annual Data Summary Influent Effluent Influent Effluent Influent Effluent WTP Effluent W.T.P. WTP Reservoir Reservoir Effluent Hardness Hardness Turbidity Turbidity ph ph Free Cl 2 Effluent Fluoride Influent Flow less process water ppm ppm NTU NTU (sampled)mg/l (Sampled) mg/l m3 m3 TOTAL ANNUAL 6,508,590 6,086,615 AVERAGE ,832 16,676 PEAK DAY ,490 22,337 90th PERCENTILE MEDIAN WINTER AVG SUMMER AVG
4
5
6
7

8