Review and Wrap-up. IEA Clean Coal Centre Members. John Topper, Director, CCT2009, Dresden. Japan Rep. of Korea. Italy. Poland.
|
|
|
- Gloria Griffith
- 5 years ago
- Views:
Transcription


1 Review and Wrap-up CEC BRICC Banpu ACIC Germany Arup Austria Canada Italy Japan Rep. of Korea UK Spain IEA Clean Coal Centre Members CANZ DPG SIG Suek BHEL Poland John Topper, Director, CCT2009, Dresden Eletrobras USA Anglo Coal ESKOM Netherlands Group BG Group Schlumberger
2 HEADLINES CCT 2007 Grandchildren to have electricity from coal through their lifetime Coal can be part of the portfolio of solutions to long term climate protection No single winning clean coal technology, but R & D worldwide is based on a core set of technologies Different policies in different regions = different technology pathways Many demos announced (but none for post combustion capture) Financial and regulation under development but a long way to go CCT 2009 Grandchildren to have electricity from coal through their lifetime Coal with CCS is indispensable in next decades Still no single winning clean coal technology. Research on 2 nd generation technologies underway Different policies in different regions = different technology pathways Demo intentions hardened, inc post combustion but action delayed by regulation and finance until very recently Regulation now becoming set in some major OECD countries. Finance still woefully inadequate.
3 World primary energy demand in the Reference Scenario: this is unsustainable! IEA WEO 2008 Mtoe Other renewables Hydro Nuclear Biomass Gas Coal Oil World energy demand expands by 45% between now and 2030 an average rate of increase of 1.6% per year with coal accounting for more than a third of the overall rise
4 The continuing importance of coal in world primary energy demand IEA WEO 2008 Mtoe % Increase in primary demand, % = average annual rate of growth 100% Shares of incremental energy demand Reference Scenario, Coal All other fuels % % % 2.6% 40% % 20% % Coal Oil Gas Renewables Nuclear 0% Non OECD Demand for coal has been growing faster than any other energy source & is projected to account for more than a third of incremental global energy demand to 2030 OECD
5 Making the best use of the EU s indigenous energy resources (Heinz Hilbrecht EC DG Tren, CCT2009) Clear objective for renewables, the EU's greatest potential source of indigenous energy Coal remains an essential component of EU s domestic energy supply as an important alternative to oil and gas 30 % of power generation is based on coal COM calls for all cost-effective measures to promote environmentally-compatible development of the EU s indigenous fossil fuels Technology is crucial; next step in the Strategic Energy Technology Plan to a Communication on Financing Low Carbon Technologies Long-term use of coal requires highly-efficient plants and wide availability of CCS
6 The Reference Scenario: World electricity generation IEA WEO 2008 TWh Coal Oil Gas Nuclear Hydro Biomass Wind Rest of renewables The shares of coal & renewables in the power generation fuel mix increase to 2030 mainly at the expense of natural gas & nuclear power
7 Global electricity generation (450 ppm Scenario) 100% 75% 18% 1% 1% 16% 15% 20% (1%) 9% 4% 5% 22% 40% Wind Hydrogen Other Renewables 50% 6% 18% 18% Biomass & Waste Hydro Nuclear Gas 25% 41% 2% Oil Coal 21% 0% World Energy Outlook 2008, IEA This is what adopting a 450ppm CO2 concentration means in terms of adjusted technology shares. Is it achievable?
8 CO2 emission reduction by key technologies Average worldwide gco2/kwh ~28.4% ~1110 gco2/kwh EU average ~36% ~880 gco2/kwh State of the art PC/IGCC ~42% ~740 gco2/kwh Advanced R&D ~48% ~665 gco2/kwh but deep cuts only by CCS adapted from VGB 2007; efficiency HHV,net <2020 Energy Efficiency makes big change but deep cuts of CO2 emission can be done only by Carbon Capture and Storage (CCS)
9 Major Developments since 2007

10 E On 50% efficient plant 50 plus by using new materials Location Efficiency Capacity Investment Start of operation Wilhelmshaven 50 % 500 MW e 1 billion Size of plant Search for location Material development Request for proposal Construction Start of operation

11 China s 1 st Post Combustion CO2 Capture Pilot Plant The design parameters are: Flue gas flow to unit Nm3/h Steam consumption 3GJ/tonne CO2 Solvent consumption < 1.35 kg/tonne CO2 Owners: Huaneng CSIRO assisted


12 Vattenfall s 30 MWth oxy fuel carbon capture unit

13 Green Gen The first Chinese IGCC with CO2 capture Near Tiajin, southeast of Beijing. The first phase of GreenGen is expected on line in 2009, generating 250MWe, expanding to 650 megawatts in later phases. nd phase with CO2 capture
14 OECD roadmapping example of PCC Current position (2009) Post-2030 COMMERCIAL USC TO MPa/600 C/620 C 46% NET, LHV, BITUM COALS, INLAND, EU, EVAP TOWER COOLING, (44%, HHV). ON HIGH MOISTURE LIGNITE 43% NET, LHV, SIMILAR CONDITIONS (37%, HHV) Emissions on bitum coals: Particulates 5-10 mg/m 3 SO 2 <20 mg/m 3 NOx mg/m 3 dry systems can give lower emissions COMMERCIAL USC TO MPa/600 C/620 C R&D, PILOT TESTS Materials, cycles CO 2 capture COMMERCIAL USC TO MPa/600 C/620 C 700 C DEMOS R&D materials Sidestream CCS FULL FLOW CCS DEMOS ON USC 600 C PLANTS COMMERCIAL USC TO 35 MPa/700 C/720 C R&D Materials Novel post-comb Oxy-coal materials 700 C ADVANCED FULL FLOW CCS DEMOS (scrubbing only for 700 C technology) COMMERCIAL CCS USC TO 35 MPa/700 C/720 C (scrubbing only for 700 C technology) COMMERCIAL OXY- COAL USC TO 30 MPa/600 C/620 C OXY-COAL CCS DEMO 700 C TECHNOLOGY R&D Oxy-coal materials >700 C COMMERCIAL CCS USC TO 35 MPa/700 C/720 C ALL CAPTURE SYSTEMS >700 C/>720 C DEMOS ALL WITH CCS, VARIOUS TYPES R&D materials COMMERCIAL CCS USC ROUTINELY BEYOND 35MPa/700 C/720 C ALL CAPTURE SYSTEMS ALL COALS, ALL FIRING CONFIGURATIONS 45%+ NET, LHV, INC CO 2 CAPTURE, ALL COALS Near-zero emissions all coals: Particulates <1 mg/m 3 SO 2 <10 mg/m 3 NOx <10 mg/m 3 99% mercury removal 90% CO 2 capture Emissions on all coals: Particulates 1 mg/m 3 SO 2 10 mg/m 3 NOx 10 mg/m 3 90% mercury removal
15 OECD roadmapping example of IGCC Current position (2009) Post DEMOS/EX- DEMOS OPERATE, MWe VARIOUS ENTRAINED GASIFIERS ON VARIOUS COALS 600 MWe COMMERCIAL PLANTS UNDER CONSTRUCTION. HIGHER CAP. COST THAN PCC BUT COST W. CAPTURE COMPETITIVE % NET, LHV, 46% NEW PLANTS (LATEST F-TURBINES) ON BITUMINOUS COALS Emissions: Particulates <1 mg/m 3 SO 2 <20 mg/m 3 NOx <50 mg/m 3 ; SCR will allow lower levels Mercury capture demonstrated CONSTRUCT COMMERCIAL PLANTS WITH LATEST F AND W TURBINES R&D AND PILOT REDUCE CAP COST INCREASE AVAILABILITY EXTEND RANGE OF COALS GAS TURBINE DEVELOPMENTS OPTIMISE IGCC BLOCKS DEVELOPMENT OF DRY SYNGAS CLEANING NON-CRYOGENIC AIR SEPARATION, e.g. ITM 85% AVAILABILITY COMMERCIAL PLANTS WITH LATEST F- AND W-CLASS GTs. SOME WITH PARTIAL CAPTURE COMMERCIAL OP OF NEW WATER QUENCH GASIFIERS PROVE ABOVE OPERATE ON HIGH HYDROGEN FUELS WITH SATISFACTORY NOx EMISSIONS SO CAPTURE COMPATIBLE REDUCE COST EXTEND RANGE OF COALS ITM DEMO ON IGCC (PARTIAL FLOW) DEMOS OF HGCU SIDESTREAM GAS CU+FUEL CELL FULL FLOW PRE- COMB CCS DEMOS USING SHIFT+SCRUBBING HGH AVAILABILITY COMMERCIAL PLANTS OPERATING WITH LATEST F- AND W- CLASS GTs VARIOUS GASIFIER TYPES DEVELOP H-CLASS IGCC GT DEVELOP GT FOR ITM CYCLES DEVELOP NOVEL GASIFIER DESIGNS NEW POWER CYCLES PILOT GAS CLEANING+ FUEL CELLS TESTS DEMONSTRATE NON-CRYOGENIC AIR SEPARATION ADVANCED CCS DEMOS COMMERCIAL PLANTS OPERATING WITH H- GTs ABLE TO BURN HIGH HYDROGEN FULL CO 2 CAPTURE AVAILABLE CAPITAL COST COMPARABLE WITH PCC FOR NON-CAPTURE SYSTEMS EFFICIENCY 50%+ LHV BASIS ON ALL COALS (NO CO 2 CAPTURE) DEMONSTRATE ITM OXYGEN SUPPLY IN IGCC SLIPSTREAM TEST OF FUEL CELL ON ULTRA-CLEAN SYNGAS Emissions: Particulates 0.1 mg/m 3 Emissions of SO 2 and NOx <10 mg/m 3 90% mercury removal 90% AVAILABILITY COMMERCIAL IGCC WITH H-CLASS GTSs WITH ULTRA-LOW NOx ON HYDROGEN FUEL COMMERCIAL SCALE DEMO OF DRY GAS CLEANUP DEMONSTRATE ITM O 2 IN IGCC WITH ITM-OPTIMISED GT DEVELOP CO 2 GTs DEMONSTRATE LARGE FUEL CELLS ON SYNGAS DEMONSTRATE ULTRA-DEEP SYNGAS CLEANING FOR FUEL CELLS CO 2 CAPTURE AS STANDARD USING GAS SEPARATION MEMBRANES CAPITAL COST LOWER THAN PCC WITH CCS 45%+, LHV, INC CO 2 CAPTURE, ALL COALS ITM OXYGEN AS STANDARD WITH ITM- OPTIMISED H 2 GT DRY GAS CU INCL MERCURY FUEL CELLS IN SOME PLANTS EVENTUALLY OTHER SYSTEMS WITH CO 2 GTs CO 2/H 2O GTs Near-zero emissions, all coals: Particulates 0.1 mg/m 3 SO 2 <10 mg/m 3 NOx <10 mg/m 3 99% mercury removal


16 Largest CO2 Storage Projects Courtesy IEA GHG Snohvit capturing and injecting 0.7Mt/y CO2 since 2008 Rangeley injecting 0.8 Mt/y CO2 since 1980 s Sleipner capturing and injecting 1Mt/y CO2 since 1996 Weyburn capturing and injecting 1.6 Mt/y CO2 since 2000 In-Salah capturing and injecting 0.8 Mt/y CO2 since 2004

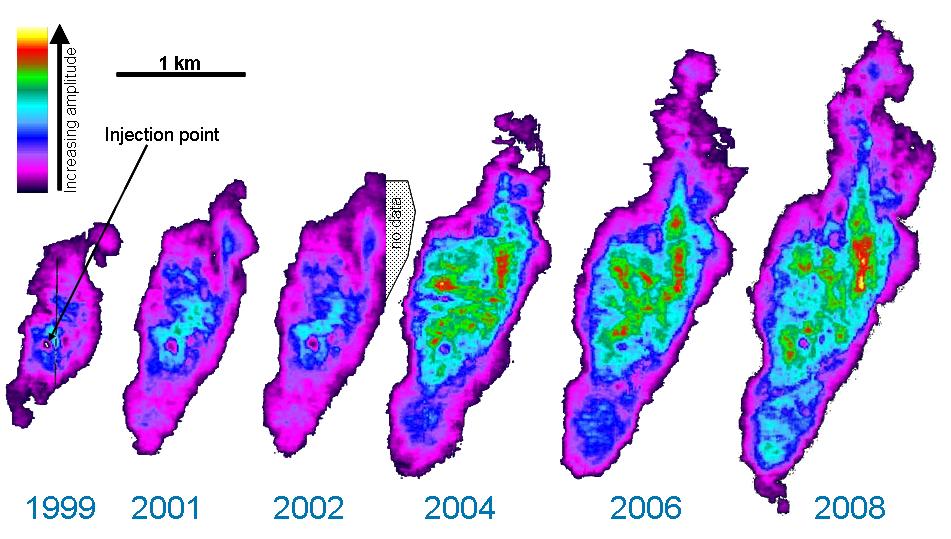
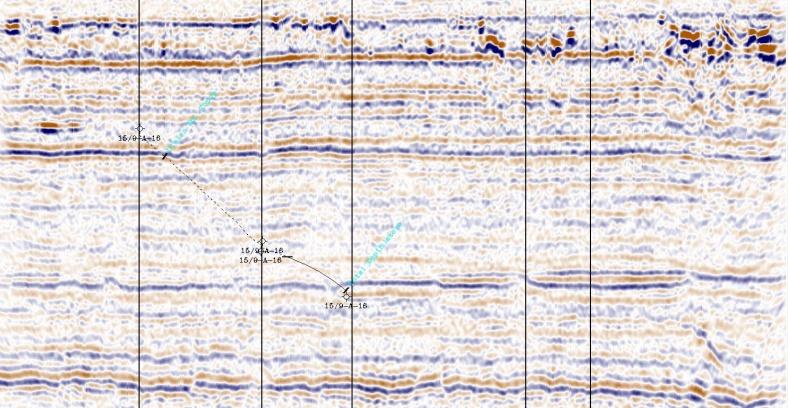
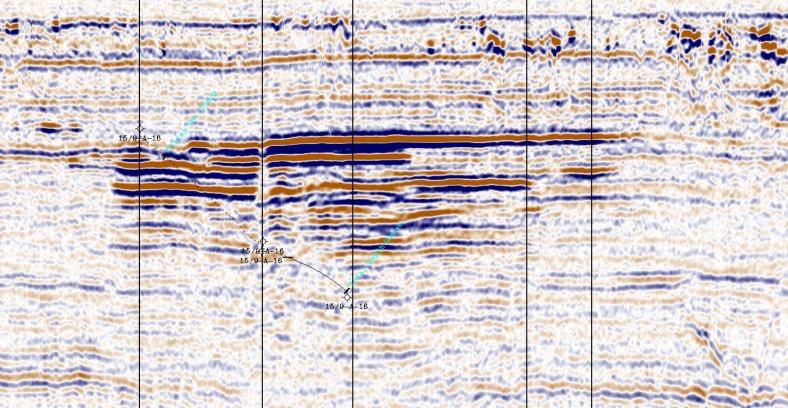

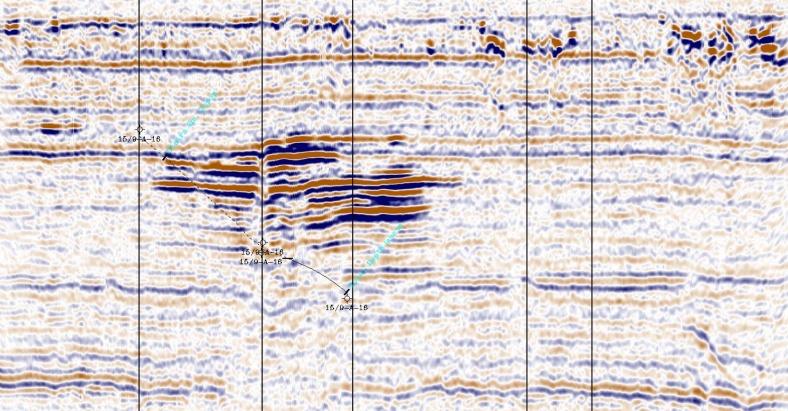
17 Sleipner CO2 injection Time-lapse seismic data Utsira Fm. CO wel 2 l CO2 plume in map view
18 Non-Technical Issues Regulation advancing now onto statute books Permitting may run into opposition regarding storage public attitudes are the next most crucial hurdle Finance starting to flow but sporadic STILL NO INTEGRATED CCS DEMO on COAL will we be closer by CCT2011? Will we meet the 20/20/20 target?
19 CLOSING COMMENTS & THANKS
20 CCT 2009 What did we cover? (almost 400 of us and about 150 papers) Keynotes: Position of German Government on continued need for coal use Continued extensive use of coal inevitable but with CCS after 2020 Energy security and clean coal needed with CCS Data on CO2 storage is becoming more, better and convincing Key role of materials Industry view from Siemens on application of IGCC and post combustion Technical topics Coal gasification many aspects Carbon capture many aspects with a lot on oxy fuel Coal to Liquids Combustion and Chemical Looping Co-utilisation of Coal and Biomass; Underground Coal Gasification Programmes and regional perspectives THANKS TO AUTHORS, SPEAKERS & CHAIRS
21 What did we Achieve? Contributing to the Agenda for Coal which now extends right into the highest reaches of national and international policies Influencing and reinforcing messages on the urgency & importance of RD & D for both short term improvements and the long term drive towards a carbon free power plant Almost 400 people came here, over 30 countries Coverage of coal utilisation: o Policy and emerging none technical barriers o Long term technology development o Short-medium term technology needs o Coal Science Superb networking in a friendly atmosphere
22 Thanks to Sponsors and Supporters and Organisers Thanks to FEDERAL MINISTRY OF ECONOMICS AND TECHNOLOGY who gave their patronage FORSCHUNGSZENTRUM JUELICH and the INSTITUTE of ENERGY PROCESSING ENGINEERING and CHEMICAL ENGINEERING at TU BERKAKADAMIE FREIBERG who organised the conference alongside staff of IEA CLEAN COAL CENTRE TECHNICAL UNIVERSITY OF DRESDEN for further support VATTENFALL FREISTSAAT SACHSEN RWE VGB SIEMENS Who all sponsored the conference
 Average 17 ºC Maximum 23 ºC Minimum 11 C Humidity 56 %.")
23 CCT 2011 in ZARAGOZA, SPAIN May 2011 Zaragoza is the capital of the region of Aragon. Population , ranking fifth in Spain. Weather average (May) Average 17 ºC Maximum 23 ºC Minimum 11 C Humidity 56 %. Precipitation: 44 mm
24 Instituto de Carboquima (ICB) to organize the 2011 Clean Coal Technology - on behalf the Spanish Carbon Group -

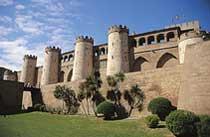
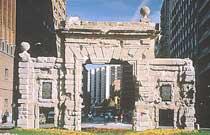

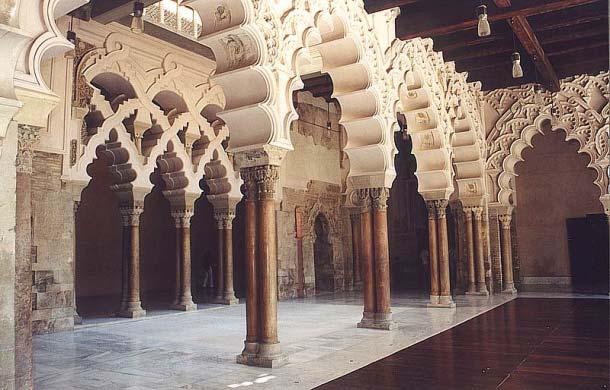
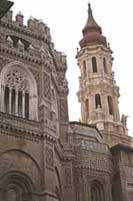
25 Zaragoza - Tourist Information
26 FAREWELL Until the next time CCT Zaragoza Enjoy the Technical Visits Travel home safely!