ON THE FLOOD AND INUNDATION MANAGEMENT OF HO CHI MINH CITY, VIET NAM
|
|
|
- Kerrie McCormick
- 5 years ago
- Views:
Transcription


1 ON THE FLOOD AND INUNDATION MANAGEMENT OF HO CHI MINH CITY, VIET NAM Ruben Dahm, Ferdinand Diermanse, Ho Long Phi Exeter, United Kingdom. September 5 th, 2013


2 Ho Chi Minh City, the economic capital of Viet Nam experiences (urban) flood events annually Tidal flooding in Binh Tanh district, November 2011.

 Ho Chi Minh City: Accounts for 23% of GDP and 20% of foreign direct investments.")
3 Increasing Ho Chi Minh City s flood resilience Viet Nam: Within the top five of countries potentially most affected by climate change. (Daspugta et al., 2008) Ho Chi Minh City: Ranked within the top ten cities world wide in terms of exposed population affected by climate change. (Nicholls et al., 2008) Ho Chi Minh City: Accounts for 23% of GDP and 20% of foreign direct investments. (ADB, 2010) Frequent flooding hampers the fast development of HCMC. Increasing HCMC s flood resilience is eminent.

4 Study area of the FIM-project
 -")
 - Land subsidence (forecast 2025, 2050)")

5 Flood risk reduction with measures 4 Strategies - Reference - MARD-plan (12 gates, 172 km embankment) - MARD-variant - Soai Rap barrier 4 Scenario s - Urban Planning (2025) - Land subsidence (forecast 2025, 2050) - Climate Change (SLR, rain) - Control level gates 4 reference years: 2010, 2025, 2050, 2100 Land subsidence 2025 forecast
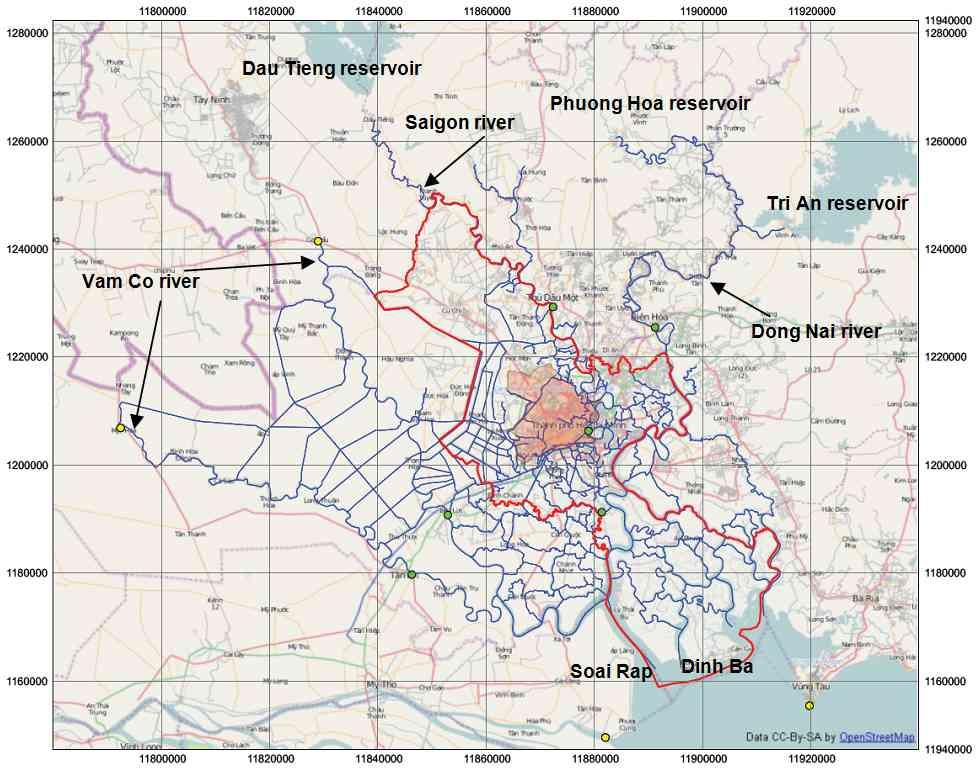
6 Threats / forcing factors Three large rivers Intense rainfall on the city Saigon Rain Dong Nai High tides Vam Co sea level

7 Need for probabilistic risk analysis 265 communities Set of measures (ADB, 2009) Saigon Rain Dong Nai 241 communities Vam Co We developed a framework for probabilistic analysis to assess flood hazards of all combinations, i.e. strategies, scenarios, reference years. sea level
8 Probabilistic model setup Rainfall Discharges Dong Nai Saigon Vam Co Hydrodynamic model HCMC Water levels and Inundation depths measure damage Sea level
9 Some challenges in the risk modelling 350 Seasonal paterrn 10 Large number of threats Seasonal variation of risk Statistics for extremes and regular events Correlation between river discharges Different time scales (river vs sea) Rainfall (mm/month) Rainfall Sea Water level Jan Feb Mar Apr May Jun Jul Aug Sep Oct Nov Dec Month month: Jun Sea water level (cm+ref) Non-stationary input series (sea level) Meteo frequency of exceedance (days per month) observed extreme value analysis combined
10 Forcing statistics: sea level annual maximum water levels for station: Vam Kenh data fit annual maximum water levels for station: Vam Kenh data fit tidal level [cm+ref] cm tidal level [cm+ref] cm return period [years] GEV-fit of the observed water level at station Vam Kenh return period [years] GEV-fit of the detrended water level at station Vam Kenh Detrending increases the 10yr tidal level with 7cm
11 Forcing statistics: rainfall, monthly pattern 350 Seasonal paterrn 10 Rainfall (mm/month) Rainfall Sea Water level Sea water level (cm+ref) Jan Feb Mar Apr May Jun Jul Aug Sep Oct Nov Dec -45 Month - Flood risk varies per month - Different for rainfall and sea water level - This needs to be taken into account in the simulations

12 Combining forcing variables Bien Hoa water level local water level influenced by 2 variables: river discharge and sea water level River discharge Sea water level
13 Selected method: numerical integration X-variables: - Rainfall - Sea water level - Saigon river discharge - Vam Co river discharge - Dong Nai river discharge
14 Selected method: numerical integration -Each grid cell represents a combination of realisations of the 5 X-variables: - each grid cell can be seen as an event - for each event/grid cell, a numerical model run is carried out to determine flood levels model runs for 1 case

15 Hydrodynamic and hydrologic model Sobek model set up Catchment area ~2100 km 2 > km of rivers, channels, and drains Hydrological processes schematized with NAM
16 Multiple batch runs: database with model results Current situation Measure 1 Measure 2 Subsidence scenario Event/Run 1 Event/Run 1 Event/Run 1 Event/Run 1 Event/Run 2 Event/Run 2 Event/Run 2 Event/Run 2 Event/Run N Event/Run N Event/Run N Event/Run N N=2016
17 Multi-Criteria analysis Multi-Criteria analysis criteria: Technical and hydraulic performance Environmental impacts Socio-economic impacts Costs and benefits
18 Conclusions A successful application of the probabilistic framework for flood hazard and risk assessment of flood management strategies for HCMC. The frameworks results support the selection of a preferred flood management strategy to increase HCMC s flood resilience. The probabilistic nature of the framework enables the quantification of expected annual damage. Mitigating measures could be compared with expected annual damage reduction as various strategies assessed with the model. The framework has specific added value for deltaic areas, where multiple flood forcing factors interact.