Adaptation to Change with No
|
|
|
- Ariel Cain
- 5 years ago
- Views:
Transcription
1 Adaptation to Change with No Adverse Impact Exploring the Green River Valley Achieving No Adverse Impact By Bob Freitag CFM Director of Institute for Hazards Mitigation (UW)
2 Originally published on Tuesday, December 23, cartoon Printer-friendly
3
4
5 FLOODING A number of flooding Certain configurations of disasters occurred the jet stream can produce almost simultaneously flooding nearly around the World in simultaneously in different parts of the World, as well as Nor easters and Oceans. Flooding = Damage
6


7 RISK / (OPPORTUNITY) ASSESSMENT HAZARD/Change Impacts Capabilities RISK ACCEPTABLE RISK UNACCEPTABLE RISK RISK REDUCTION / OPPORTUNITY ENHANSEMENT POLICY OPTIONS Natural Environment - Climate - Biology - Geology Built Environment - Structures - Infrastructure Systems PREVENTION/MITIGATION PREPAREDNESS EMERGENCY RESPONSE RECOVERY and RECONSTRUCTION


8 Green River Case study
9 Six Step Process 1. What values or assets do you want to protect or enhance? 2. What are the apparent risks or opportunities for enhancement? 3. What is the range of risk reduction or opportunityenhancement strategies available? 4. How well does each strategy t reduce the risk or enhance the resource? 5. What other risks or benefits does each strategy introduce? 6. Are the costs imposed by each strategy too high?


10 1. What values or assets do you want to protect tor enhance? Livable safe communities
11 Six Step Process 1. What values or assets do you want to protect or enhance? 2. What are the apparent risks or opportunities for enhancement? 3. What is the range of risk reduction or opportunityenhancement strategies available? 4. How well does each strategy t reduce the risk or enhance the resource? 5. What other risks or benefits does each strategy introduce? 6. Are the costs imposed by each strategy too high?


 Discharge")


12 2. What are the apparent risks or opportunities for enhancement a. Wt Water hazards (Changes) Discharge too great for Dam or levees to contained b. Impacts to values and assets Damage to man made environment Damage to natrual environment Systems interruption Systems interruption c. Capabilities Inadequate approaches and tools
13
14 2. What are the apparent risks or opportunities for enhancement
15 Corp s Strategy 1. Strengthen Dam to store over 100,000 acre feet, converting large storm flows to a flow at the Auburn flow gage equivalent to the 2 year pre dam event 12,000 cubic feet per second (cfs). 2. Strengthen levee system such that the capacityof the leveed portion of the river is approximately 12,800 cfs, with approximately 2 feet of freeboard in most locations 3. Provide incentives for so that floodprone Communities can accept flooding with no damage. (extreme events, failure of damorlevees )
16 Green River Scenario Changes: Impacts: Capabilities: Frequency: 25% chance of 17,600 cfs release from Howard Hansen Dam each Winter flood season for the next 3 years. Location/severity: See inundation maps Timing: i 24 hours warning Flood lasts for 16 hours Water stands for 5 days Opportunities Floodprone areas not fully developed Market forces will result in redevelopment Change in how land owners view flooding Build environment $3.75 billion of economic losses, 170 substantially damage buildings 21,000 people displaced, and 280,000 tons of debris generated. td Levee fail. fil Natural environment Land slides occur Pollutants flow into the Sound river degradation/salmon runs lost Approaches Strengthen levees and dam Exploit storage opportunities Create safe to fail system Tools: NFIP/ Biological Opinion Insurance (excess coverage USACE advanced measures Businesses / home owners informed of Contingency Planning needs. Purchase / transfer development rights Systems Purchase / transfer
17 Water Hazards / Changes: Discharge Functions of: 1. Rivers 2. Watersheds 3. Floodplains 4. Land cover / land use 5. Dams 6. Levees
18 What does a river do functions (represents a risk / opportunity) Transports sediment Drains the watershed Provides fresh water supply. Transports chemicals and nutrients Provides Energy Provides habitat for living things.
19 What does a Watershed do functions (represents a risk / opportunity) Manufactures, stores, releases sediment Stores (retention), processes, discharges water Manufactures, stores releases chemicals and nutrients Stores and releases energy Provides habitat for us and other living things.
20 What is a Floodplain functions (represents a risk / opportunity) Stores, regulates sediment transport Regulates water flow (detention, recharge) Manufactures, processes, releases chemicals and nutrients Stores Energy Provides habitat for us and other living things. (flat land)
21 What is a Dam functions (represents a risk / opportunity) Changes the sediment transport Changes floodplain functions Controls fresh water supply. Controls flood frequency and severity Changes the transporting chemicals and nutrients Stores Energy
22 What is a Levee functions (represents a risk / opportunity) Changes sediment transport Contains discharge Changes floodplain functions Changes chemicals and nutrients transport mechanisms Directs energy to the channel Alters flood frequency
23 Water Hazards / Changes: Land cover / land use functions Population growth as a Hazard: Change agent
24 Water Hazards / Changes: Land cover / land use functions


25 Water Hazards / Changes: Land cover / land use functions


")

26 Water Hazards / Changes: Climate (extreme events)
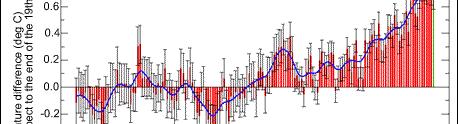
27 UNITED NATIONS: Rising frequency of natural disasters feeds economic insecurity it report (07/02/2008) "Although the socio economic impact of climate change is the subject of ongoing g research, there is broad agreement that, with rising temperatures and ocean levels, longer and more severe dry periods will be experienced in some already drought prone areas, and more intense rainfall can be expected in some already flood prone and coastal areas
28 Projected Flows Rivers draining the Cascades
29 The average snow water equivalent observed at six USDA Snotel stations in the North Cascades on April 1 has declined 26% over the last 60 years. During this same interval winter precipitation has not declined, d see below. Thus, this change in snowpack is due to more winter melting and more frequent winter rain events.
30 Historic Flow Rivers draining the Cascades


31 Projected flows 2060 Rivers draining the Cascades


32 Projected flows 2060 Reduced Microbial Activity


33 Study: Antarctic ice sheet is shrinking "faster than we thought," said Jane Ferrigno, a U.S. Geological Survey geologist and polar-ice expert.


34 Risks and Opportunities Secondary Hazards/Changes


35 Risks and Opportunities Secondary Hazards/Changes
36 Six Step Process 1. What values or assets do you want to protect or enhance? 2. What are the apparent risks or opportunities for enhancement? 3. What is the range of risk reduction or opportunityenhancement strategies available? 4. How well does each strategy t reduce the risk or enhance the resource? 5. What other risks or benefits does each strategy introduce? 6. Are the costs imposed by each strategy too high?
37 3. What is the range of risk reduction or opportunity enhancement strategies available? a. Water hazards (Changes) Retain / detain in upper, middle and lower watershed d/ floodplain l and channel. Climate (extreme events) b. Impacts to values and assets Create flood resilient built environment c. Capabilities Strengthen levees and dam Create balanced safe to fail system


")


 b.")


38 3. What is the range of risk reduction or opportunity enhancement strategies available? a. Water hazards (Changes) Retain / detain in upper, middle and lower watershed d/ floodplain l and channel. Climate (extreme events) b. Impacts to values and assets Create flood resilient built environment c. Capabilities Strengthen levees and dam Create balanced safe to fail system
39


")


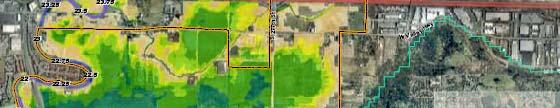
40 Green River Simulated Water Depths Maps (13,900 cfs) Green River Simulated Water Depths Maps (17,600 cfs) Green River Simulated Water Depths Maps (25,000 cfs)


41 13,900 cfs at Auburn 19,000 cfs at Auburn 25,000 cfs at Auburn
42 Example: Reduce damageable built environment Damage to Built Environment Where most damage occurs. Discharge above green line discharge of concern (look for on or near channel detention; increased upstream retention, friction, wetlands. use of swales and other depressions..)


43 Storing Water within higher watershed

44 Wolves Elk: the primary prey of wolves. Many fear that wolves will decimate the Yellowstone elk population. Source: Oregon State University The gray wolf. The Yellowstone wolves were removed in 1926 and reintroduced in Source: Oregon State University.


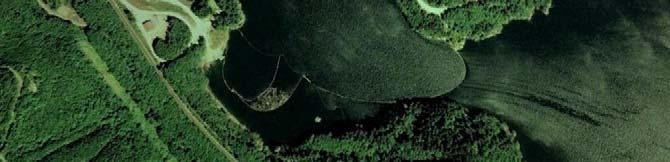
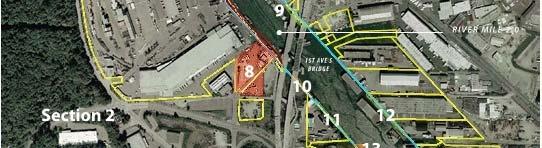
45 Storing Water within higher watershed Beavers reintroduced No Beavers

46 Dam Types Beaver dams Check dams Timber dams Portadam Earthen dams Reinforced Concrete dam
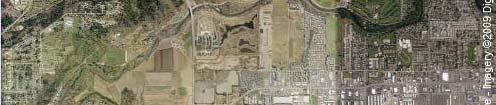
47 Site Overview Map Little Eagle Lake dam Howard Hanson Dam Eagle Lake dam Beaverda m Lake dam Green River dam #1 Green River dam #2 Total Storage Gained: acre-feet or ~ 8% of Required Peak Flow Reduction to Prevent Flooding


48


49 Little Eagle Lake Dam (5 foot impoundment, 69.0acre feet storage) Cost: $-$$ Ownership: Private Storage Capacity: Medium-High Height: Low Env. Impact: Low to Medium Enhancement Opp s: Medium to High Design Life: Med. Dam Types Recommended: Beaver dam


50 Eagle Lake Dam (10 foot impoundment, 10.0Acre feet storage) Cost: $-$$ Ownership: Private Storage Capacity: Low Height: Low- Med Env. Impact: Low to Medium Enhancement Opp s: Medium Design Life: Low Dam Types Recommended: P t d


51 Beaverdam Lake Dam (5( foot impoundment, 5.9 acre feet storage) g) Cost: $-$$ Ownership: Public Storage Capacity: Low Height: Low Env. Impact: Low to Medium Enhancement Opp s: Medium Design Life: Med Dam Types Recommended: Beaver Dam


52 Green River Dam #2 (20( foot impoundment, acre feet storage) g) Cost: $$-$$$ Ownership: Public Storage Capacity: High Height: High Env. Impact: Med to High Enhancement Opp s: Medium Design Life: Long Dam Types Recommended: Earthen Dam


53 Storing Water within middle and lower watershed / floodplain Developed flood friendly environment to: accommodate : criticalstorage areas low impact development flooding
54 Setback Levee Example Bioengineered Narita Levee Four Years Later Source: King County

55


56


57 Lower Green River Duwamish


58 Floodprone areas not fully developed Market forces will result in redevelopment Change in how land owners view flooding Risks /Opportunities
59 Capabilities (Risk/Opportunity) Approaches: Strengthen levees and dam Exploit storage opportunities Create balanced safe to fail system Tools: NFIP/ Biological Opinion Insurance (excess coverage) USACE advanced measures Businesses / home owners informed of Contingency Planning needs. Purchase / transfer development rights


60 Live with flooding
61 Strategies for the higher Watershed:
62 Strategies for the middle Watershed:
63 Strategies for the lower Watershed:
64 Six Step Process 1. What values or assets do you want to protect or enhance? 2. What are the apparent risks or opportunities for enhancement? 3. What is the range of risk reduction or opportunityenhancement strategies available? 4. How well does each strategy t reduce the risk ikor enhance the resource? 5. What other risks or benefits does each strategy introduce? 6. Are the costs imposed by each strategy too high?


65 Questions and Answers