Introduction to transmission network characteristics - technical features. Slobodan Markovic Danka Todorovic EKC Athens,
|
|
|
- Elijah McKinney
- 5 years ago
- Views:
Transcription

1 Introduction to transmission network characteristics - technical features Slobodan Markovic Danka Todorovic EKC Athens,
2 Interconnectors An interconnector is a structure which enables energy to flow between the transmission network A greater level of interconnection provides a greater diversity of potential supplies as well as facilitating competition in the open electricity market and assisting the transition to a low carbon energy sector by integrating various renewable sources. Increased interconnection between the TSOs can help with intermittency issues posed by renewable (mainly wind) generation and so aid and support electricity security of supply. More interconnectors provide a potentially attractive investment for new generation/consumer investors, because of higher security and reliability margin of the transmission networks Electricity market liberalization presents a combination of opportunities, challenges, and risks for interconnection project 2
3 Interconnectors Why Interconnectors? Development of cross-border electricity trade in the region requires that the development of the transmission infrastructure take place through the extension and strengthening of the interconnection of power systems with the purpose of sales and exchanges of electricity. Some borders between the countries are already congested due to the scarce interconnection capacities and trading increase, while on the other hand some countries have not even been interconnected yet. The construction of the new interconnectors, have been recognized as a public good for the consumers Such projects has been considered in a wider context of integration of the neighbouring TSOs aimed at improving the exchange of energy and acting in favour of Energy Market development 3
4 Interconnectors Potential benefits of grid interconnections Improving reliability and pooling reserves Reduced investment in generating capacity Improving load factor and increasing load diversity Economies of scale in new construction Diversity of generation mix and supply security Economic exchange Environmental dispatch and new plant siting Coordination of maintenance schedules 4
5 Interconnectors Potential benefits of grid interconnections Development of cross-border electricity trade in the region requires that the development of the transmission infrastructure take place through the extension and strengthening of the interconnection of power systems with the purpose of sales and exchanges of electricity. Some borders between the countries are already congested due to the scarce interconnection capacities and trading increase, while on the other hand some countries have not even been interconnected yet. The construction of the new interconnectors, have been recognized as a public good for the consumers Such projects has been considered in a wider context of integration of the neighbouring TSOs aimed at improving the exchange of energy and acting in favour of Energy Market development 5
6 Interconnectors Impact of the interconnections on electricity exchanges Loop and parallel path flows (power flows do not necessarily follow a specified transmission path) Transit increase (who will cover transit costs ITC?)! Losses increase/decrease! NTC/GTC increase! Market coupling! 6

7 New OHL 400 kv Romania-Bulgaria* Cross-border trading across the new OHL 400 kv *No congestions in operational practice 7
8 Benefit Categories and Required Type of Analysis BENEFIT CATEGORIES: B1 Improved security of supply Network-based Expected Energy Not Supplied (EENS) Security analyses (n-1) ANALYSES Market-based B2 Socio-economic welfare (SEW) B3 RES integration B5 Variation in CO2 emissions GTC calculation Potential change of GTC (NTC) at borders with RO and BG Market modelling (considering delta GTC): - market welfare - (increased) RES production - (decreased) CO2 emission B4 Variation in losses (energy efficiency) Load flow Calculation of DLosses B6 Technical resilience/system safety Security analyses combined with maintenance (n-1-1) B7 Flexibility Risk analysis of dependence of Romania-Bulgaria project with other related projects 8
9 Benefit Categories and Required Type of Analysis Technical resilience - Security (n-1) analysis - Security (n-1) analysis with maintenance (n-1-1) - PV analysis Robustness/Flexibility - Uncertain development of transmission reinforcements - Contrasting power system development Transmission losses - Evaluation of variation in losses Security of supply - Evaluation of ability to provide secure supply of electricity Grid Transfer Capability - Effect of increasing GTC across boundary (B2) -? GTC New Element B1 - Security of Supply IV B6 - Technical Resilience III II I + Better performance B7 - Robustness/Flexibility B4 - Transmission Losses 9


10 Power Balances in Network models 2025 &
 Djerdap (RS) for outage of 400 kv line Tantareni (RO) Slatina (RO) - 400 kv Ch.")
11 Security of Supply B1 (n-1) Analysis In Winter peak 2025 base case exchanges are kv Portile de Fier (RO) Djerdap (RS) for outage of 400 kv line Tantareni (RO) Slatina (RO) Limiting network elements in Winter peak 2025 are: kv Portile de Fier (RO) Djerdap (RS) for outage of 400 kv line Tantareni (RO) Slatina (RO) kv Ch.Mogila (BG) Stip (MK) for several outages In all regimes in 2025 and 2030 security (n-1) criterion is satisfied i.e. there are no overloads with the New Interconnection. 11
12 Security of Supply B1 PV Analysis 2025/2030 PV analysis has shown that voltage stability of observed SS was preserved for power transfers above 3500 MW for the base case and the new topology variant New topology variant has positive effect on voltage stability 12

13 Security of Supply B1 Expected Energy Not Supplied Winter max 2025 Winter max
14 Security of Supply B1 S Expected Energy Not Supplied EENS is calculated for the topology scenarios defined to evaluate variations between calculated EENS value for the respective scenario and the level of EENS in the base case topology Results showed that variation in EENS compared to base case topology is not significant for all scenarios of the New Interconnection (2.9 GWh/year in BG; 1.9 GWh/year in RO) Loss of load or load curtailments due to overloads happen in 110 kv network and New Interconnection does not influence problematic parts of the 110 kv network and does not improve Security of supply in any of the analyzed countries 14
15 Variation of Transmission Losses B4 Network losses are presented on yearly level (GWh) based on losses in MW calculated for: - 2 peak regimes - equivalent losses duration time of the respective loads in these regimes Equivalent duration time in Winter max and Summer max regime is calculated based on the hourly load values from 2015 for the countries observed. Assumption is that Winter maximum load represents six months from October to March, Summer load represents six months from April to September maximum load: hours 8-24 and minimum load: hours


16 Variation of Transmission Losses B4 16
17 Technical Resilience/System Safety B6 Security (n-1) assessment combined with maintenance (n-1-1) project s ability to deal with the operation of future transmission systems TWO maintenance lists of transmission lines are defined based on past experience Maintenance kv Ernestinovo (HR) Sremska Mitrovica (RS) -400 kv Kozlodyu (BG) Tantareni (RO) double OHL -400 kv Ribarevine (ME) Pec (KS) -400 kv Blagoevgrad (BG) Solun (GR) -400 kv Arad (RO) Sandorfalva (HU) Lines in maintenance New Interconnections 17
18 Technical Resilience/System Safety B6 Maintenance kv Nis 2 (RS) Bor (RS) -400 kv Zemlak (GR) Elbasan (AL) -400 kv Stip Dubrovo (MK) Lines in maintenance New Interconnections 18
 -400 kv Blagoevgrad (BG) Solun (GR) -400 kv Arad (RO) Sandorfalva (HU) Maintenance 2-400 kv Nis 2 (RS) Bor (RS) -400 kv Zemlak (GR) Elbasan (AL) -400 kv Stip Dubrovo (MK)")
19 Technical Resilience/System Safety B6 Maintenance kv Ernestinovo (HR) Sremska Mitrovica (RS) -400 kv Kozlodyu (BG) Tantareni (RO) double OHL -400 kv Ribarevine (ME) Pec (KS) -400 kv Blagoevgrad (BG) Solun (GR) -400 kv Arad (RO) Sandorfalva (HU) Maintenance kv Nis 2 (RS) Bor (RS) -400 kv Zemlak (GR) Elbasan (AL) -400 kv Stip Dubrovo (MK) 19


20 Robustness/Flexibility B7 Additional exchanges WinMax Additional exchanges SumMax 20

21 Robustness/Flexibility B7 The new project is not affected by the different power exchanges Variants, or delay in construction, because there are no cross border trading that significantly affects this line. Consequently, the project is flexible and retains its benefits even for the altered Variants of cross-border power exchanges 21
22 NTC/GTC Calculation Final achievements Net Transfer Capacity (NTC) calculated in composite way, between: Romania + Ukraine Bulgaria Bulgaria + Turkey Romania GTC (as a physical correspondent to the commercial NTC value), also recorded at the borders; ENTSO-E: A project with a GTC increase of at least 500 MW compared to the situation without commissioning of the project is deemed to have a significant cross-border impact. NTCs have been compared for: Base Case VS. Variant With New OHL (400 kv RO-BG) 22

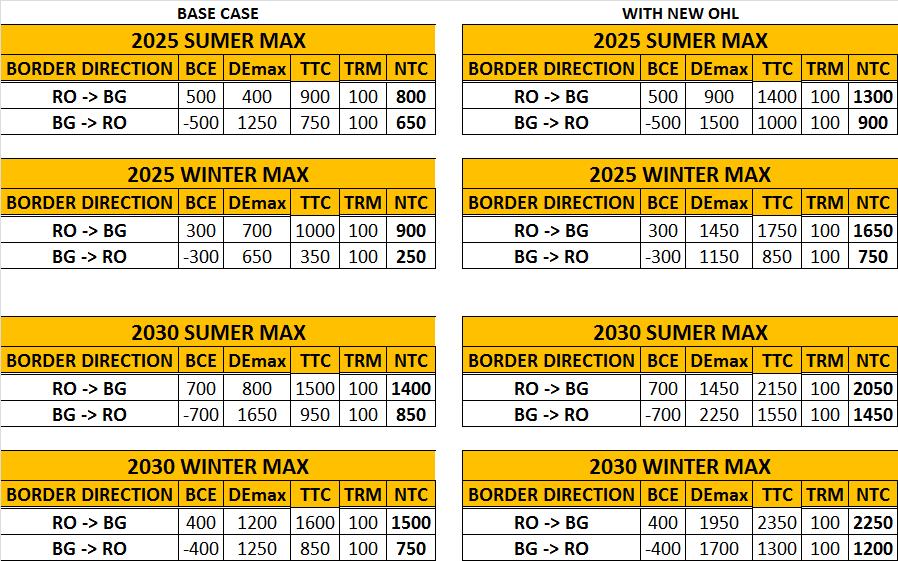
23 NTC Calculation 23
24 CONCLUSIONS ENTSO-E Benefits B1 Improved Security of Supply No significant influence B3. RES Integration There is no impact on RES generation constraints from the new interconnection since no RES spillages are observed B4. Variation in Losses (GWh) Scenario produces the largest overall decrease in transmission system losses B6. Technical Resilience/System Safety The project satisfies all recommended security criteria B7. Flexibility The scenario shows more flexibility and robustness in respect of possible power exchanges in the SEE region Grid Transfer Capability (GTC) The project provides significant increases of potential exchange in both the South to North and North to South-East directions. 24
25 Contact Details If you have any questions, please contact: 25