JACKSONVILLE HARBOR DEEPENING MAYOR S TASK FORCE
|
|
|
- Patience Hancock
- 5 years ago
- Views:
Transcription


1 JACKSONVILLE HARBOR DEEPENING MAYOR S TASK FORCE Presented by: Colonel Alan Dodd Jacksonville District, U.S. Army Corps of Engineers August 7, 2014


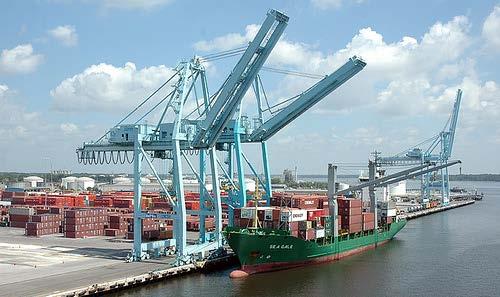
2 47-foot Deepening 2.7 BCR Total Federal Cost: $ million Total Non-Federal Cost: $ MAYPORT NAVAL STATION U.S. MARINE CORPS TERMINAL JEA COAL TERMINAL BLOUNT ISLAND TERMINALS JACKSONVILLE HARBOR AN INVESTMENT IN THE NATIONAL INTEREST Nationally Significant Infrastructure Project as defined by President Obama s We Can t Wait Initiative #39 in U.S. for overall tonnage #12 in U.S. for container traffic Leading auto exporter in U.S. Department of Defense and MARAD* Designated Strategic Port * MARAD: United States Maritime Administration DAMES POINT TERMINALS Images, left to right: President Obama visits JAXPORT; Post-Panamax Cranes at Dames Point TraPac Terminal 2

 CHARLEST")
3 NEW YORK BOSTON JACKSONVILLE HARBOR VITAL PORT/STRATEGIC LOCATION PHILADELPHIA WILMINGTON BALTIMORE NORFOLK LOGISTICS Access to nationwide transportation: Rail: CSX, Norfolk Southern, Florida East Coast Interstates: I-10, I-75, I-95 Port pro-active in infrastructure development (recent USDOT grant for intermodal transfer station) CHARLESTON SAVANNAH JACKSONVILLE MIAMI DEMAND S.E. U.S. most rapidly growing region MULTIPLE USES/VITAL PORT Leading automobile exporter nationwide #12 in container traffic nationwide Strategic Military Cargo Port (832 nd Transportation Battalion) 3


4 JACKSONVILLE HARBOR PROBLEMS Inadequate Depths and Widths Navigation Restrictions Vessel light-loading More frequent trips OPPORTUNITIES Forecasted volume of goods on fewer, larger ships Reduce transportation costs 4 Not to Scale


5 JACKSONVILLE HARBOR LEGISLATIVE AUTHORITY Authorization: Resolution from the Committee on Public Works and Transportation, United States House of Representatives, dated February 5, 1992: to determine whether modifications of the recommendations contained therein are advisable at the present time, in the interest of navigation and other purposes. Non-federal Sponsor: Jacksonville Port Authority (JAXPORT) DEEPENING HISTORY TIMELINE RECOMMENDED PLAN ft 18 ft 30 ft 38 ft 40 ft 40 ft 47 ft PANAMA CANAL EXPANSION Miles 0 to 14.7 Miles 14.7 to 20 Miles 0 to 13 5

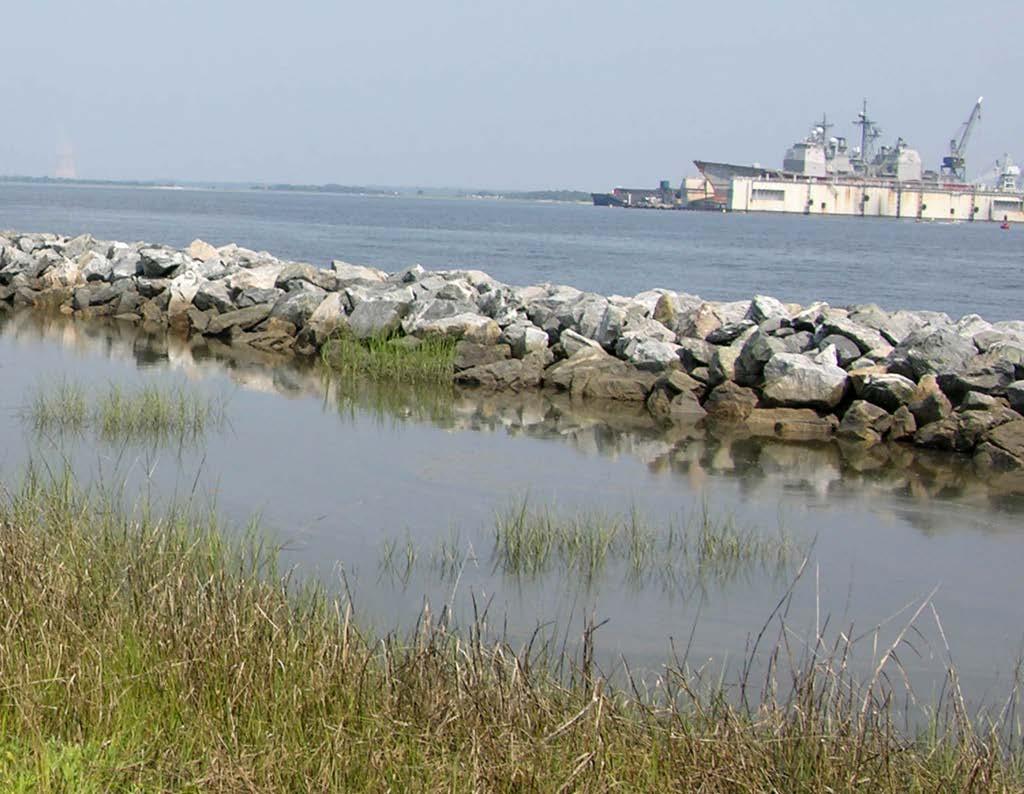
6 JACKSONVILLE HARBOR EXISTING CONDITIONS ECONOMICS ENGINEERING ENVIRONMENTAL Annual Tonnage: 15 million Annual Containers: 900,000 (12 th in Continental U.S.) Trade Routes: Increase in cargo throughput on major East-West trades Dredged Material Management limited in upland capacity New ODMDS Annual O&M 100% federally funded Advance Maintenance Shoreline Erosion St. Johns River/American Heritage River Lower river is an estuary (great variability in salinity) Threatened and Endangered species (e.g., manatees & sea turtles) Essential Fish Habitat Timucuan Ecological & Historic Preserve (TIMU) overlaps a portion of the study area TIMU MILE 0 TO MILE 20 6 TIMU ODMDS Not to Scale


7 DEEPENING STUDY Federal Objective: Reduce navigation transportation costs and develop an alternative that is environmentally sustainable Constraints: Avoid or minimize impacts on environmental resources (i.e., wetlands, submerged aquatic vegetation, and Threatened and Endangered species) 7
")
 MILE 14 MILE 13")
8 ALTERNATIVES CONSIDERED Segment 1: Entrance Channel to River Mile 14 (Reduced to approximately River Mile 13) Segment 2: River Mile 14 to 20 (eliminated) Segment 3: West Blount Island Channel (eliminated) MILE 14 MILE 13 Not to Scale 8


9 AUTHORIZED PROJECT DEEPENING: Entrance Channel to ~ River Mile 13 from existing 40-foot depth to 47 feet WIDENING: Areas 1 and 2: ~ 100 to 300 feet NEW TURNING BASINS: Blount Island: ~ 2700' long by 1500' wide Basin Brills Cut: ~ 2500' long by 1500' wide LOCATION OF ODMDS ~8 nautical miles BRILLS CUT TB 2 MILE 13 BLOUNT ISLAND TB 9 1 Not to Scale 9
10 AUTHORIZED PROJECT 47 FEET SUMMARY OF PROJECT COST (FY14 Discount Rate 3.5% and October 2013 Price Level) Total Cost: Federal Share: Non-federal Share: $ 684,200,000 $ 312,700,000 $ 371,500,000 10

11 AUTHORIZED PROJECT Federal Benefit to Cost Ratio 2.7 ECONOMIC SUMMARY NEW PPX-1 CAPACITY NEW PPX-2 CAPACITY PANAMAX PPX-1 PPX-2 40 FEET 47 FEET CONCEPTUAL RENDERING: ADDITIONAL TEU CAPACITY AT 47-FOOT DEPTH # of calls 2, , , , # Calls 40 foot-depth # Calls 47 foot-depth reduction in vessel calls TRANSPORTATION SAVINGS PER TEU BY TRADE ROUTE SAVINGS PANAMA / SUEZ $1, $ $ EUROPE $ $ $ SOUTH AMERICA $ $ $
 NEW TURNING BASINS WIDENING AREAS DEEPENING (includes widening &")
12 AUTHORIZED PROJECT ENGINEERING SUMMARY Dredging Quantities: ~18 million cubic yards of material to new ODMDS Blasting: Probable (depends on selected contractor s dredging equipment) Advanced Maintenance: Strategically located to maintain existing level of service (same annual dredging frequency as existing conditions) NEW TURNING BASINS WIDENING AREAS DEEPENING (includes widening & turning basin areas) RECOMMENDED ADVANCE MAINTENANCE AREAS Brills Cut TB St. Johns Bar St. Johns Bluff Southern portion of Blount Island TB 12 Not to Scale


13 AUTHORIZED PROJECT ENVIRONMENTAL SUMMARY FULLER WARREN & ACOSTA BRIDGES PROJECT AREA BUCKMAN BRIDGE ~13 miles SHANDS BRIDGE SUMMARY OF SALINITY AND WATER LEVEL IMPACTS EELGRASS 1%-3% increase in salinity stress frequency between Acosta and Buckman Bridges No beds would disappear because of the deepening WETLANDS Due to minor changes in salinity, wetlands would not disappear or significantly change due to deepening Deepening may contribute in a small way to ongoing changes in plant composition and soil subsidence Proposed deepening would not cause changes in water level that would affect salt marsh or other wetlands FISH AND MACROINVERTEBRATES 0-8% change in salinity-based habitat for some fish and shrimp ENVIRONMENTAL STUDY AREA 13
14 AUTHORIZED PROJECT AND SEA-LEVEL CHANGE FULLER WARREN & ACOSTA BRIDGES PROJECT AREA BUCKMAN BRIDGE ~13 miles SHANDS BRIDGE AVERAGE SALINITY (PPT) AT BUCKMAN BRIDGE SLC EXISTING SLC WITH PROJECT WITH PROJECT Used current guidance (EC ) Results of analysis for the 50-year period, : Low: 0.39 feet Intermediate: 0.87 feet High: 2.4 feet Conclusion for navigation: Based on these sea-level rise projections and elevations of current and planned port facilities, no impacts on navigation and minor impacts on port facilities 1.00 Conclusion for salinity impacts: Majority of salinity changes will occur due to sea-level change; only minor impacts attributable to the project ENVIRONMENTAL STUDY AREA SLC: Sea-Level Change 14


15 ENVIRONMENTAL MONITORING Address uncertainty of the models Inform agencies and public on monitoring data Monitoring would include water quality, wetlands, eelgrass, and fisheries BASELINE COLLECTION PERIOD 5 to 10 years CONSTRUCTION PERIOD 4 to 6 years POST- CONSTRUCTION PERIOD up to 5 to 10 years Projected construction date 15

16 CORRECTIVE ACTION PLAN THRESHOLDS DEFINED * COLLECT MONITORING DATA ANNUALLY ASSESS SALINITY/ECOLOGY THRESHOLDS DATA ANALYSIS AND SALINITY MODELING If effects are determined NOT to be due to the project ADDITIONAL MITIGATION ABOVE BASE Determine scale of impact EFFECTS ASSESSMENT: ECOLOGICAL MODELING AND MONITORING If effects are determined to be due to the project * Draft thresholds identified during feasibility phase; thresholds are updated and finalized during Preconstruction Engineering and Design (PED) 16

17 CULTURAL RESOURCES SUMMARY Conducted underwater cultural resources surveys from River Miles 0 to 13, and in the Mile Point project area Completed reconnaissance surveys of the islands at Mile Point Both the Deepening and the Mile Point Projects are compliant with Section 106 of the National Historic Preservation Act of 1966 Coordination with the Florida State Historic Preservation Officer (SHPO) and appropriate federally recognized Tribes has been completed Based on these surveys, the proposed projects will not adversely affect cultural resources GREAT MARSH ISLAND GREAT MARSH ISLAND UNDERWATER SURVEY RECONNAISSANCE SURVEY GREAT MARSH ISLAND AREA OF POTENTIAL EFFECT: MILE POINT PROJECT AREA 17

18 PUBLIC/AGENCY INVOLVEMENT Public Outreach Public Coordination initiated in 2007 Public Meetings 6 Public Meetings or Workshops Bi-Monthly Teleconferences Agency Coordination Cooperating Agency Letters: 2011 Meetings on Ecological Modeling: March and October 2012 Monthly Teleconferences Endangered Species Act (ESA) coordination with U.S. Fish and Wildlife Service (November 2013) and National Marine Fisheries Service (February 2014) Magnuson-Stevens Fishery Conservation and Management Act (EFH) coordination with National Marine Fisheries Service (January 2014) 18
19 PROJECT IMPLEMENTATION (Key Dates) Feasibility Phase: Chief of Engineers Report: April 16, 2014 Authorized in Water Resources Reform and Development Act (WRRDA): June 2014 Preconstruction Engineering and Design (PED) Phase: June 2014 September 2015 Construction Phase: Subject to Appropriations:
20 EXTENSIVE REVIEWS May 2013: Draft Legal Certification May 2013 October 2013: Draft Agency and Public Review July 2013 Draft Report Reviews: Agency Technical Review/HQ Policy Review/Independent External Peer Review 2013 Cost Certification/Value Engineering Analysis: February 2014 Final Agency Technical Review and Legal Certification January 2014: Agency Approval for Use of Ecological Models February 2014: Final State and Agency Review and National Environmental Policy Act (NEPA) Review 20
21 SUMMARY OF INDEPENDENT EXTERNAL PEER REVIEW (IEPR) FINDINGS Panel Members: 5 Technical Experts Hydraulic Engineering Geotechnical Engineering Economics Environmental Plan Formulation Comments: 13 Final Panel Comments The Panel concurred with all Project Team responses to the Final Panel Comments The Final IEPR report is available at 21
22 CONCLUSIONS Final authorized report is legally and technically sound Extensive coordination will continue throughout the life of the project For more information visit 22