Tantalus. Like California water management!
|
|
|
- Tamsyn Sanders
- 5 years ago
- Views:
Transcription
1 Tantalus In Hades, thirsty Tantalus was burdened to have water rise to his neck threatening to drown him, but receded when he stooped to drink. Above him was a boulder, threatening to crush him at some uncertain future time. Like California water management! 1


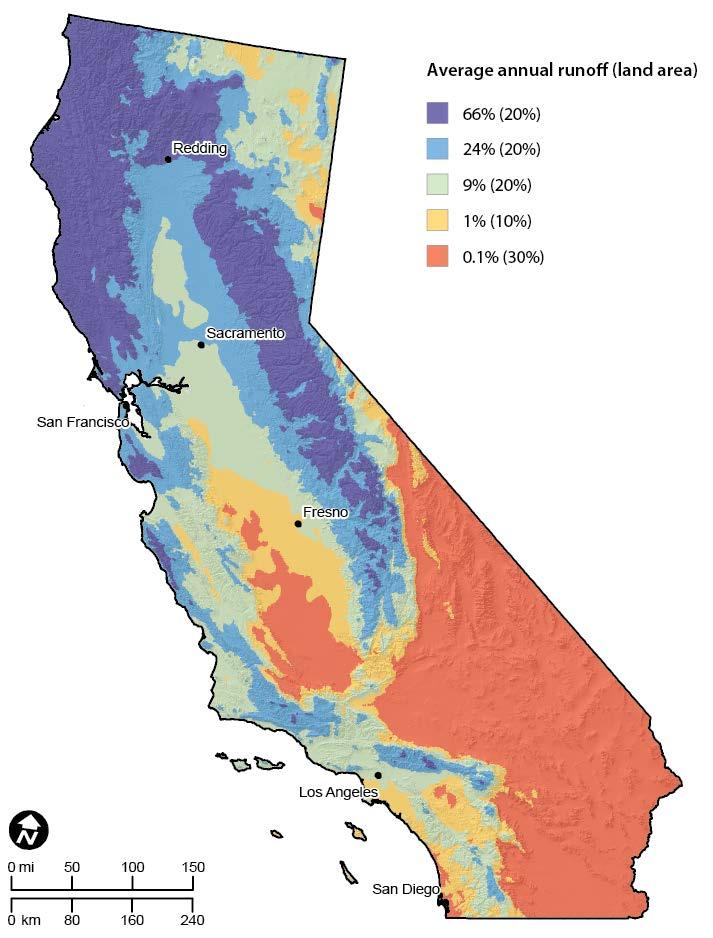
2 Sacramento Valley Precipitation : 8 th driest in 106 years, 4 th driest in runoff 2
:514-523.")
3 Most annual rainfall variability in US Annual coefficient of variation SOURCE: Michael Dettinger, Climate Change, Atmospheric Rivers, and Floods in California A Multimodel Analysis of Storm Frequency and Magnitude Changes. Journal of the American Water Resources Association 47(3): NOTES: Dots represent the coefficient of variation of total annual precipitation at weather stations for , Larger values have greater year-to-year variability.

4 Complexity of Water in California 4


5 5 Native Habitat and Fishes Salmonid Habitat Wetlands California s freshwater fishes are losing OK Special Concern Listed Extinct


6 Many Local, State, Federal Agencies Separate Federal and State agencies & laws wholesalers & regulators 1,000s of locally-elected water agencies Most infrastructure funded & governed by local and regional water districts Many coordinating water contracts 6
7 Future Climate Changes 1) Sea level rise 2) Warmer temperatures 3) More variability 4) Precipitation changes? And many non-climate changes 7

8 Many Drivers of Change Climate Sea level rise Warming Precipitation change Whiplash across extremes Ecosystems New invasive species Continued degradation Deterioration Groundwater overdraft-sgma Salt, nitrate contaminants Aging infrastructure Sacramento-San Joaquin Delta Mining legacies Earthquakes Economy and Demography State and federal finances Globalization Population growth and urbanization Regulatory changes Energy Environment Social/economic Science and technology More data! New chemicals New technologies 8
 Parks 4) Wastewater plants 5) Sewers 6) Ecosystems")
9 Sea Level Rise and Infrastructure 1) Roads 2) Land use 3) Parks 4) Wastewater plants 5) Sewers 6) Ecosystems 9


10 Delta and Sea Level Rise 10
11 Warming and Central Valley Total Monthly Mean Rim Inflow (TAF) Streamflow 1.5T 0%P 1.5T 9%P 3.0T 0%P 3.0T 18%P 5.0T 0%P 5.0T 30P HCM HCM HCM PCM PCM PCM Historical Calendar Month 11
 Some native species unsustainable in the wild 7) Funding solutions mostly local and regional 8) State s leverage is mostly regulatory, not funding 9) Nitrate groundwater")
12 Resistance is Futile 1) Coastal erosion and flooding 2) Flooding in parts of the Delta 3) Reduced Delta diversions 4) Less irrigated land in the southern Central Valley 5) Less urban water use, more reuse & storm capture 6) Some native species unsustainable in the wild 7) Funding solutions mostly local and regional 8) State s leverage is mostly regulatory, not funding 9) Nitrate groundwater contamination is inevitable 10) Groundwater will be managed more tightly 11) The Salton Sink will be largely restored California will always have water problems, but we can manage better. 12
 Economy depends less on water abundance 3) Water markets can shift use and civilize change")
13 Reasons for Hope 1) Human water use peaked? 2) Economy depends less on water abundance 3) Water markets can shift use and civilize change Source: Hanak et al ) We agree we have a problem 13
 Myths of California Water, PPIC.org Hundley (1992), The Great Thirst, UC Press.")
 Comparing Futures for the Sacramento San Joaquin Delta, UC Press Lund et al.")
14 Suggested Readings Hanak et al. (2011) Managing California s Water, PPIC.org Hanak et al. (2010) Myths of California Water, PPIC.org Hundley (1992), The Great Thirst, UC Press. Kelley (1989), Battling the Inland Sea, UC Press. Lund et al. (2010) Comparing Futures for the Sacramento San Joaquin Delta, UC Press Lund et al. (2018) Lessons from California s Drought Pisani (1983), From Family Farms to Agribusiness, UC Press MavensNotebook.com CaliforniaWaterBlog.com 14
15 15
16 Some details 1) Future water demands matter too! Similar magnitude to climate warming effects 2) California s system can adapt, at some cost 3) Groundwater use expands to dampen interannual variability 4) Groundwater takes more over-year storage, freeing surface reservoirs for floods 5) Delta operations can mediate or hurt 16
17 Water Storage Capacity and Uses in California 140 Total Capacity Capacity (maf) Conclusions Seasonal Storage Drought Use 20 0 Groundwater Capacity Surface Storage Proposed Expansions 17
18 Water supply system portfolio actions Water supply Water Source availability Capture of fog, precipitation, streams, groundwater, wastewater Protection of source water quality Conveyance capacities Canals, pipelines, aquifers, tankers (sea or land), bottles, etc. Storage capacities Surface reservoirs, aquifers and recharge, tanks, snowpack, etc. Agricultural use efficiencies and reductions Treatment Existing water and wastewater treatment New water and wastewater treatment Wastewater reuse Ocean Desalination Contaminated aquifers Operations Reoperation of storage and conveyance Conjunctive use Water demands and allocation Ecosystem demand management Urban water use efficiencies and reductions Recreation water use efficiencies Incentives to work well together Pricing Markets Norming, shaming Subsidies, taxes Education 3 18

19 San Diego water supply portfolio 578 taf/yr 588 taf/yr 477 taf/yr 694 taf/yr 19
20 Local and Statewide Portfolio Local Activities: - Conservation and use efficiency - Wastewater reuse - Desalination (brackish & ocean) - Groundwater use and recharge - Surface reservoir operations - Water markets and exchanges Statewide Activities: - Inter-regional water conveyance - Surface reservoir operations - Plumbing codes & conservation incentives - Groundwater banking and recharge - Water market support and conveyance - Wastewater reuse subsidies Integrating mix of actions portfolio planning.

21 SGMA connects to the Delta Ending overdraft increases pressure on Delta operations. CALVIN results (Nelson et al., 2016) 21

22 Groundwater sustainability 22
 Integrated portfolios are the future 6) Nature and economics eventually prevail over indecision and existing law 7) Universities can")
23 Conclusions 1) Statewide water system, with local governance and fragmented regulation 2) Limited State and Federal abilities 3) Local government is most important 4) Complexity enriches possibilities 5) Integrated portfolios are the future 6) Nature and economics eventually prevail over indecision and existing law 7) Universities can help 23