Solar, Wind and Market Power in the New Zealand Electricity Market (and hydro lake dynamics) Mina Bahrami Gholami and Stephen Poletti
|
|
|
- Edgar Ellis
- 5 years ago
- Views:
Transcription
1 Solar, Wind and Market Power in the New Zealand Electricity Market (and hydro lake dynamics) Mina Bahrami Gholami and Stephen Poletti University of Auckland
2 Economic Paradox Energy Only Markets. Low-carbon power system High cap cost and very low variable costs eg. Wind, geothermal, solar Expect low prices (often zero) and price spikes when investment covers fixed costs.
3 Low Carbon power may put a lot of pressure on Energy Only market design Market Power can exacerbate these problems (Browne, Poletti and Young 2015) Maybe better to have DIFFERENT kinds of intermittent generation. So output not correlated. Eg SOLAR and WIND
4 NZ: Major new investment in wind farms expected and Solar uptake is increasing fast Wind energy resource very promising as average wind speed high with long coastline. Capacity factors of 40%!! No subsidies for solar but rooftop solar for own consumption competitive with retail price $0.30/kWh (US$ 0.25) but not wholesale price ($0.1/kWh)
5 Long Run Short run evidence that more zero cost renewable energy lowers average prices.merit Order effect. Also looks like some periods at least see lots of market power. Long run Mix of generation changes. Eg. more peakers. MODEL LONG RUN MIX OF GENERATION USING GENERATION EXPANSION MODEL (with constraints on solar and wind penetration)

6 Dry Year Problem. Only 6 weeks hydro storage..some years low inflows..=low lake levels, high prices and possible rationing
7 Cumulated inflows leading up to winter cf cumulated solar output, DRY YEARS =MORE SUNSHINE
 and wind right.")
8 Capacity factor Descriptive statistics. 0,5 0,45 0,4 0,35 0,3 0,25 0,2 0,15 0,1 0,05 0 Jan Feb Mar Apr May Jun Jul Aug Sep Oct Nov Dec Above. Monthly capacity factors. Solar left (and demand) and wind right. demand percentile vs capacity factors Solar Solar + Wind Wind
9 Summary Solar cf very low in winter when demand high and lake levels low X More solar generation during dry years Solar looks better correlated with demand (except for the top 20% OF DEMAND PERIODS WINTER AFTER SUNSET)? Wind generation capacity factor in winter looks a lot better than solar Wind/solar output negatively correlated
10 Methodology Long run capacity mix for 2025 with projected demand using Generation Expansion Model (GEM) Short-run prices modelled using simplified network so have line constraints and locational pricing. Strategic model using computer agent based model with a learning algorithim. KEEP TRACK OF HYDRO DISPATCH AND LAKE LEVELS OVER YEAR. Looks at different scenarios with amount of intermittent generation as a constraint. High wind, mixed solar, solar. ALL SCENARIOS HAVE SAME INTERMITTENT ENERGY OUPUT OF ABOUT 20% OF TOTAL ELECTRICITY DEMAND (IF NO SPILLAGE).
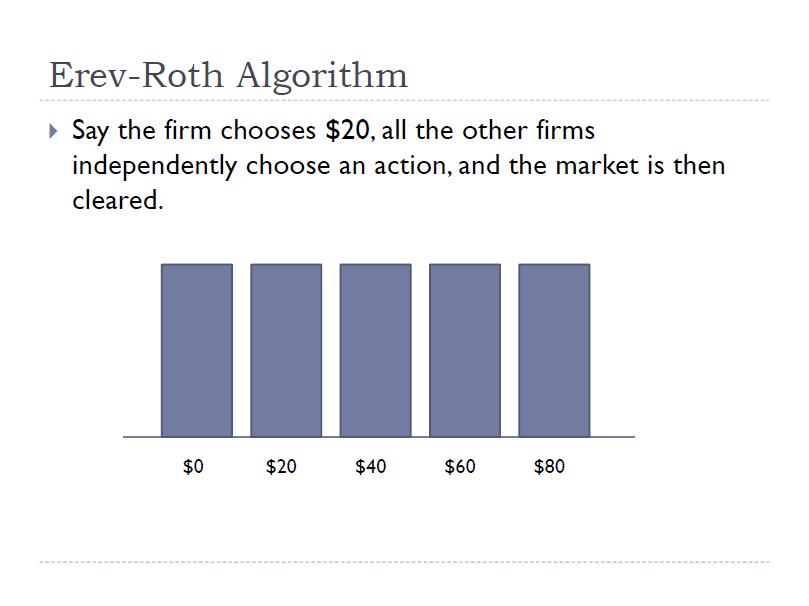
11 Agents try different actions. Actions which yield high profit are more likely next round
12
13 Agent Based Model If profit from an action is good then action more likely next round. Action here is to specify price for the generation capacity of plant to be offered into the wholesale market. Typically 1500 rounds for agents to learn. Computers not very smart!
14
15 E-R model of NZ market Firms have portfolio of generators. Usually choose different price to offer capacity of each generators to the wholesale market. So firm step function supply curve. Simplified 19 node network. Market solver similar to one used by ISO. Line losses and line capacity. Must runs bid in at ZERO cost such. First to be dispatched RR hydro, and min flow rates on rivers downstream of dams, geothermal. 2000MW is must run (1/4 of peak demand)
16 SCENARIOS Start with different wind penetrations and long run equilibrium hydro/geothermal/gas. Starting wind capacities are 6500MW NZ peak demand is around 9000MW 6500MW is about 45% of total capacity. Substitute solar for wind so total energy output from solar&wind stays the same. NZ system has locational prices so location is important. As solar likely to be rooftop we allocate solar in regions in proportion to population. USE GEM for long run capacity mix. USE AGENT BASED MODEL TO CALCULATE PRICES WITH MARKET POWER. USE DRY YEAR 2006 WIND, SOLAR, DEMAND DATA.

17 Results Typical week
18 High Intermittent generation scenarios PRICES FOR HIGH SOLAR PENETRATION are very HIGH. In winter when sun goes down remaining generators can exercise considerable market power even though prices decrease on sunny still days. HIGH WIND AND WIND/SOLAR MUCH LOWER THAN BASELINE 300 Demand weighted average prices High Solar Baseline Solar/Wind wind
19 High Wind Jan Feb Mar Apr May Jun Jul Aug Sep Oct Nov Dec Baseline High wind Solar/wind High solar Solar/wind Baseline High wind High Solar has VERY high winter prices
20 Spillage. More for solar wind so lower lake levels High wind Solar/wind
21 But Solar/Wind generation is more efficient at lowering prices (even though less over the year). Merit order effect $/MWh MW
22 Renewables. Still not 100% but better High Solar Baseline Solar/Wind Wind
23 Conclusions Solar on its own is not good for New Zealand Both high wind on its own and mixed solar/wind perform well. For intermittent generation it s better to have generation from different sources which are not correlated. So Wind Solar looks promising. But pure wind looks good too as better capacity factor in winter is relatively high. Can get 90% renewable with fair amount of spillage To do better probably need storage or lots of demand flexibility
24 THE END