Alternative Energy. Reducing our dependency on fossil fuels. Dr. Eric Bibeau
|
|
|
- Doreen Sparks
- 5 years ago
- Views:
Transcription


1 Alternative Energy Reducing our dependency on fossil fuels Dr. Eric Bibeau Mechanical & Manufacturing Engineering Dept Manitoba Hydro/NSERC Alternative Energy Chair University of Manitoba E2-229, May 25, 2006

2 OUTLINE Why alternative energy? Distributed generation Manitoba Hydro/NSERC Research Chair in alternative energy anaerobic digesters icing of wind turbines kinetic turbines Biomass Plug-in Highway

3 Arctic Climate Impact Assessment Report Arctic will lose per cent of its ice distribution by 2100 one model predicts that the North Pole in summer will be completely ice-free by 2070 Projections made by the Intergovernmental Panel on Climate Change estimates that if global greenhouse gas emissions double their prep re- industrial levels, melting ice will raise sea levels between 10 and 90 cm in this century Human activity adds 30 Billion tonnes of new CO 2 per year

4 Green House Gases Natural processes generating 770 BMT/yr What is effect of human activity of 30 BMT/yr? Earth dynamic system Add new ball every 2 years Time CO 2 levels in atmosphere 1850: 250 ppm Now: ppm


 Gas & Liquid Fuels")
5 Nuclear Alternative Energy Sources Solar Fission Geothermal Hydro Wind Ocean δt Biomass Steam PV Collectors Mech/Turbo Generator Processing Electricity (highest form) Gas & Liquid Fuels Heat (lowest form)


6 Drivers Favoring Alternative Energy Population growth Sustainable development Environmental enhanced global warming Fossil fuel extraction rates approaching peak Technical development cost reduction


7 Drivers Favoring Alternative Energy COE cents/kwh Wind PV COE cents/kwh NREL Geothermal 60 Solar thermal Biomass

8 Drivers Favoring Alternative Energy Oil production Future oil production Future gas production


9 Why alternative energy in Manitoba? Almost 100% alternative energy for power hydro biomass (2 plants) Alternative energy can displace fossil fuels in Manitoba But power costs are low fossil fuels used for transportation e.g.: Manitoba uses ethanol blends for gasoline use natural gas for heat Power demand growth Self generation Export to neighbours Export

10 Importance of alternative energy Power demand is increasing rapidly population increasing standard of living increasing more people want access to electricity Energy reduction initiatives can only offset part of the demand Carbon constrained world Mitigates fuel prices


11 Distributed Generation (DG) using alternative energy 2.0 Billion without power Many Canadians live in northern communities Non-centralized grid new grid installation to rural areas have significant costs DG makes rural electrification possible Local employment Education Poverty alleviation Better health

12 Alternative energy Icing of wind turbines Anaerobic digesters Kinetic turbines Biomass energy conversion PHEV 343 C Heater 160 C 1010 C Flue Gas 222 C 269 C Recuperator Power Unit 104 C 65 C Cooler 90 C Coolant 60 C


13 Kinetic Turbines

14 What are Kinetic Turbines? Convert flow kinetic energy into power Low environmental impact does not require head, dam, or impoundment minimizes fish impact: screens; air; slow RPM Limited data long term deployment; cold weather impact cost information; not commercially demonstrated


15 Modular Rapid Deployment Power increases by: Velocity 3 Density Area Water Air 3.0 m 150 m 600 kw twin unit (base load) Water velocity = 4.0 m/s Water density = 1000 kg/m 3 Unit does not exist yet 1,800 kw (0.33 CF) Air velocity = 10 m/s Air density = 1 kg/m 3
16 Commercialization Objectives Prove first year-long operation Evaluate the applicability of kinetic turbines Establish operation and costeffectiveness in all seasons Prove kinetic turbines can achieve high capacity factor/ high availability deliver base load power
17 Commercial Testing of Kinetic Turbines Positive step towards Sustainability Environmental breakthrough for remote communities New source of renewable energy Support distributed generation industry Show DG can work Connect alternative power to grid


18 Why Kinetic Turbines in Manitoba Manitoba resource vast river system requires flow velocities above 2.5 m/s Renewable energy technology Remote communities application Fits hydro-base culture Rapid deployment and modular Base load generation Likely cost effective distributed energy Enhance and build research capacity at the University of Manitoba
19 Commercialization and R&D Objectives Flow velocity (Knots) Power (kw) Power (kw) Drag (lbf) Torque (lbf) Ocean/Demos 60 kw Demo Project UEK 8 feet and shrouded turbine UofM R&D/ targets Thousands Forces (lbf) Flow velocity (m/s)


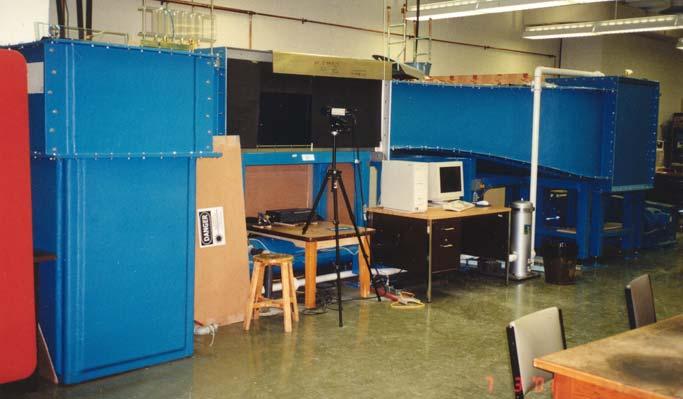
20 Kinetic Turbine Research at UofM Numerical modeling Experimental analysis


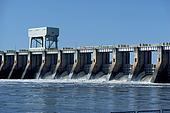
21 Proposed Kinetic Turbine Demo Project River Flow Spillway Bridge Station
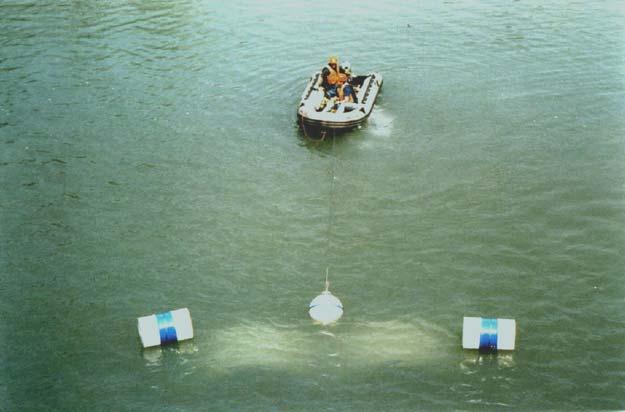
22 Kinetic Turbine Project Will test for the first time a kinetic turbine for commercialization 1 year period; cold climate; higher power density River application; grid connected Higher flow velocity UEK kinetic turbine (2.5 m/s) Develop Safety and procedures protocols Want proven technology for cold weather climates and high river flow velocities May prove new viable small-hydro application for remote communities


 1.50 1.")


23 Flow Measurements Turbine Flow Meter 2.50 Velocity downstream walkway Pointe du Bois June 13, Velocity (m/s) m 8.0 m 10.8 m ADCP Flow Measurements m m Depth (m)
 Outside Camera 120V Atco Trailer Hydro Laptop DC/AC Walkway Bridge Data Heater Boat Turbine Winch Boat Cable Turbine Cable Voltage Current Vibration Vel & Turbulence Pressure drops")
24 Testing of UEK AC/ DC DAQ Laptop Boat Heater DC Data Kinetic Turbine AC Turbine Underwater Camera T1 Wireless to Internet (0.01 Hz) Outside Camera 120V Atco Trailer Hydro Laptop DC/AC Walkway Bridge Data Heater Boat Turbine Winch Boat Cable Turbine Cable Voltage Current Vibration Vel & Turbulence Pressure drops Temperatures 120V From Plant Flow AC 480VAC 3 Phase To Grid 2 Cemented Cables
25 Expected Benefits Proves a DG technology for commercialization Invest in support of sustainability Potentially less costly than wind remote applications Develop required experience anchoring, deploying/retrieving safety and deployment protocols Provide a viable technology for IPP s Allows off-grid applications


26 Icing of wind turbine blades Manitoba Hydro large wind farms planned Ice issues southern Manitoba highest incidence of icing in Manitoba accretion causes reduction in turbine efficiency load imbalance from uneven shedding Impacts personnel safety increase stresses on wind turbine


27 Icing of wind turbine blades Icing research experimental investigation of icing on wind turbine blades numerical modelling of ice accretion ice mitigation strategies


28 Icing of wind turbine blades Experimental Work test models fixed wing 3 blade rotating model non-uniform ice shedding test mitigation techniques instrumentation force balance PIV heat transfer rates at interface
 Target: $2,500 /kw Turnkey Brayton Hybrid Cycle")
29 Distributed CHP Technologies Distributed CHP Waste: forestry and agriculture biomass residues Industrial waste heat Entropic Rankine Cycle (ERC) Target: $2,500 /kw Turnkey Brayton Hybrid Cycle (BHC)

30 BioEnergy
31 Is biomass a clean fuel? Does nature do a better job? SO 2 no influence of technology Natural way has more NOx CH 4 is 21 times worst of a GHG than CO 2 ; biomass energy production makes sense CO 2 no change except for composting
 Power ~1 MWe-hr ~No GHG Heat ~5 MWth-hr ~No GHG Turbion CHP Biomass (local or pellets) 2 BD tonne/mwe-hr 2 MWe Community")
32 BioEnergy in a Northern Community Subsidized Power System CHOICES? BioPower System Power: Diesel Fuel ~233 liters/ MWe-hr ~2.83 Kg CO2/ liter Heat: Oil ~93 liters/ MWth-hr ~2.83 Kg CO2/ liter Northern Community (Biomass district heat already installed) Power ~1 MWe-hr ~No GHG Heat ~5 MWth-hr ~No GHG Turbion CHP Biomass (local or pellets) 2 BD tonne/mwe-hr 2 MWe Community Subsidized Power System BioPower System Power (2 MWe) tonne CO 2 0 tonne CO 2 Heat (10 MWth) tonne CO 2 0 tonne CO 2 Total 34,608 tonne CO 2 0 tonne CO 2

33 Re-Fuels Fossil fuels Re-Electricity Why biomass energy in Manitoba? Manitoba PJ/year Heat Transport Electricity Needs Energy node


34 Energy Costs NYMEX Crude Pricing Contract /2/97 US$ / barrel 1/2/98 1/2/99 1/2/00 1/2/01 1/2/02 1/2/03 1/2/04 1/2/05 CHP and CHPC


35 Bioenergy Thermal Conversion in Manitoba

36 UofM Bioenergy Projects Distributed CHP biopower Brayton Hybrid Cycle (BHC) Canadian Foundation for Innovation Entropic Rankin Cycle (ERC) Entropic Energy, TEAM and NRCAN Biopower and nutrient removal MESH, Ducks, MRAC, SDIF, IISD Anaerobic Digestion Modelling NSERC/Manitoba Hydro Chair

37 Using Wetlands & Biopower to Partially Address Nutrient Loading in Lake Winnipeg Can removal nutrient loading by Accessing wetlands Ecological sensitive area Harvest cattails and bulrushes Biomass feedstocks contains P and N Thermally convert = Power and Heat Fate of P and N Overall emissions
38 BioEnergy and Nutrient Removal Vegetation maps Netley- Libau Marsh 2001 From: Evaluation of a wetland-biopower concept for nutrient removal and value recovery from the Netley-Libeau marsh at Lake Winnipeg, N. Cicek, S. Lambert, H.D. Venema, K.R. Snelgrove, and E.L. Bibeau Vegetation Class 2001 Area Covered Hectares (ha) % of Total Marsh Area Bulrush (Scirpus) River Rushes Cattail (Typha) Giant Reed (Phragmites)

39 BioEnergy and Nutrient Removal Netley 1979 Area Harvest Moisture Biomass HHV Plant Available (Wet tonne) (Dry tonne) kj/kg Species (ha) min max (%) min max Dry Cattail , , ,070 98,043 18,229 Bulrush ,215 32, ,629 26,653 17,447 Reed Grass 650 1,112 1, ,020 17,285 Rushes, Sedges , ,819 15,838 Sum 9,806 13, ,659 11, ,535 Weighted average ,024
40 Nutrient Removal (Winter) Parameters Netley-Libau Results Cattail Bulrush River Rushes Giant Reeds Moisture, % as fed TN, % dry matter TP, % dry matter Heating Value, KJ/kg 18,229 17,417 17,285 NA 2001 Vegetation Total N Total P Class Removed (ton) Removed (ton) Bulrush River Rushes Cattail Giant Reed Total Average From: Evaluation of a wetland-biopower concept for nutrient removal and value recovery from the Netley-Libeau marsh at Lake Winnipeg N. Cicek, S. Lambert, H.D. Venema, K.R. Snelgrove, and E.L. Bibeau

41 Nutrient Removal Nutrient from Red River to Lake Winnipeg 32,765 ton/yr of N 4,905 ton/yr of P Early estimates of N and P removal by harvesting marsh 3.1% - 4.2% of N 3.8% - 4.7% of P Winter harvest
42 BioEnergy and Nutrient Removal R&D Develop harvest methods Determine best time for harvest versus practical time Fate of N and P during thermal conversion Biomass feedstock costs Optimal use of feedstock for bioenergy for cost recovery
 Cycle loss 15.2 16.5 15.3 12.1 7.2 10.5 (MW) Power generated 3.03 1.75 3.13 1.83 3.68 4.71 (MWe) Cogeneration heat 0.0 15.0 14.5 0.0 16.4 0.")
43 Distributed BioPower Power produced from estimated marsh harvest Small Condensing Steam Small steam with cogeneration Organic Rankine Cycle Air Brayton cycle Entropic cycle Gasification 1 Heat recovery loss (MW) Cycle loss (MW) Power generated (MWe) Cogeneration heat (MWth) 1 1 Assumes Producer gas has heat value of 5.5 MJ/m 3 and cooled down to room temperature
 Heat (60% use) Total Small Steam $18 $82 $100 Air Brayton $25 $57 $83 1 ORC $33 $78 $112 Entropic $39 $88 $127 Large")
44 Distributed BioPower CHP Revenue Chart (Manitoba) 20% MC Electical Power (Cnd) Natural Gas (Cnd) Revenue (per BDTon) $0.06 per kwhr $11.65 per GJ Power (90% use) Heat (60% use) Total Small Steam $18 $82 $100 Air Brayton $25 $57 $83 1 ORC $33 $78 $112 Entropic $39 $88 $127 Large Steam $84 $0 $84
45 Anaerobic Digesters Biological degradation Mesophilic bacteria (25 o C-38 o C) Bio-Gas CH 4 & CO 2 Heat and power Slurry In Heat In Complete Mix Effluent Out Heat In Slurry In TPAD Effluent Out Reduction in CH 4 from manure & heating N 2 0 from manure & heating CO 2 from displaced electricity and heating Water usage Odour from barn, lagoons & land Can address phosphates soil build-up Organic fertilizer Heat In Slurry In Plug Flow Effluent Out Slurry In Effluent Out Covered Lagoon
46 Anaerobic Digester Model Develop numerical model for swine anaerobic digester heat transfer (Phase 1) anaerobic digestion coupled to flow (Phase 2) two-phase, liquid and mechanical mixing (Phase 3) Demonstrate numerically simple AD systems can operate economically in cold climates Design and optimize cost-effective anaerobic lagoontype swine digester for cold climates low solids Develop tool Design system
47 UofM Lagoon Design Wind Compressor Flexible Membrane Power IC Engine Hot Glycol Burner Glycol Loop Digester Gas Glycol Return Recirc Heat Exchanger Recirc Compressor Recycled Plastic Linked Boxes Tsolid = 35 o C Gas Liquid/Solid Manure Flax Straw Distributer Pipe 2 Clay Layers Warm Recirc Gas Hay Recirc Gas Mixing+Heating

48 Digester Model
, Stats")
49 PHEV In 2005, there were 19.0 million vehicles of all types in Canada They drove billion passenger-km that year Source: Canadian Vehicle Survey (2005), Stats Canada
50

51
52 Sun 1000 times! 32 times!


53 Emissions It is estimated vehicle exhaust is responsible for 20% of greenhouse gasses Who has the answer?

54 Vehicle GHG Emissions in Canada 50 times the weight of all Canadians GHG's (Mt) Year Source: Online databases, Office of Energy Efficiency, Natural Resources Canada Gasoline Diesel Total


55 What is the goal? Sun Have a few of these trips with ZEV Do not account for up-streaming 1000 times! Replace the majority of these trips with renewable energy Minimize overall emissions Account for up-streaming Low cost solution and efficient use of renewable energy Corbis Corbis Corbis

56 Node Primary Energy Renewable Electricity Renewable Fuels Fossil Fuel Manitoba Energy Node 118 PJ Manitoba: 1.15 million people Renewable Energy 5.5 GW Hydro reserves 5.0 GW Farmland 77,321 km 2 Electricity Transportation Heat Node Needs Energy Conversion Station

57 Manitoba Grid Infrastructure Winter Vehicles in Manitoba cars 662,200 Driving mileage per day km/day 50 Pow er PHEV New MW power Pow er Rav4 EV Pow er FCX FCV Load (MW) MB Winter Load Winter Winter + FCV Winter + BEV Winter + PHEV Generating Capacity GHG/Emissions? Daytime Nightime Day Hours

58 Plug-in Highway Program Target 10 BioPHEV in Manitoba Ford Escape Parallel Hybrid 85% ethanol (E85 engine) 40 to 100 km electrical autonomy 65% electrical / 30% biofuel/ 5%Gas Monitor over 2 years vehicle performance
 330 million L eq of bio-fuel (9 trips) 55 million L of gasoline (2 trips)")
59 32 Trips to the sun (MB) 32 times! 1.1 Billion L of gasoline replaced with 500 MWe of renewable power (21 trips) 330 million L eq of bio-fuel (9 trips) 55 million L of gasoline (2 trips) Low cost, high efficiency and low overall emissions solution BioPHEV Gas Tank Renewable Electricity Bio- Fuel Gas