2011 Amendment Cycle 1 DRCOG CO and PM 10 Conformity Determination
|
|
|
- Timothy Grant
- 5 years ago
- Views:
Transcription
1 2011 Amendment Cycle 1 DRCOG CO and PM 10 Conformity Determination for the Amended Fiscally Constrained 2035 Regional Transportation Plan and the Amended Transportation Improvement Program Denver Regional Council of Governments 1290 Broadway, Suite 700 Denver, CO Preparation of this report has been financed in part through grants from the U.S. Department of Transportation, Federal Transit Administration, and Federal Highway Administration
2 ii
3 ABSTRACT TITLE: AUTHOR: SUBJECT: 2011 Amendment Cycle 1 DRCOG CO and PM 10 Conformity Determination for the Amended Fiscally Constrained 2035 Regional Transportation Plan and the Amended Transportation Improvement Program Denver Regional Council of Governments Air quality conformity of the Denver region's long-range transportation plan and short-range improvement program DATE: ugust 17, 2011 SOURCE OF COPIES: Public Information and Communications Office DRCOG 1290 Broadway, Suite 700 Denver, CO (303) NUMBER OF PAGES: 113 ABSTRACT: Demonstration of the Denver region's timely implementation of adopted Transportation Control Measures and meeting of federally prescribed air pollution emissions tests. iii
4 iv
5 TABLE OF CONTENTS CHAPTER 1. INTRODUCTION... 1 Federal Requirements... 1 Current Situation... 3 Process... 5 CHAPTER 2. IMPLEMENTATION OF CONTROL MEASURES... 7 Transportation Control Measures... 7 Timely Implementation Criteria... 8 CHAPTER 3. EMISSIONS TESTS General Description Technical Process Control Measures Mobile Source Measures Emission Test Results APPENDIX A TRANSPORTATION NETWORK ASSUMPTIONS APPENDIX B TRANSPORTATION MODEL CALIBRATION DESCRIPTION APPENDIX C PM 10 STREET EMISSIONS REDUCTION COMMITMENTS APPENDIX D U.S. DEPARTMENT OF TRANSPORTATION CONFORMITY FINDING (TO BE PROVIDED) APPENDIX E LIST OF ACRONYMS v
6 LIST OF TABLES Table 1 Conformity Emissions Tests Table 2 Population and Employment Forecasts - DRCOG Region Table Population and Employment Estimates by County - DRCOG Region Table 4 Proposed 2011 Cycle 1 Amendments to the 2035 RTP Roadway System and Transit System Table 5 Conformity Emissions Test Results LIST OF FIGURES Figure 1 Transportation Management Area... 2 Figure 2 Air Quality Attainment Maintenance Areas vi
7 CHAPTER 1. INTRODUCTION Federal Requirements The Denver Regional Council of Governments (DRCOG) is the Metropolitan Planning Organization (MPO) for the Denver Transportation Management Area (TMA). Figure 1 displays the TMA that now includes southwestern Weld County as approved by the Governor on February 21, The MPO is required to show conformity of its fiscally constrained transportation plan and Transportation Improvement Program (TIP) with the State Implementation Plan (SIP) for air quality before these transportation plans and programs are adopted. This action is required under Section 176(c) of the Clean Air Act, as amended in Conformity to an air quality implementation plan is defined in the Clean Air Act as conformity to the implementation plan's purpose of eliminating or reducing the severity and number of violations of the National Ambient Air Quality Standards (NAAQS) and achieving expeditious attainment of such standards. In addition, activities may not cause or contribute to new violations of air quality standards, exacerbate existing violations, or interfere with the timely attainment of required emissions reductions towards attainment. For pollutants for which a region currently meets standards but was formerly in nonattainment, the applicable SIP may also be referred to as a maintenance plan, which demonstrates continued attainment of the standards. The U.S. Environmental Protection Agency (EPA) final transportation conformity rule is located at 40 CFR Part 93. To address revised standards and changes in conformity requirements, EPA has promulgated several amendments to the final rule in recent years. On July 1, 2004, EPA issued amendments which addressed: Conformity regulations for the 8-hour ozone and fine particulate matter (PM 2.5 ) NAAQS. The incorporation of existing federal guidance that is consistent with a U.S. Court of Appeals decision. The streamlining and improving of EPA s existing transportation conformity rule CFR Part 93 1

8 On March 10, 2006, EPA issued revisions addressing PM 2.5 and PM 10 Hot-Spot Analyses in Project-Level Transportation Conformity Determinations. These project-level conformity analyses are the responsibility of project sponsors. This conformity finding covers plan and program level conformity only. On January 24, 2008 the U. S. Department of Transportation and EPA issued the transportation conformity rule, "Transportation Conformity Rule Amendments To Implement Provisions Contained in the 2005 Safe, Accountable, Flexible, Efficient Transportation Equity Act: A Legacy for Users (SAFETEA-LU)." No changes to the process DRCOG uses in developing conformity documentation were necessary to comply with the transportation conformity rule. The EPA criteria and procedures vary according to the status of the State Air Quality Implementation Plans for individual pollutants. Transportation plans and programs must satisfy different criteria depending on whether the state has submitted a SIP revision, and whether the EPA has approved such submittal. 2
9 In addition to the emissions tests, the region must demonstrate timely implementation of adopted Transportation Control Measures (TCMs). The transportation community is held responsible for implementing TCMs to which the state committed in the various pollutant SIPs. Current Situation Transportation Planning The Metro Vision 2035 Plan is the long-range growth and development strategy for the Denver region. It integrates plans for growth and development, transportation, and environmental quality into a single comprehensive foundation for regional planning. Metro Vision calls for a balanced multimodal surface transportation system, including rapid transit, a regional bus network, a regional beltway, bicycle and pedestrian facilities, and improvements to the existing roadway system. The 2035 Metro Vision Regional Transportation Plan (MVRTP) is the transportation plan that implements the transportation element of Metro Vision. The 2035 MVRTP contains an unconstrained vision plan, outlining the region s transportation needs, as well as the Fiscally Constrained 2035 RTP, which includes those projects that can be implemented given the anticipated level of funding. The 2035 MVRTP and Fiscally Constrained 2035 RTP were adopted on December 19, 2007 and last updated in February The Transportation Improvement Program (TIP) adopted in March 2011, identifies transit, multimodal, and roadway projects to be funded with FY 2012 through FY 2015 federal funds. These projects are described in Chapter 3. The TIP implements the Fiscally Constrained 2035 RTP. Air Quality Planning The status of air quality planning is important as it determines the emissions tests that must be met to find conformity. The latest revision to the carbon monoxide (CO) maintenance plan for Longmont established the emissions budget at 43 tons per day (tpd) for 2010 and beyond. On May 3, 2007, EPA found the revised CO budget of 43 tpd adequate for use in conformity determinations. EPA s approval of this latest Longmont CO Maintenance Plan revision became effective on October 16,
10 The most recent revised CO maintenance plan for Denver, approved by the Colorado Air Quality Control Commission (AQCC) on December 15, 2005, established the emission budget at 1,625 tpd through 2020, and 1,600 tpd for 2021 and beyond. On May 3, 2007, EPA found the revised CO budget of 1,600 tpd adequate for use in conformity determinations for 2021 and beyond. EPA s approval of the revised Denver CO Maintenance Plans became effective on October 16, The State of Colorado submitted the latest Denver particulate matter equal to and less than 10 microns in aerodynamic diameter (PM 10 ) maintenance plan to the EPA in December EPA approved this latest PM 10 SIP Revision on January 7, This latest PM 10 Maintenance Plan revision contains the PM 10 budgets of 54 tpd and 55 tpd for the years 2015 through 2021, and 2022 and beyond, respectively, as well as the wintertime NOx budgets of 70 tpd and 56 tpd for the years 2015 through 2021, and 2022 and beyond, respectively. On October 17, 2006, EPA published a final rule that lowered the 24-hour PM 2.5 standard from the 1997 level of 65 micrograms per cubic meter (μg/m 3 ) to 35 μg/m 3, and retained the annual standard of 15.0 μg/m 3. A violation of the 24-hour standard occurs if the 3-year average of the 98 th percentile of all 24 hour readings exceeds 35 μg/m 3. A violation of the annual standard occurs when the 3-year average of the annual average exceeds 15.0 μg/m 3. The Denver region does not violate either of these PM 2.5 standards. Air Quality Situation The region has been redesignated as attainment maintenance for CO and PM 10. The pollutants and their violation status for the Denver region include: Carbon Monoxide A violation of the carbon monoxide standard occurs when a monitoring station shows more than one exceedance per year of the 8-hour (9 parts per million (ppm)) or 1- hour (35 ppm) standard. The carbon monoxide standard was last violated in There has been no violation for CO in the Denver region since then. PM 2.5 An exceedance of the PM 2.5 standard occurs when a monitoring station exceeds the annual average of 15 μg/m 3 or the 24-hour average of 35 μg/m 3. A violation of the 24-hour standard occurs only if the 3-year average of the 98 th percentile of all 24 hour readings at a 4
11 monitor exceeds 35 μg/m 3 or the 3-year average of the annual averages exceeds 15 μg/m 3. The Denver metropolitan area has never violated either of the two standards. PM 10 An exceedance of the PM 10 standard occurs when a monitoring station exceeds a 24-hour average of 150 µg/m 3. If the 24-hour standard is exceeded more than three times over a three-year period, it is a violation. The PM 10 standard was last violated on three days in There has been no violation for PM 10 in the Denver region since then. 1-Hour Ozone EPA made an adequacy determination of the proposed 8-hour ozone motor vehicle emissions budgets for conformity and the new budgets became effective on March 19, The 1-hour ozone budgets are no longer used for transportation conformity purposes. Process Agency Roles The Conformity SIP was developed by the AQCC and adopted in It formally defines the process for finding conformity. In November / December 1998, a memorandum of agreement was signed by the CDPHE and DRCOG for the purpose of defining the specific roles and responsibilities in conformity evaluations and findings. The EPA approved the Conformity SIP on September 21, 2001 (66FR48561). This makes the Conformity SIP federally enforceable. DRCOG, as the MPO, and the Federal Transit Administration (FTA) and Federal Highway Administration (FHWA), as representatives of the U.S. Department of Transportation, are charged with determining conformity for the Denver TMA. The development of the Fiscally Constrained RTP and TIP conformity determination has been a cooperative process between the RAQC, the Air Pollution Control Division (APCD) of CDPHE, the EPA, the FHWA, the FTA, the CDOT, the Regional Transportation District (RTD), and DRCOG. Public Participation Public participation was encouraged throughout the development of the 2035 MVRTP, including the Fiscally Constrained 2035 RTP, the TIP and this conformity determination. Public hearings (and associated 30-day comment periods) were held before the DRCOG Board for the: 2035 Metro Vision Regional Transportation Plan and its original conformity document on December 5,
12 2035 MVRTP 2008 Cycle 1 amendments and conformity document on July 16, MVRTP 2008 Cycle 2 amendments and conformity document on December 17, MVRTP 2009 Cycle 1 amendments and conformity document on July 15, MVRTP 2009 Cycle 2 amendments and conformity document on December 16, MVRTP Update and conformity documents on December 15, TIP and its conformity document on February 16, MVRTP 2011 Cycle 1 amendments and conformity document on July 20, Summaries of testimony received at public hearings are available at the DRCOG office. Members of the public are also encouraged to provide input to their local elected officials and government staff who work closely with DRCOG staff on these processes. 6
13 CHAPTER 2. IMPLEMENTATION OF CONTROL MEASURES Transportation Control Measures The transportation plan and program must provide for the timely implementation of adopted Transportation Control Measures (TCM) from the applicable implementation plan. The state air quality implementation plan identified a number of TCMs that were funded and completed in past TIPs. The implementation of rail transit was a substantial TCM, first defined in the 1979 Carbon Monoxide SIP and the 1982 Ozone SIP. The region s first segment of light rail, which opened in October 1994, provides service from the downtown area south to Broadway and I-25. The first extension of this service, the southwest corridor, from Broadway and I-25 to Mineral Avenue along Santa Fe Boulevard, opened in July An extension of light rail service into the Platte Valley opened in April Funding came from a private-public partnership that included DRCOG, RTD, the City and County of Denver and the private sector. The southeast corridor light rail transit was completed in November It was the last remaining partially completed TCM. It includes light rail service along I-25 from Broadway south to Lincoln Avenue, as well as a light rail spur along I-225 from I-25 to Parker Road. With the completion of the southeast corridor, the region has 35 miles of light rail transit serving suburban and urban commuters. Beyond the SIP measures, the Fiscally Constrained 2035 RTP and TIP continue funding for transportation demand management (TDM) actions through: The regional RideArrangers commuter services program. A separate TDM grant program that supports localized efforts, including programs proposed by the corridor and subarea transportation management organizations (TMO). The TIP also continues funding to assist in implementation of the FasTracks program, for local bus service initiatives, for bicycle/pedestrian projects at/near future FasTracks stations, and for 13 transit station area master plans. A pool for additional station area and urban center plans was also established. 7
14 The TIP includes funding for Denver traffic signal system updates (beyond the TSSIP program), twenty one bicycle/pedestrian projects, five roadway operational projects, one new roadway capacity project, and one new roadway/transit capacity project (US-36 High Occupancy Toll (HOT)). Timely Implementation Criteria The transportation plan must meet two conditions to demonstrate timely implementation of TCMs: The transportation plan, in describing the envisioned future transportation system, provides for the timely completion or implementation of all TCMs in the applicable implementation plan which are eligible for funding under Title 23 USC or the Federal Transit Act, consistent with the schedule included in the applicable implementation plan. The Fiscally Constrained 2035 RTP identifies the metropolitan transportation system of travel demand actions, operational improvements, and capital-intensive roadway, high-occupancy vehicle, and transit facilities, and contains policies to guide the implementation of the plan. There are no remaining TCM s to be implemented. The Denver Regional Element of the State Air Quality Implementation Plan and the Fiscally Constrained RTP are consistent documents. Nothing in the transportation plan interferes with the implementation of any TCM in the applicable implementation plan. The DRCOG committees and Board review the goals, policies, recommendations, and improvements identified in the Fiscally Constrained RTP. No conflicts exist with any specific requirements in commitments of the adopted SIP. The Fiscally Constrained RTP does not prohibit implementation of any SIP TCM, nor does it make it impossible to implement any SIP TCM. TCMs contained in the SIP, but not directly related to the Fiscally Constrained RTP, given their non-facility planning nature, include the federal Motor Vehicle Emissions Control Program, Inspection and Maintenance Program, stationary source controls, display signs instructing motorists to turn off engines, warranty enforcement, and gasoline high altitude emissions research. The Fiscally Constrained 2035 RTP contains no policies that inhibit the implementation of these measures. 8
15 For a TIP to provide for the timely implementation of TCMs, three criteria must be satisfied: TCMs, which are eligible for funding under Title 23 USC of the Federal Transit Act, are on or ahead of the schedule established in the applicable implementation plan, or, if such TCMs are behind schedule, the MPO and DOT have determined the past obstacles to implementation have been identified and overcome. There are no TCMs remaining from the CO or PM 10 SIPs. If TCMs have previously been programmed, but funds have not been obligated and the TCMs are behind schedule, then the TIP cannot be found to conform if the funds intended for these TCMs are reallocated to projects in the TIP other than TCMs. This situation has not occurred. Programmed funds for TCMs have been obligated. Nothing in the TIP may interfere with implementation of any TCM in the applicable implementation plan. The DRCOG committees and Board review the projects identified in the TIP. No conflicts exist with any specific requirements or commitments of the adopted SIP. The TIP does not prohibit implementation of any SIP TCM, nor does it make it impossible to implement any SIP TCM. 9
16 (intentionally blank) 10
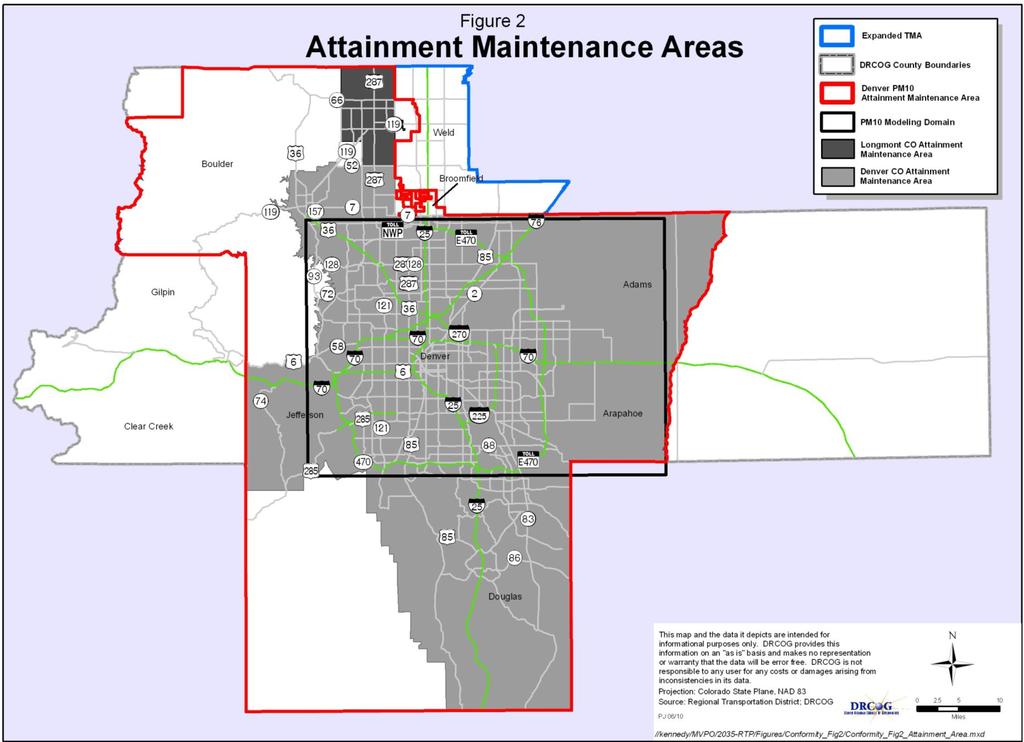
17 CHAPTER 3. EMISSIONS TESTS General Description The transportation plan and program must pass a series of emissions tests to demonstrate conformity. These emissions tests relate to the pollutants and their precursors for which the Denver region is designated as attainment-maintenance of the NAAQS. These pollutants and precursors include: Carbon monoxide (CO) PM 10 Nitrogen oxides (NO x ) as a precursor for PM 10 (wintertime estimate) Each pollutant and precursor in specific geographic areas must pass a number of tests. The plan and program must respect the motor vehicle emissions budget in the applicable SIP or SIP submittal. Satisfying these tests involves demonstrating that relevant emissions in future years are less than or equal to the emissions budget established in the applicable maintenance plan. As required by 40 CFR , consistency with the motor vehicle emissions budget(s) must be demonstrated for each year for which the applicable implementation plan specifically establishes motor vehicle emissions budget(s), for the attainment year (if it is within the timeframe of the transportation plan), for the last year of the transportation plan s forecast period, and for any intermediate years as necessary so that the years for which consistency is demonstrated by analysis are no more than ten years apart. In addition, when a maintenance plan has been submitted, emissions must be less than or equal to the motor vehicle emissions budget(s) established for the last year of the maintenance plan and any year for which the maintenance plan establishes budgets. Applying these tests for the prescribed time periods for each of the pollutants results in 22 emissions tests as listed in Table 1. 2 The analysis areas are shown in Figure 2. 2 Transportation model runs represent the beginning of a calendar year. Test dates listed in Table 1 refer to model run dates. 11
18 Pollutant and Area Carbon Monoxide in Denver Attainment Maintenance Area 3 Carbon Monoxide in Longmont Attainment Maintenance Area 3 PM 10 NO x associated with PM 10 Table 1 Conformity Emissions Tests Tests 2013 staging Budget of 1,625 tpd staging Budget of 1,625 tpd 2020 staging Budget of 1,625 tpd 2021 staging Budget of 1,600 tpd 4, staging Budget of 1,600 tpd Fiscally Constrained 2035 RTP Budget of 1,600 tpd 2010 staging Budget of 43 tpd staging Budget of 43 tpd 2020 staging Budget of 43 tpd staging Budget of 43 tpd Fiscally Constrained 2035 RTP Budget of 43 tpd 2015 staging Budget of 54 tpd staging Budget of 54 tpd 2022 staging Budget of 55 tpd 4, staging Budget of 55 tpd Fiscally Constrained 2035 RTP Budget of 55 tpd 2015 staging Budget of 70 tpd 2020 staging Budget of 70 tpd 2022 staging Budget of 56 tpd 4, staging Budget of 56 tpd Fiscally Constrained 2035 RTP Budget of 56 tpd 3 EPA approval is effective October 16, This is the year the budget was established in the maintenance plan. 5 EPA adequacy finding effective June 28, EPA approval of PM 10 Maintenance Plan, effective January 7,
19 13
20 Technical Process The technical process used to estimate future pollutant emission levels is based on the latest planning assumptions in effect at the time of this conformity determination. Assumptions behind the analysis were derived from estimates of current and future population, employment, travel, and congestion most recently developed by DRCOG. Information concerning vehicle miles traveled and operating speeds were updated as part of this conformity finding process. The above-mentioned factors were used with the EPA emission model (MOBILE 6.2) to estimate emissions. Demographic Assumptions The population forecast for the full DRCOG region in 2035 is 4,348,700. This is an increase of 51 percent over the year 2010 estimated population of 2,885,100. Employment is forecast to be 2,575,900 in 2035 compared to the year 2010 estimate of 1,561,400, an increase of 65 percent. Growth in population and employment will be the principal factor for the increased demand for travel on the region s transportation facilities and services. Table 2 shows the latest forecasts of population and employment for 2010, 2015, 2025, and 2035 for the DRCOG region. Table 3 lists 2010 and 2035 population and employment estimates by each of the nine counties, as well as the southwest portion of Weld County that is within the DRCOG region. Table 2 Population and Employment Forecasts - DRCOG Region DRCOG Region Population 2,885,100 3,132,300 3,706,300 4,348,700 Employment 1,561,400 1,725,600 2,108,400 2,575,900 14
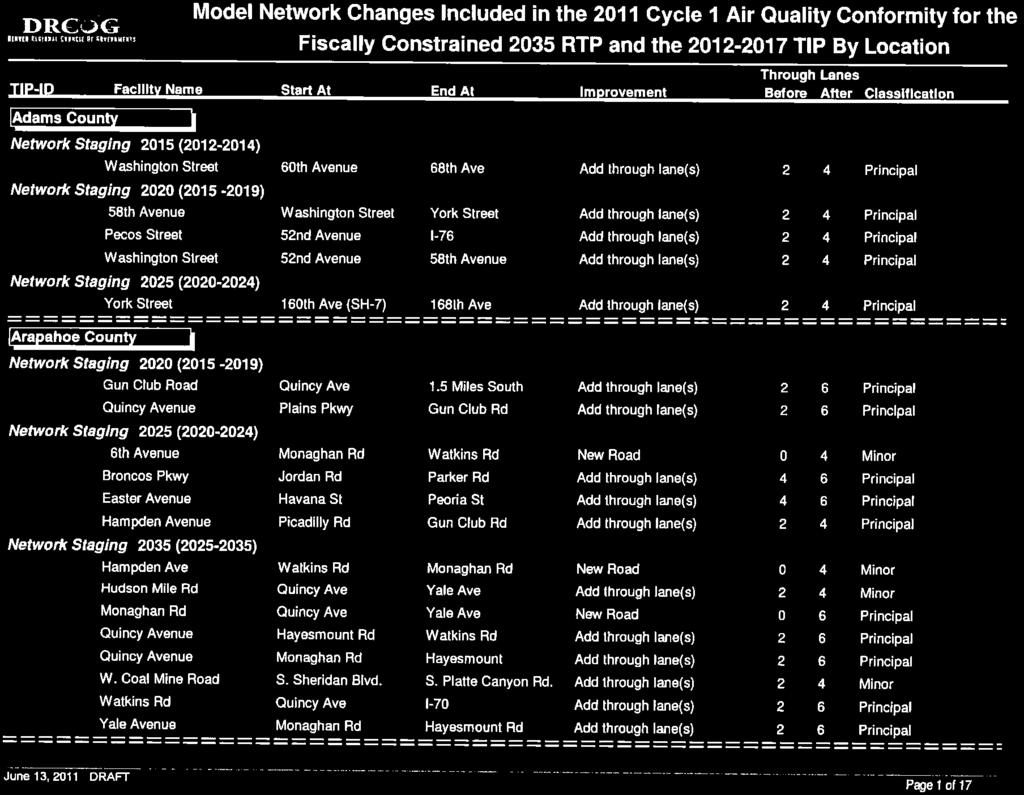
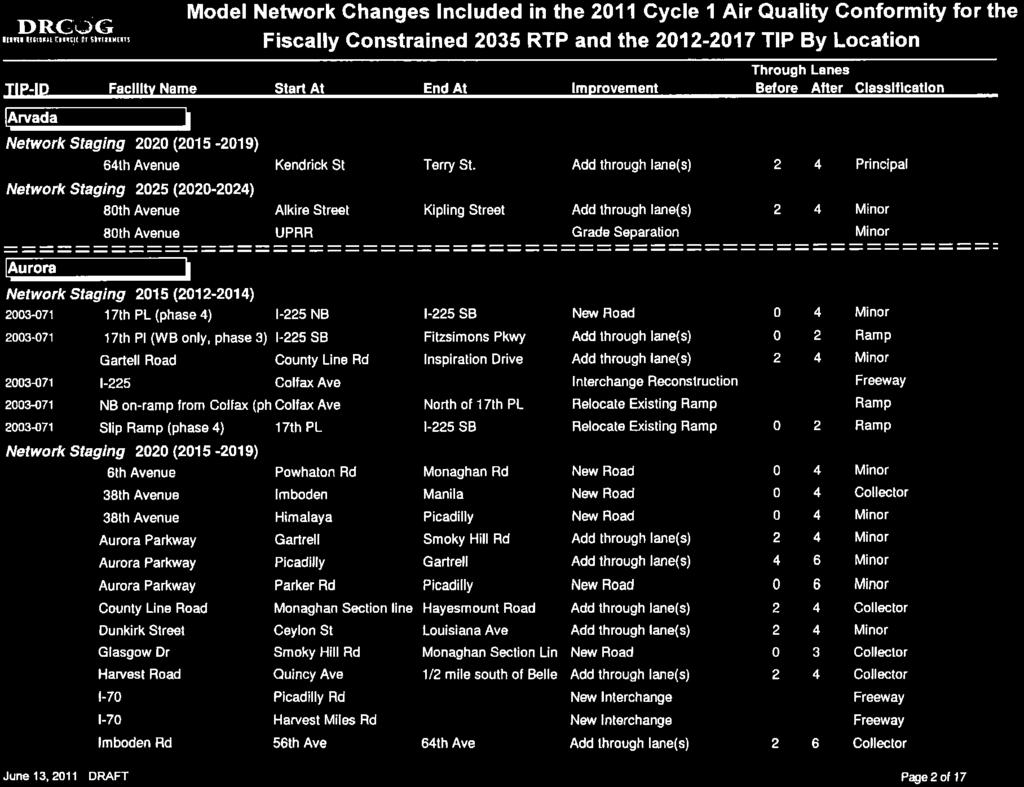
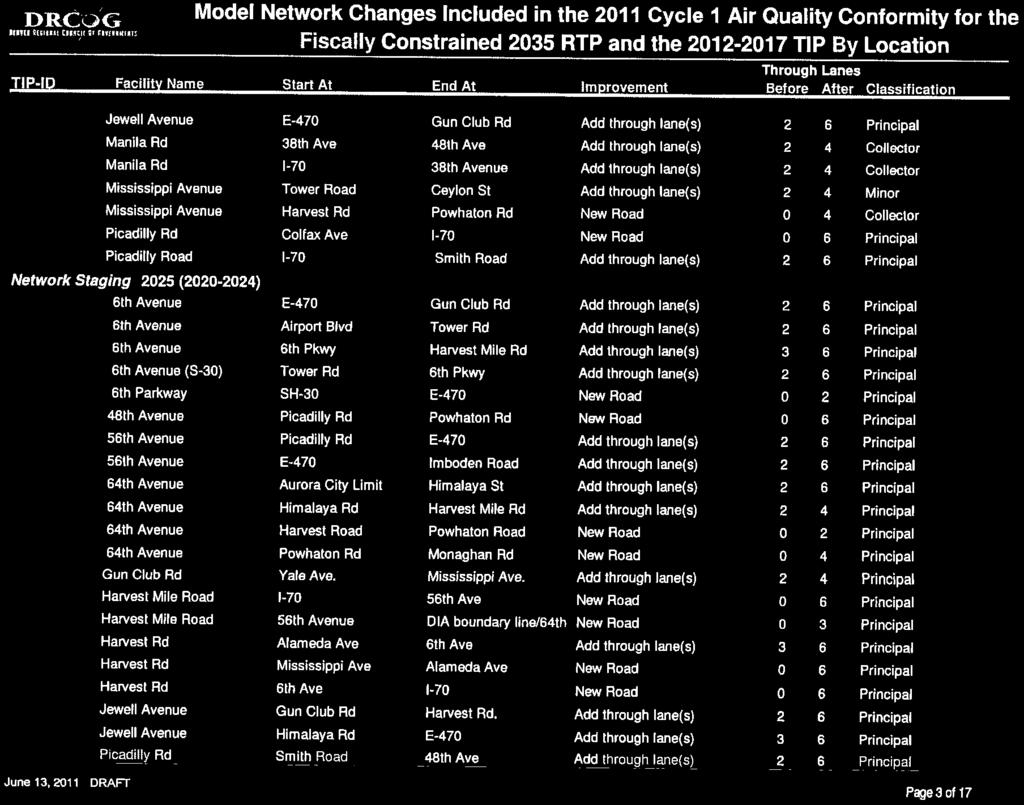
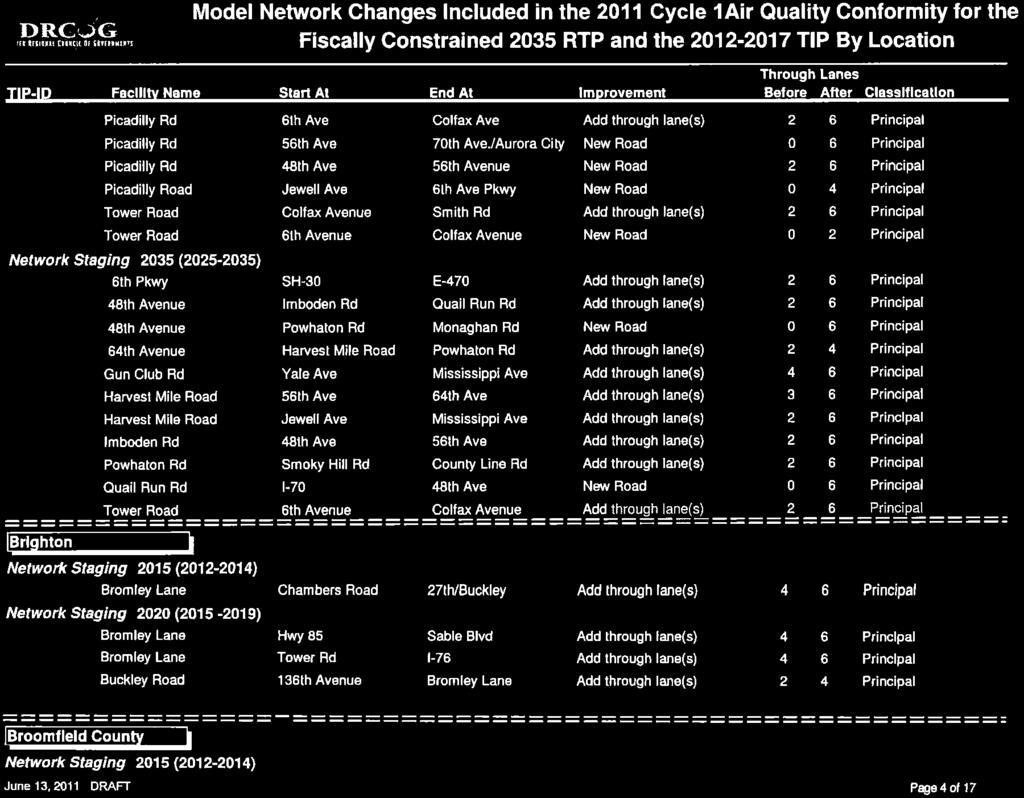
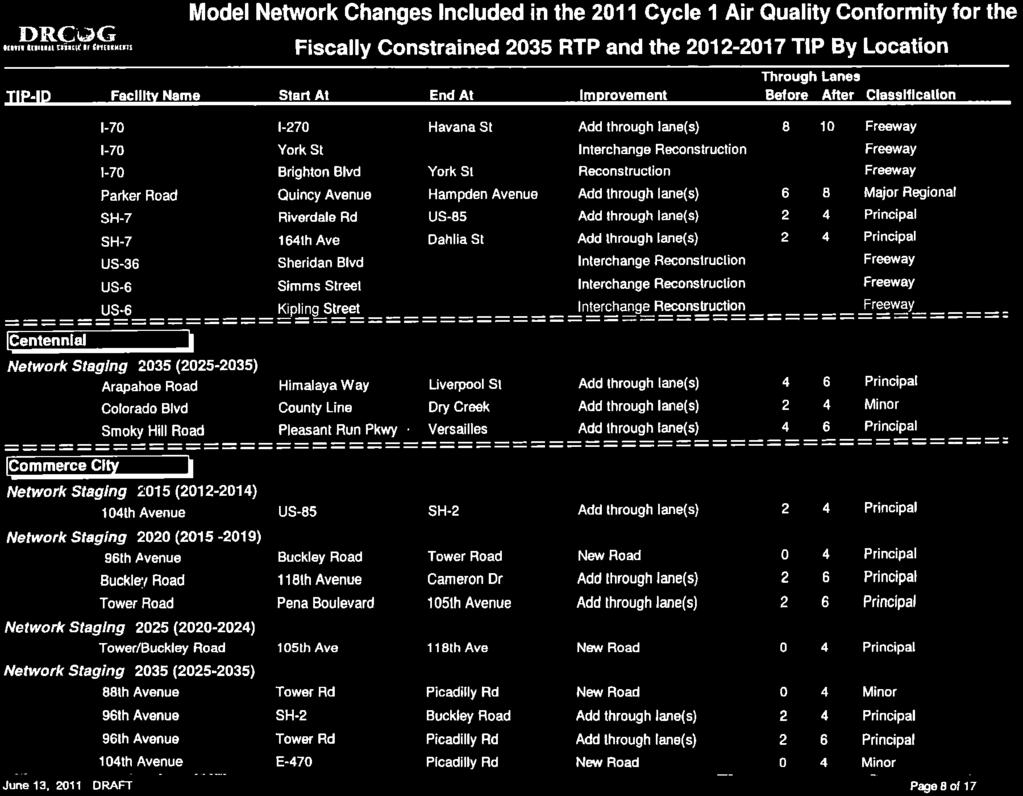
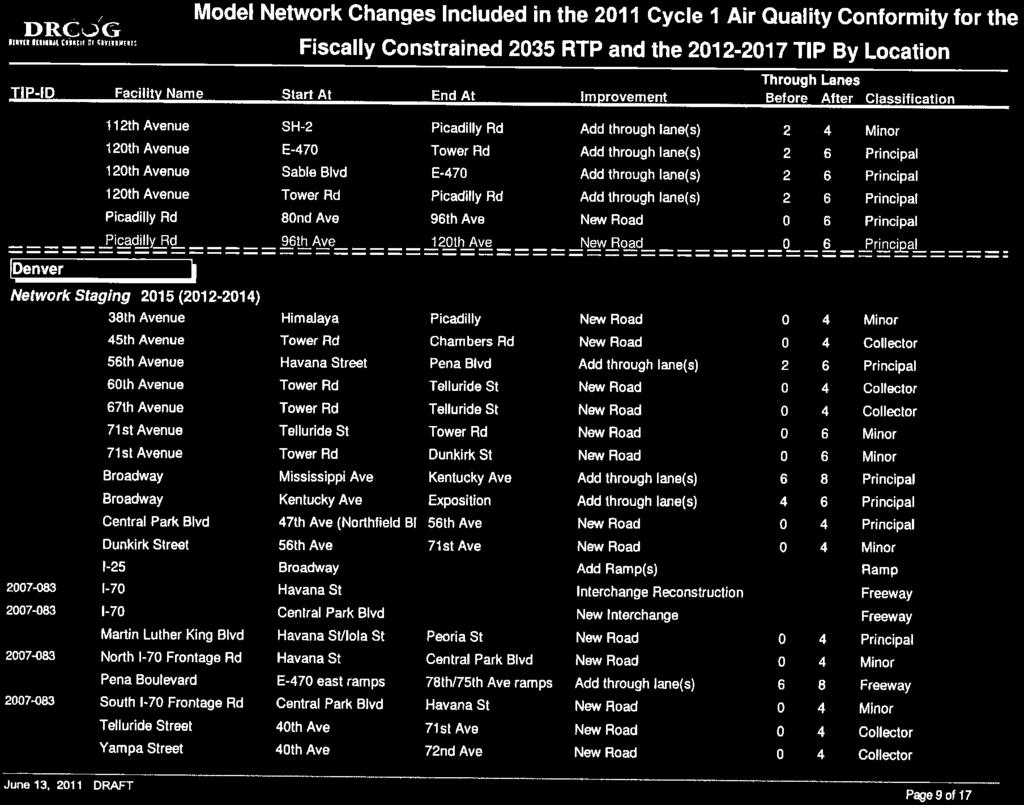
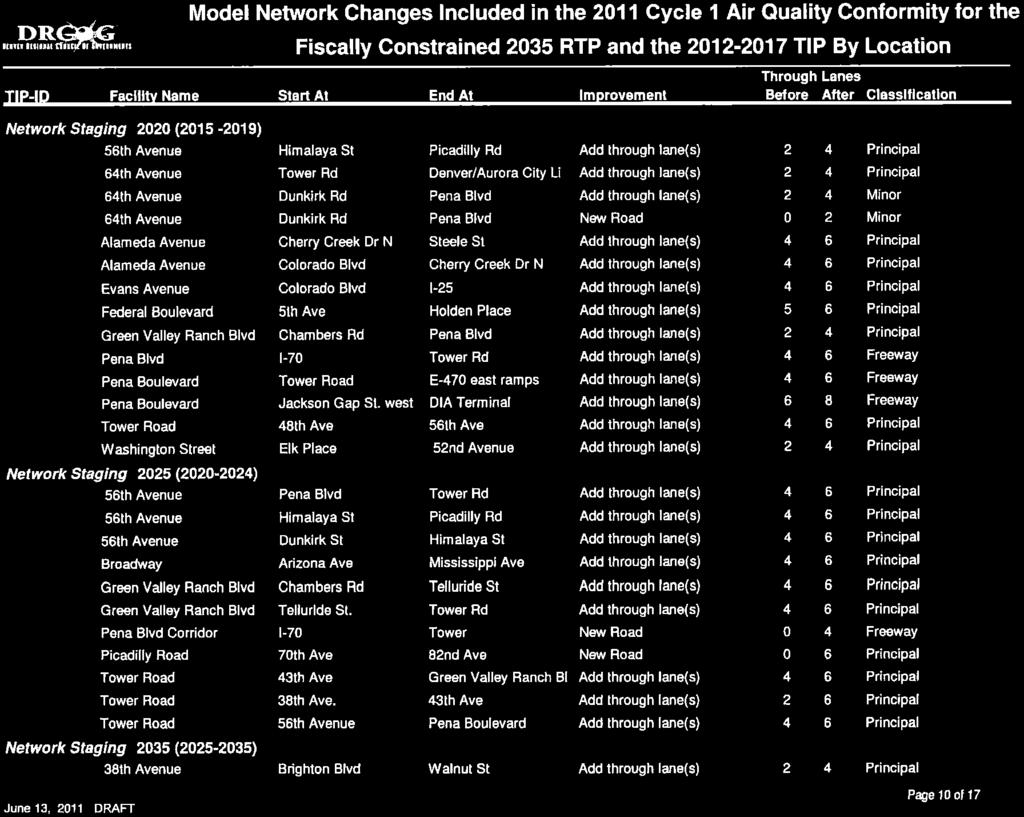
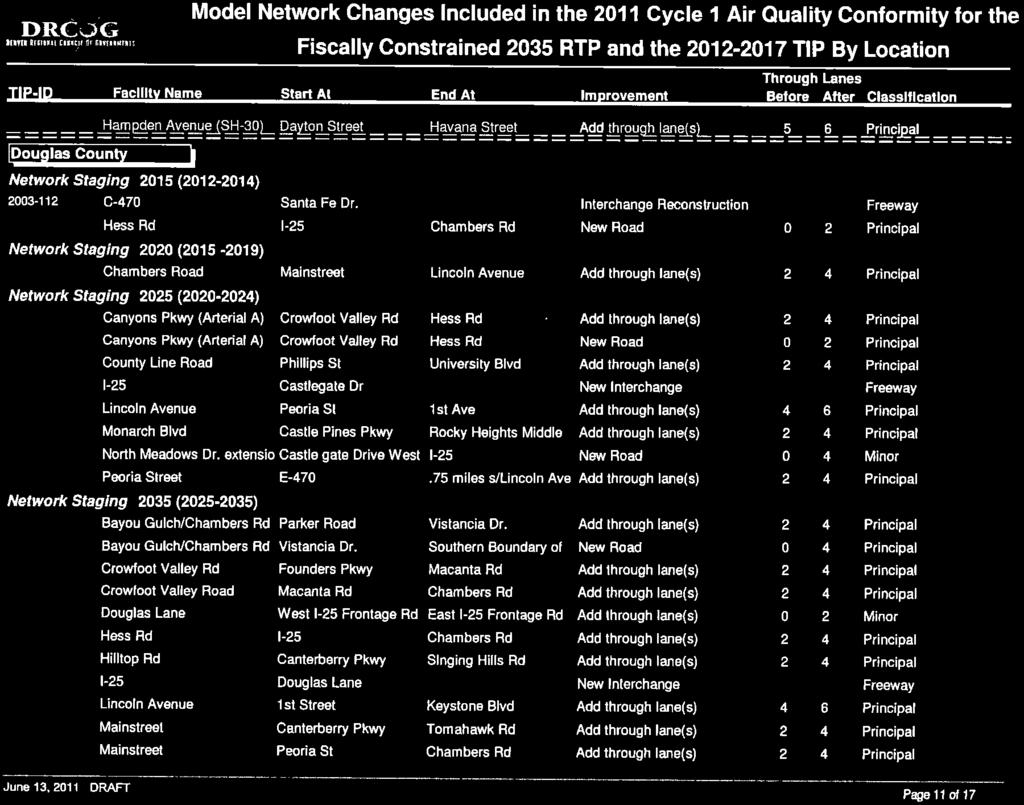
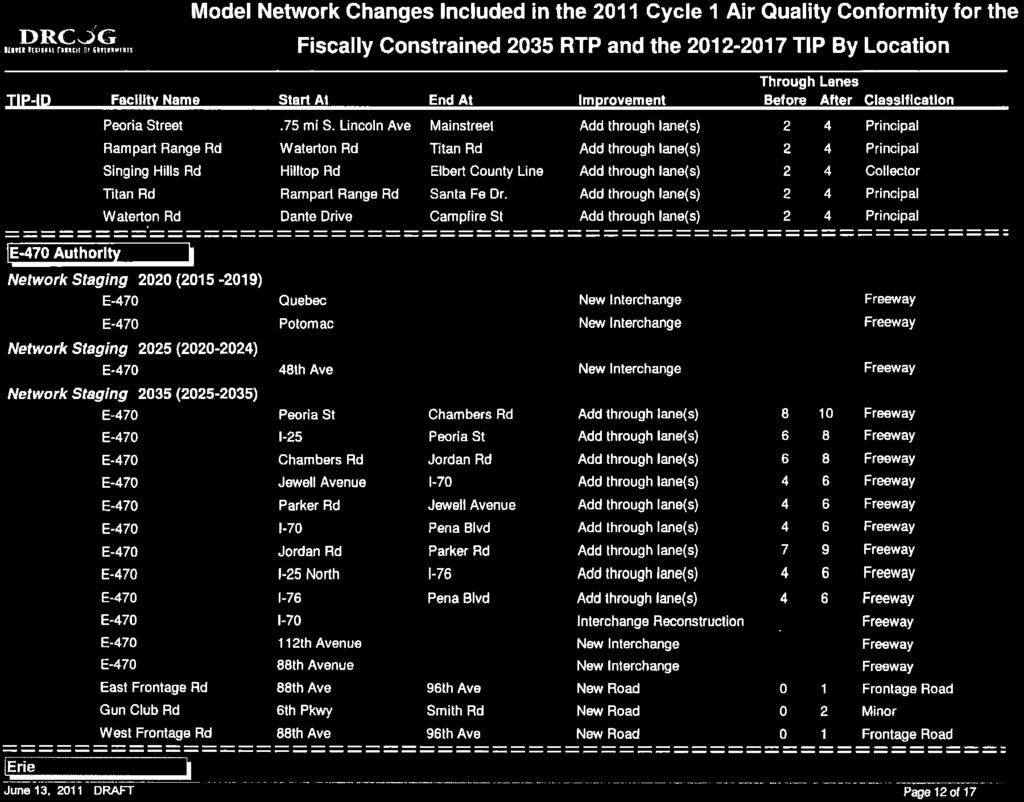
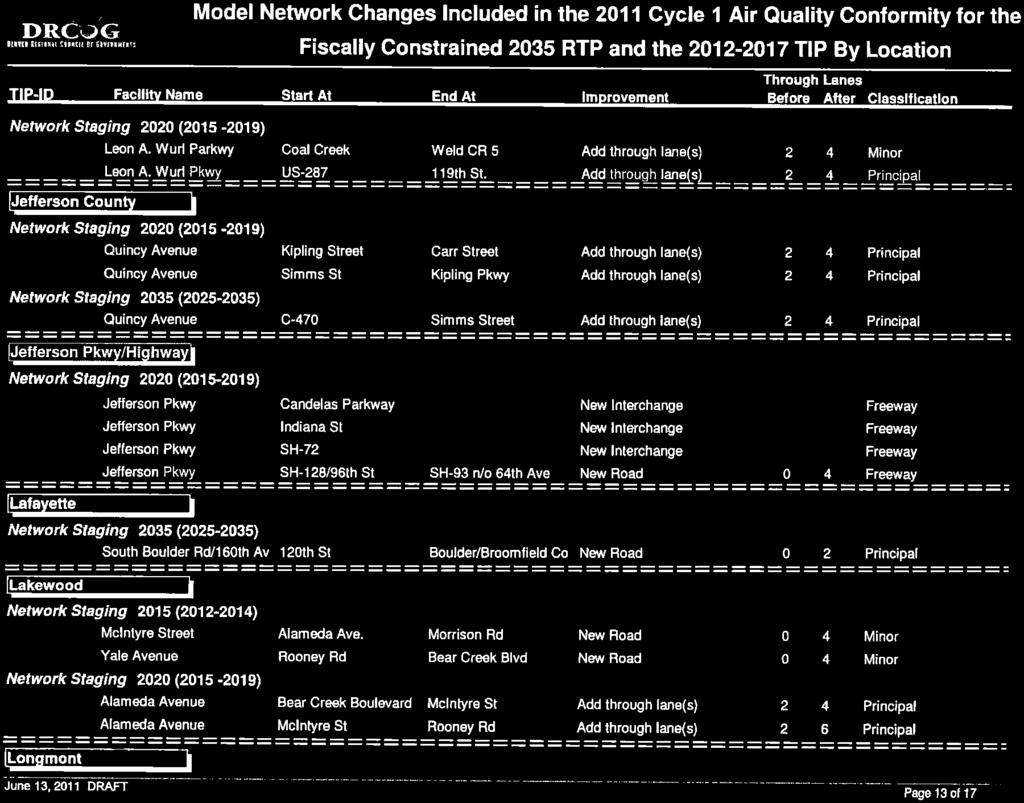
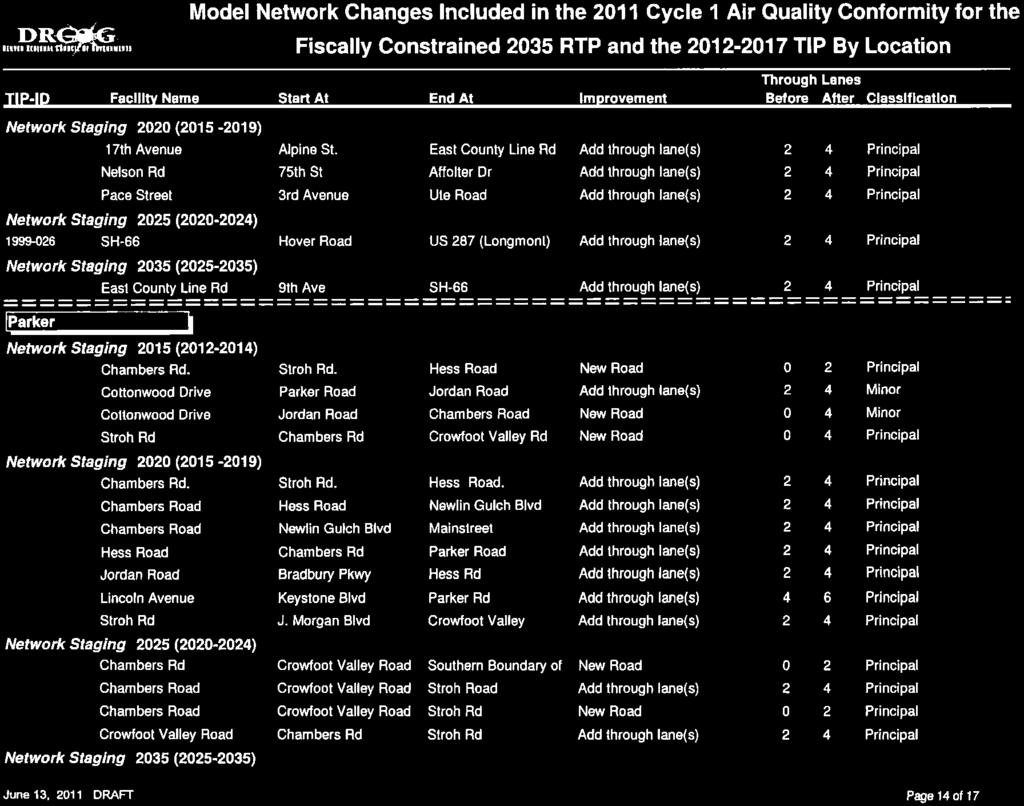
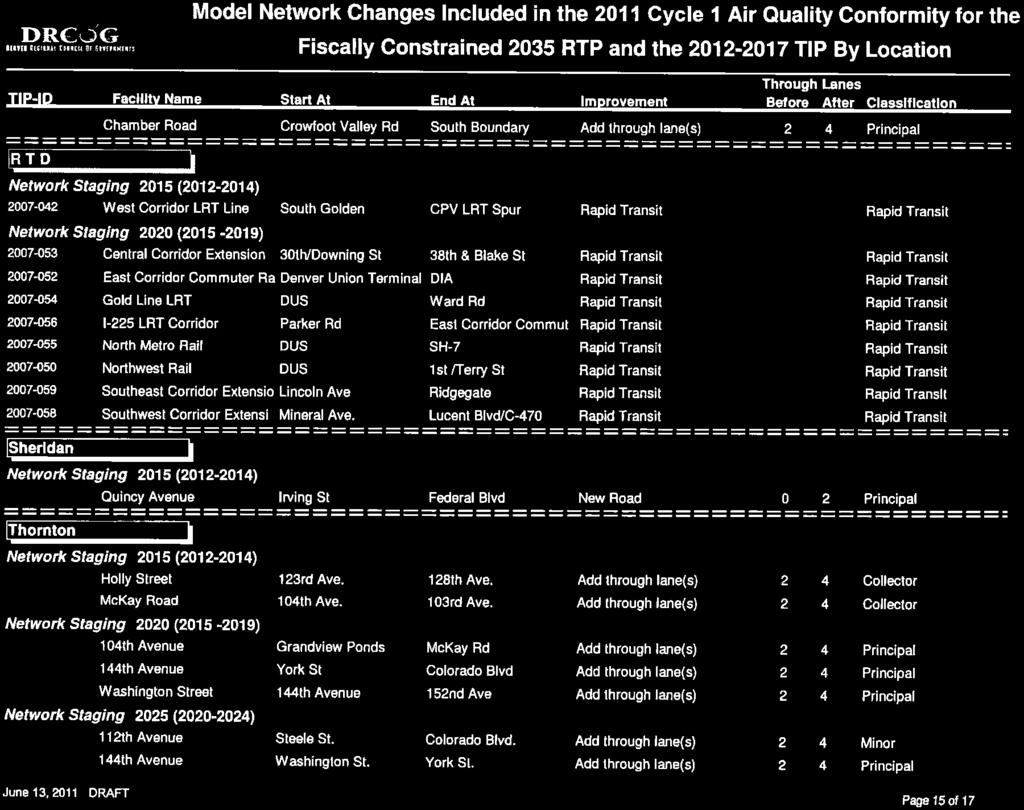
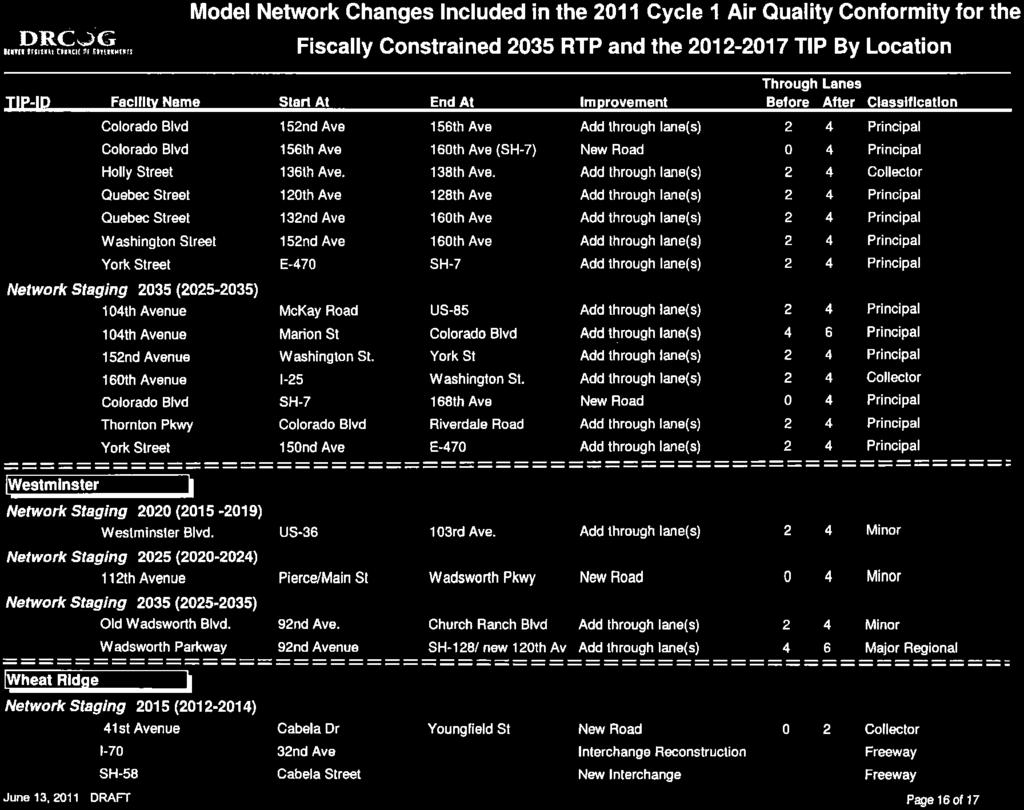
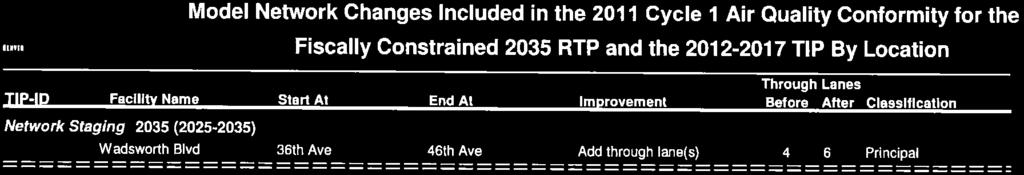
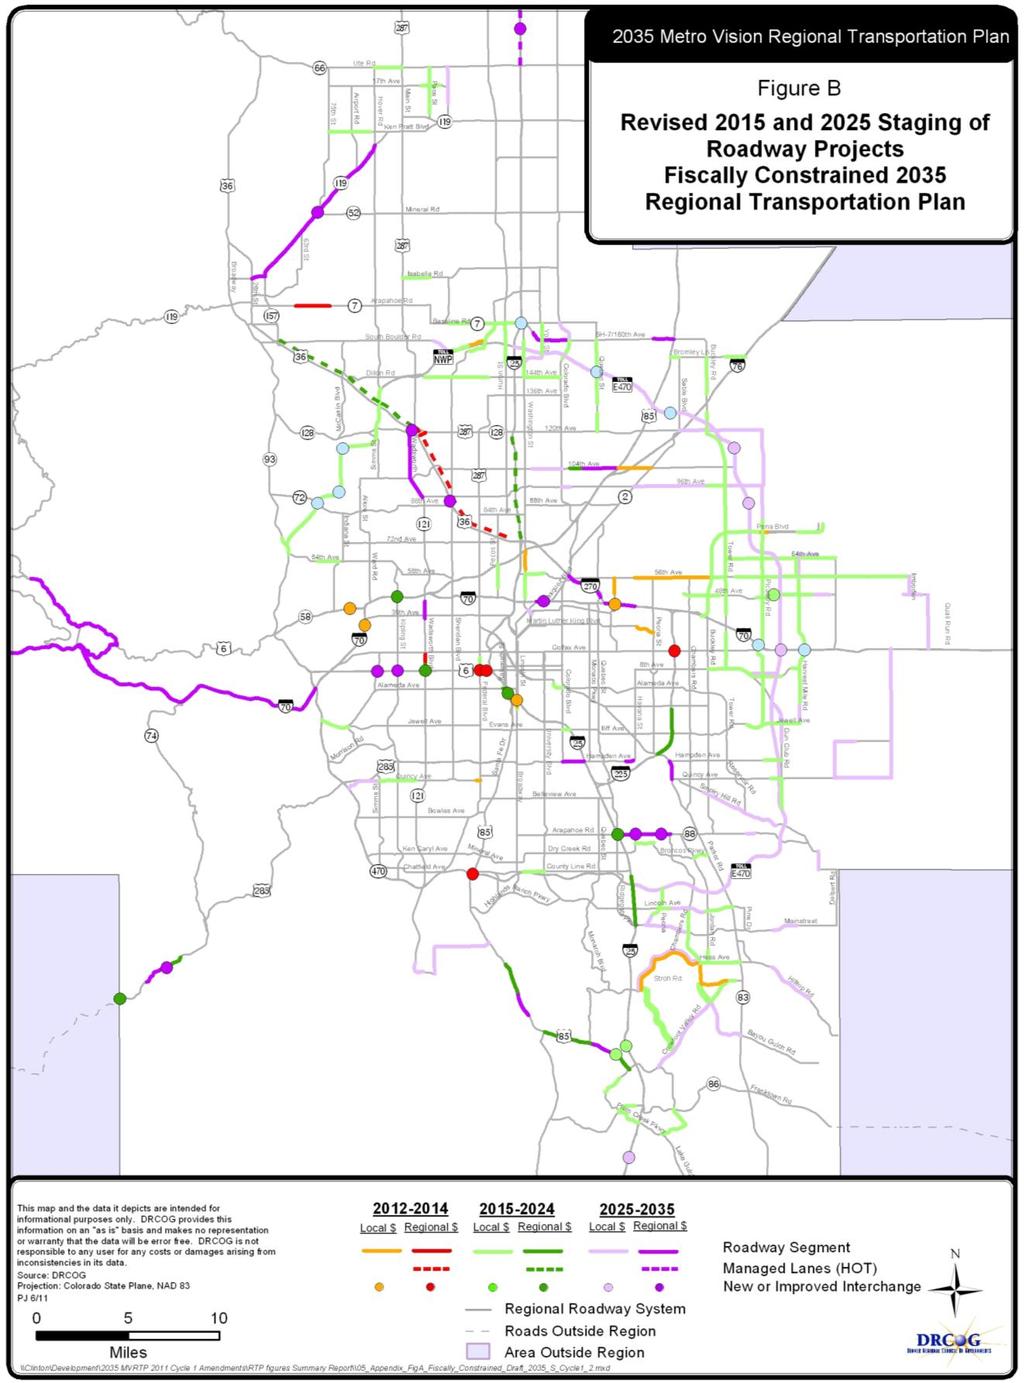
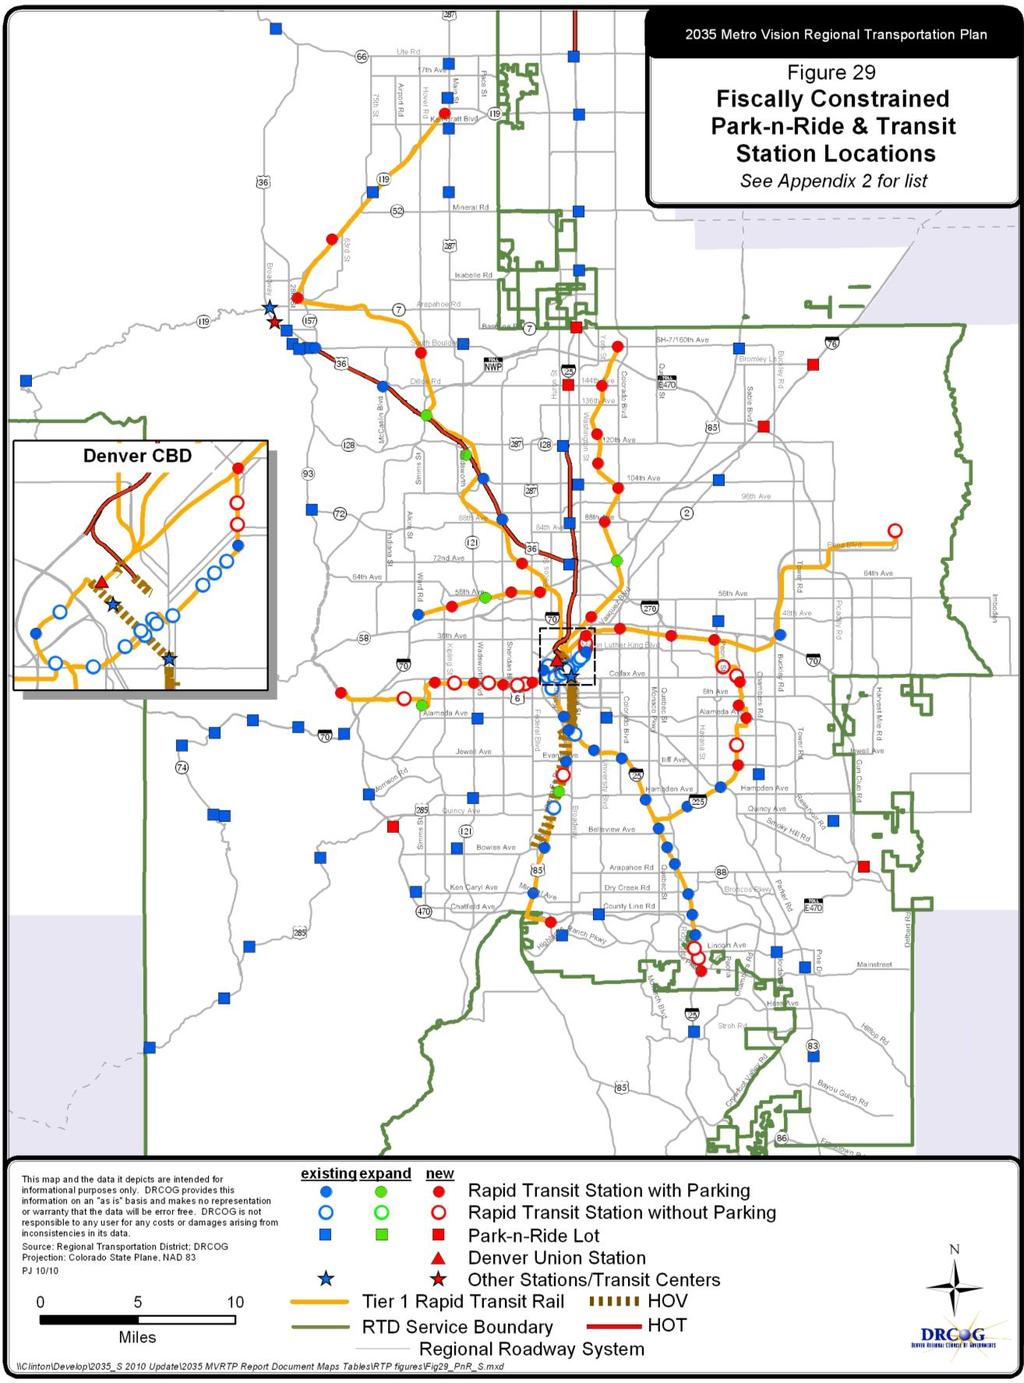
21 County Table Population and Employment Estimates by County - DRCOG Region Population Employment Adams County 459, , , ,100 Arapahoe County 566, , , ,300 Boulder County 306, , , ,100 Broomfield County 51, ,900 33,200 95,500 Clear Creek County 10,300 14,500 3,500 5,300 Denver County 601, , , ,400 Douglas County 281, , , ,700 Gilpin County 5,400 7,900 5,400 6,600 Jefferson County 555, , , ,400 SW Weld in DRCOG 47, ,700 11,000 36,700 Full DRCOG Region 2,885,100 4,348,700 1,561,400 2,575,900 Transportation Assumptions In order to complete the emissions tests, the 2010, 2015, 2025, and 2035 transportation networks must first be defined. DRCOG s Fiscally Constrained 2035 RTP specifies financially constrained highway and transit system improvements and resulting networks to be completed by the year The detailed list of improvement projects by completion year is displayed in Appendix A. The most significant highway projects on the designated regional roadway system are listed below. The TIP includes funding for a number of regionally significant projects that are also contained in the Fiscally Constrained 2035 RTP. They include: US-85 from Cook Ranch Road to Louviers: widen roadway to four lanes. West Corridor, Denver Union Station to Jefferson County Government Center: new light rail, stations, park-n-rides. Gold Line, Denver Union Station to Ward Road: new light rail, stations, park-n-rides. 15
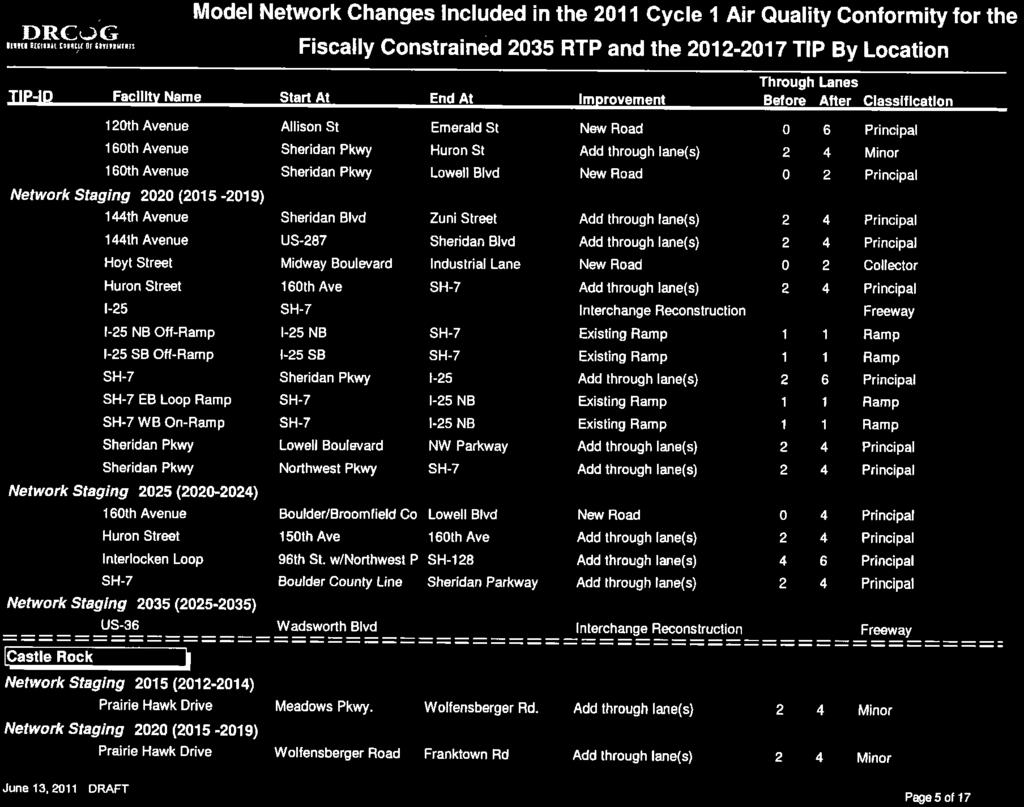
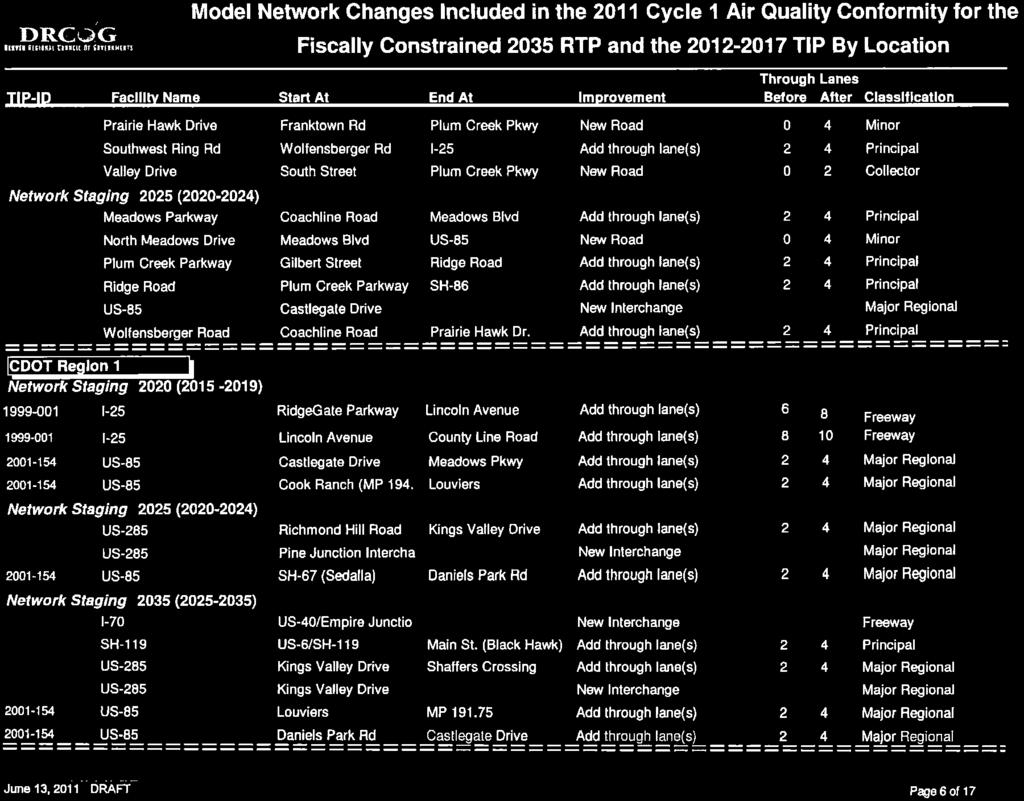
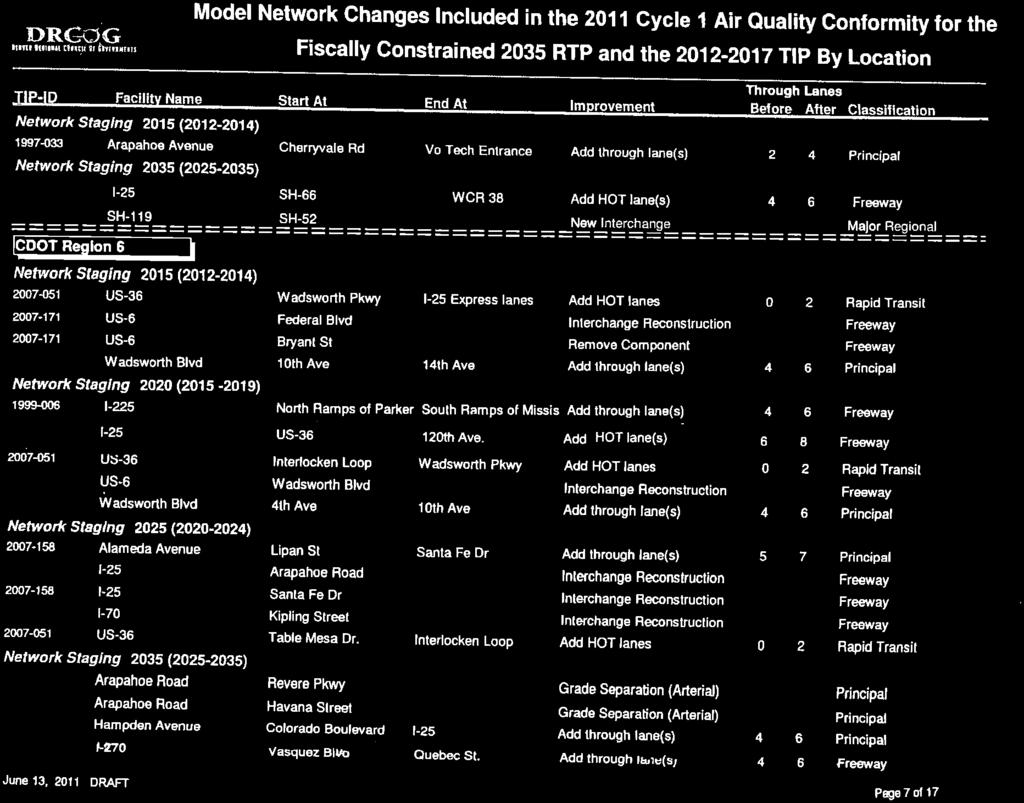
22 I-225 Corridor, Parker Road to Smith Road: new light rail, stations, parking. North Metro Corridor, Denver Union Station to 160 th Avenue: new rail, stations, parking. Southeast Corridor, Lincoln Avenue to RidgeGate Parkway Extension: extend light rail with stations, park-n-ride. Southwest Corridor, Mineral Station to C-470 Extension: extend light rail, new park-n-ride. Northwest Rail, Denver Union Station to Longmont: new rail, stations, parking. Central Corridor, 30 th and Downing to 38 th and Blake: new light rail and stations. East Corridor, Denver Union Station to Denver International Airport: new rail, stations, and park-n-rides. Denver Union Station: intermodal center. 120th Avenue Connection over US-36: build new six lane road. I-25 from Santa Fe to Alameda: interchange reconstruction. US-36 from Interlocken Loop to the I-25 Express Lanes: add two HOT lanes. The TIP also includes many other projects that will help to reduce emissions associated with ozone: Transit operating funds and bus purchases Bicycle and pedestrian facilities Travel demand management programs Intelligent Transportation System (ITS) infrastructure Traffic signal systems and coordination Master plans for areas around transit stations and urban centers Regional highway projects in the Fiscally Constrained 2035 RTP using federal and state resources, in addition to those listed above include: SH-121/Wadsworth Boulevard from 36 th Avenue to 46 th Avenue: widen roadway to six lanes. SH-121/Wadsworth Parkway from 92 nd Avenue to SH-128/120 th Avenue: widen roadway to six lanes. 104 th Avenue from Grand View Ponds to US-85: widen roadway to four lanes. 16
23 I-25 from RidgeGate Pkwy to C-470 South Ramps: widen roadway to 10 lanes. I-70 from Brighton Boulevard to York Street: roadway reconstruction and interchanges. I-70 from I-270 to Havana Street: widen roadway to ten lanes. SH-7 Arapahoe Road from Cherryvale Road to VoTech Drive: widen roadway to four lanes. US-285 Hampden Avenue from Colorado to I-25: widen roadway to six lanes. SH-30 Hampden Avenue from Dayton Street to Havana Street: widen roadway to six lanes. I-25 from US-36 to 120 th Avenue: add two HOV/HOT lanes. I-270 from Vasquez to Quebec Street: widen roadway to six lanes. US-36 at Wadsworth Boulevard: interchange reconstruction. US-36 from SH-157 (Foothills Pkwy) to Interlocken Loop: add two HOV/HOT lanes. I-225 from Parker Road to Mississippi Avenue: widen roadway to six lanes. I-25 from SH-66 to WCR 38: add two HOV/HOT lanes. US-85 from Louviers to MP and from Sedalia (SH-67) to Meadows Pkwy: widen to 4 lanes. Regional highway projects in the Fiscally Constrained RTP using locally-derived funds include: New interchange at I-25/North Meadows Drive in Castle Rock. E-470 from I-25/C-470 to I-25/Northwest Parkway: widen to eight/six lanes, build five new interchanges. New interchange at I-70/Harvest Mile Road. Peña Boulevard from I-70 to DIA: widen roadway to six lanes. Jefferson Parkway from SH-93 to SH-128: new four-lane tollroad, plus 3 partial interchanges. The major proposed 2011 Cycle 1 project amendments to the Fiscally Constrained 2035 RTP roadway network are described in Table 4. These amendments are on I-25 and I-76. All changes (e.g. staging year updates) are depicted in Appendix A. The base 2010 rail rapid transit network includes the existing Central, Southwest, and Central Platte Valley rail lines, and the Southeast light rail line which opened in It also includes 17
24 the I-25 HOV/Tolled Express Lanes, which also opened in 2006, as well as the existing Broadway/Lincoln bus lanes and the existing Santa Fe high occupancy vehicle lanes. The 2015 rapid transit network includes the West rapid transit corridor and the extension of US-36 HOT lanes to just east of East Flatiron Circle. All the remaining corridor lines that were approved by voters in RTD s FasTracks plan on November 2, 2004 are assumed to be completed by 2020 except for the US-36 HOT lanes from Interlocken Loop to Boulder. Other than the staging year adjustments there are no other changes to the rapid transit system. The proposed 2011 Cycle 1 project amendment to the Fiscally Constrained 2035 RTP transit network is described in Table 4. The amendment is associated with the North Metro FasTracks station change. 18
25 Table 4 Proposed 2011 Cycle 1 Amendments to the 2035 RTP Roadway System and Transit System Sponsor Project Location Current RTP Project Description Type of Change to the FC-2035-RTP 2009 Existing Lanes Proposed 2035 Lanes Model Network Staging Colorado High Performance Transportation Enterprise I-25: US-36 to Thornton Parkway I-25: Thornton Parkway to 120th Avenue Add two general purpose lanes n/a Change description: Add two HOT lanes - Interim tolled express lanes (TELs) - Other general purpose, safety and operational improvements identified in the PEL study - Full EIS TEL buildout after Colorado High Performance Transportation Enterprise I-25: SH-66 to WCR 38 Add two general purpose lanes Change description: Add two HOT lanes - Interchange reconstruction at WCR Brighton I-76: Bridge Street Interchange New Interchange Delete project (1601 system study not complete) n/a n/a n/a Sponsor Project Location Current RTP Project Description Type of Change to the FC-2035-RTP Model Network Staging Total 2035 Spaces RTD FasTracks North Metro Corridor: Station in Commerce City Existing park-n-ride located at US-85/72nd Avenue (83 parking spaces) Change station location to 72nd Avenue at North Metro rail line; close existing park-n-ride
26 DRCOG s regional travel model was used to perform the travel forecasting. A summary description of the model is included in Appendix B. A more detailed description is documented in the DRCOG Focus Transportation Model Documentation and in a metadata report. Additional documentation is available on the assumptions and operation of the socio-economic model. These reports and papers are available for inspection at the DRCOG offices. This model includes a number of assumptions, which are supported by current regional experience. One set of modeling assumptions concerns transit operating policies. The model assumes that RTD will keep transit fares constant in current dollars. This is a logical assumption as RTD has an adopted policy of increasing fares in line with increases in the Consumer Price Index. Modeled fares for proposed new services are based on the most similar existing services. The model assumes that RTD would continue with its current approach in setting service levels for various areas of the region. RTD last increased its fares in January The model assumes that the Northwest Parkway Authority and the E-470 Authority will continue to charge tolls on their facilities on a per-mile cost basis in constant dollars similar to current charges (16 cents per mile in 1996 dollars). The proposed Jefferson Parkway is assumed to have comparable tolls. Parking costs in downtown Denver were varied using the Denver parking cost model, which uses employment density and estimates of parking supply as variables. Parking costs were established outside the Denver Central Business District by surveying current parking costs for work and non-work trips, and assuming that these would remain constant over time. Appendix A contains the complete list of modeled transportation improvement projects within the DRCOG regional travel model. Air Quality Modeling Assumptions The APCD of the CDPHE estimates air pollution emissions using Mobile 6.2. The conformity analysis began in April 2011 after identification by RTD, CDOT, and local governments of projects they would be submitting for inclusion. The models and assumptions used by APCD in the conformity analysis were consistent with those used in the development of the CO and PM 10 SIPs. The technical support documentation for each of these SIPs is available at 20
27 Control Measures There are several actions or projects described or assumed in the SIPs that are federally enforceable control measures. PM 10 street maintenance actions are one such control measure. PM 10 Street Maintenance Actions DRCOG must demonstrate that future year estimates of PM 10 emissions will be less than or equal to the maintenance PM 10 emissions budgets to show conformity with the PM 10 SIP. The mobile source PM 10 budgets are 54 tons per day (tpd) through 2021, and 55 tpd for 2022 and beyond. AQCC Regulation 16 is essential to the control of mobile source emissions. Adopted on August 15, 1991, the regulation has undergone several revisions, with the latest occurring on April 19, Re-entrained road dust in the Denver metropolitan area from winter street sanding causes between 40 and 60 percent of PM 10 emissions. It is the single largest contributor to PM 10 emissions 7. Regulation 16 targets street sanding and sweeping practices. Since October 1, 1991, street sanding material providers have been required to meet set standards for the sanding materials they provide to state, city and county governments. The regulation applies to both new and recycled sanding materials. All materials must meet requirements regulating their angularity, percent fines and degree of durability. The burden of material testing to meet these standards falls on the private companies supplying the materials. An independent laboratory must conduct all testing. Reductions in the applied amount of sanding material are also set for all of the local governments and street maintaining agencies (CDOT, RTD, E-470 Authority, Northwest Parkway Authority) within the nonattainment area. A reduction of 30 percent from their 7 In June 1998, the Colorado Department of Transportation, with technical assistance of Midwest Research Institute, concluded a study of the role of sand in PM 10 emissions. Findings from this study demonstrated that the percentage of the total PM 10 emissions from road traffic that consist of road dust increases from about 50 percent to as much as 80 or 90 percent during the high impact 24-hour period following road sanding. Previously, the PM 10 emissions analysis had been using a sand share of 33.8 percent or about half of the recent study findings. Increasing the role of sand in producing PM 10 emission increases the benefits of reduced street sanding. Over the past few years, local governments, CDOT, RTD and the E-470 Public Highway Authority have made major strides to reduce PM 10 emissions from street sand by reducing the amount of sand spread on the streets during snow storms by about 40 percent from 1989 street sanding levels and increasing the sweeping of sanded streets within four days of each snow storm from none to 40 percent. 21
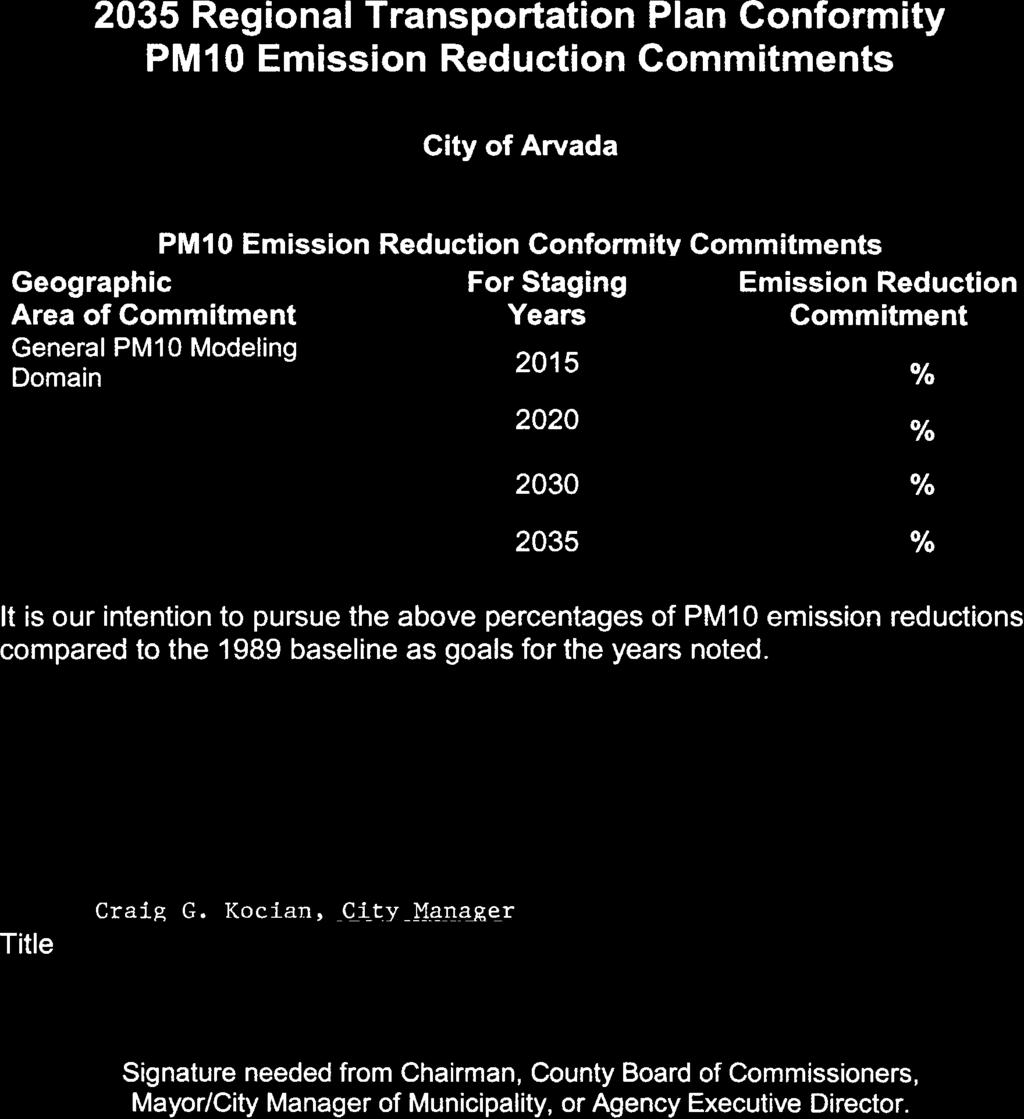
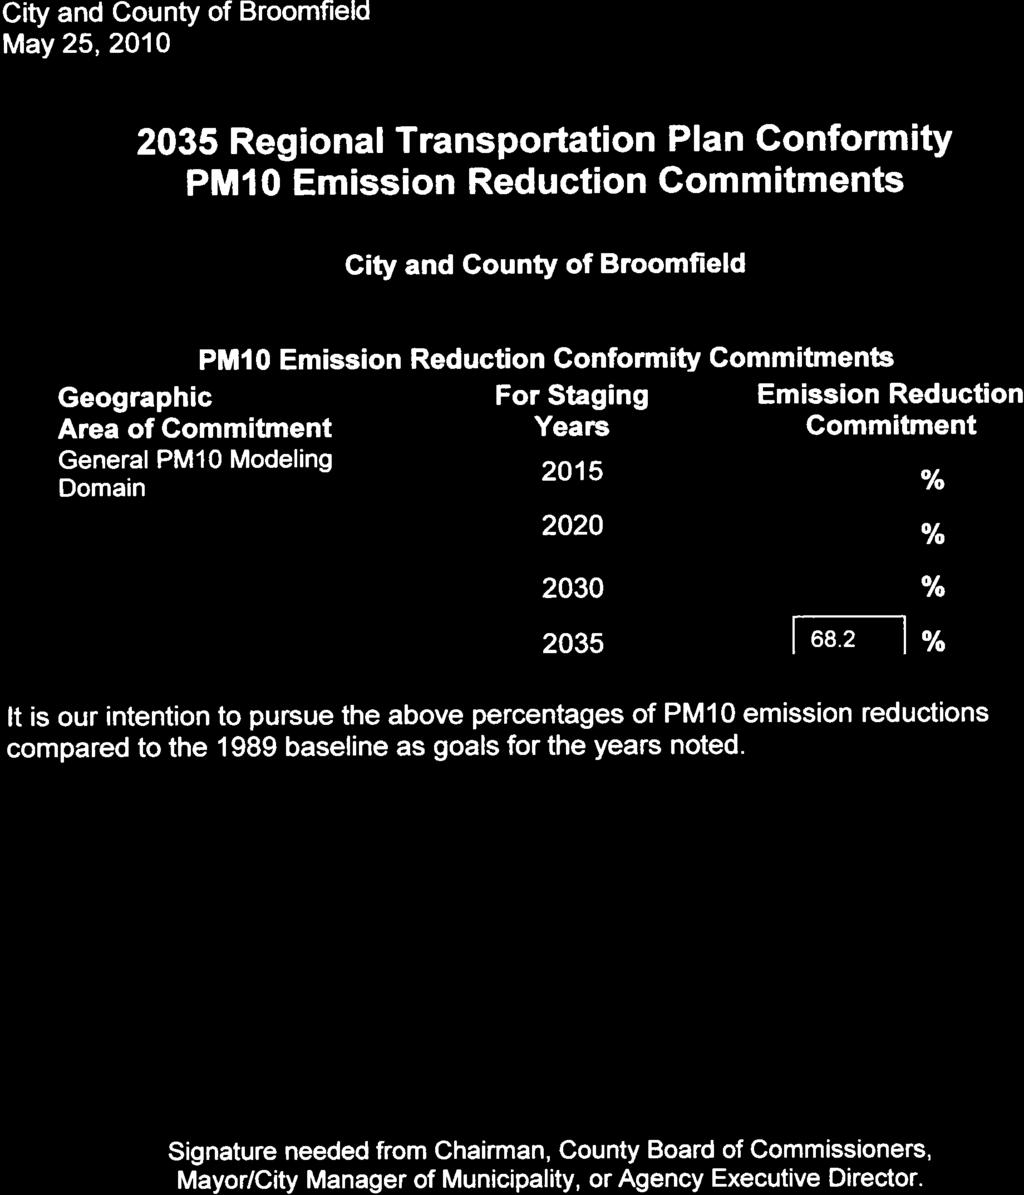
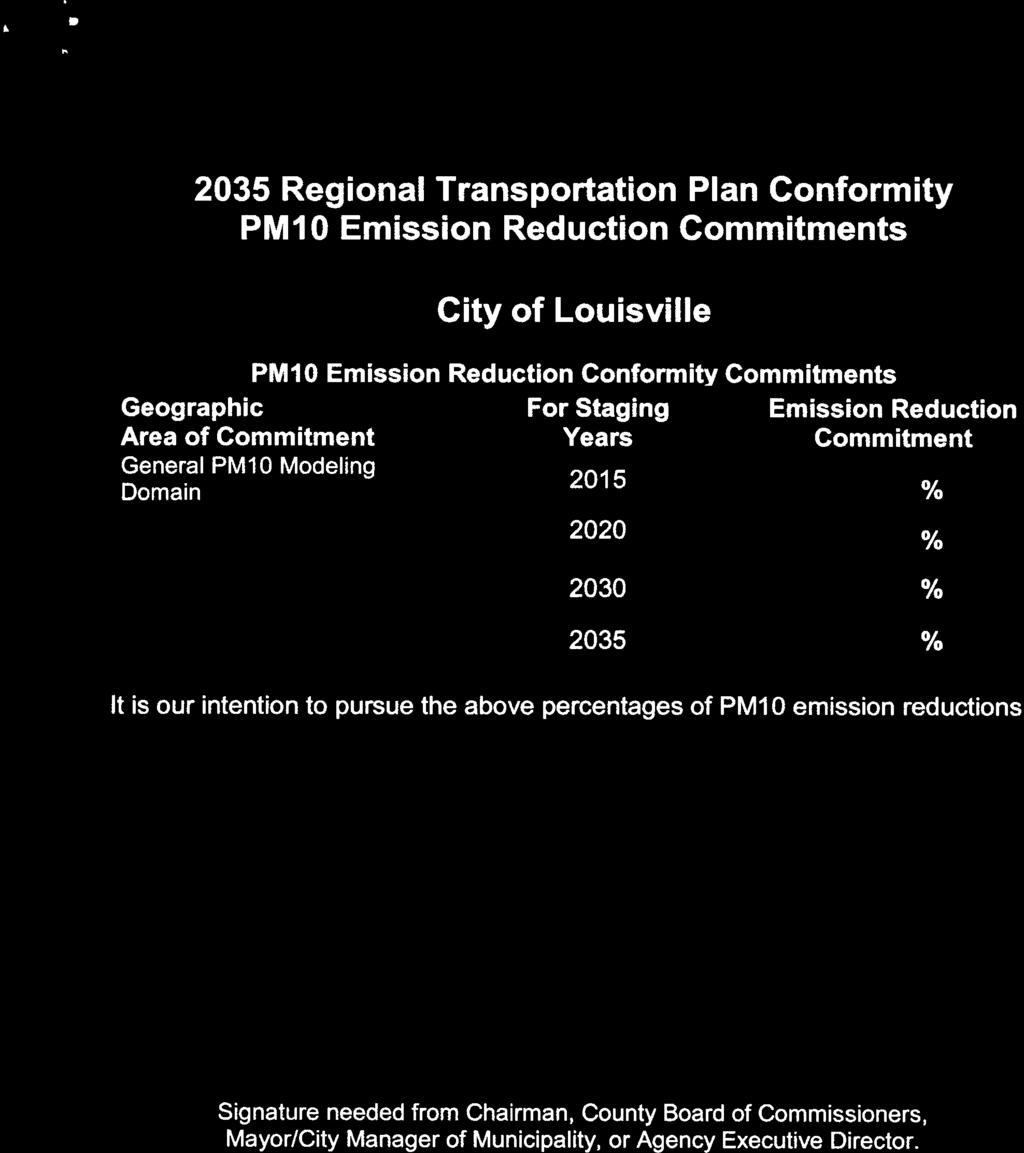
28 established baseline amount is mandated. Baseline amounts are typically based on 1989 practices. In the defined foothills area, a 20 percent reduction from the established baseline is mandated. In addition to the above requirements, there are specific requirements to the City and County of Denver and CDOT: The City and County of Denver shall achieve a 72% reduction within the Denver central business district (CBD). The CBD is defined as the area bounded by and inclusive of Colfax Avenue, Speer Boulevard, Wynkoop Street, 20th Street, and Broadway. CDOT shall achieve a 54% reduction from Interstate 25 and its entrance/exit ramps between 6th Avenue and University Boulevard. The City and County of Denver and CDOT shall achieve a 50% reduction on roadways within the area bounded by, and including, Federal Boulevard, Downing Street, 38th Avenue, and Louisiana Avenue. Records and reports of the reductions and practices used must be submitted yearly to the APCD and the RAQC. Finally, Regulation 16 sets rules for street sweeping to achieve reductions in PM 10 emissions. These rules include time requirements for sweeping after deployments of street sanding materials, definition of the sweeping techniques to be used and targeted areas for increased sweeping. Record keeping and reporting of dates, equipment use and areas swept are required under these rules. Preliminary estimates of 2035 emissions indicated that PM 10 emissions would be higher than the 55 tpd emissions budget after accounting for the impacts of Regulation 16. Because of this anticipated exceedance of the PM 10 emissions budget, local governments and road agencies were asked to provide commitments to further reduce emissions as part of the RTP update. These commitments are for additional reductions in sand application and an increase in street sweeping activities, above and beyond Regulation 16, to further reduce mobile source PM 10 emissions. By July 2010, 40 agencies submitted their new commitments to DRCOG. Actions that can be employed to achieve PM 10 reductions include: Reducing the total amount of sanding materials used. Using anti-icers, deicers, and other sand substitutes in place of sanding materials. Street sweeping within four days of each snow event. 22
29 The local governments and agencies have decided on the combination of the above actions to meet their commitments. The street sanding and sweeping commitments made by local governments and road agencies in 2010 are detailed in Appendix C. With these commitments, the mobile source PM 10 emissions estimate shows emission levels of 41.0 tpd in This is less than the mobile source PM 10 emission budget of 55 tpd. The Fiscally Constrained 2035 RTP identifies approximately $50 million over a 24-year period in CMAQ and local match funds for air quality programs and purchases. Some of this $50 million will fund additional sweeper and deicer equipment. The PM 10 maintenance plan also identifies a test whereby the region must demonstrate that transportation construction emissions do not exceed those assumed in the emissions budgets. The budgets were established on the assumption that all of the facilities in the Fiscally Constrained 2020 RTP, the RTP in effect at the time the PM 10 SIP was adopted, would be constructed at rates of 11.4 lane-miles per year for freeways and 62.7 lane-miles per year for major regional and principal arterials. To pass the test, the rate of lane-mile construction proposed in the Fiscally Constrained 2035 RTP must be less than or equal to the rate of construction in the Fiscally Constrained 2020 RTP. The rate of construction for the Fiscally Constrained 2035 RTP is about 8.8 lane-miles per year for freeways/tollways and 34.8 lanemiles per year for major regional arterials and principal arterials. Thus, the construction emissions of the Fiscally Constrained 2035 RTP are less than the construction emissions assumed in the budgets and the test is passed. Mobile Source Measures The regional emissions analysis does not reflect the air quality benefits of such travel demand management programs as DRCOG s RideArrangers Program, Teleworking, EcoPass, and other transportation demand management actions. In addition, other programs whose benefits are more difficult to ascertain are not fully incorporated into the model. Examples of such programs include compressed workweeks and programs initiated after The model does include emissions reduction benefits created by the regional Traffic Signal System Improvement Program (TSSIP), which is a program in the TIP. The goal of this 23
30 program is to ensure that the region s traffic signals operate in a safe manner that makes the most efficient use of arterial street capacity. The efficiency objectives include: Minimizing vehicle stops. Minimizing travel delay. Minimizing disruption caused by malfunctioning equipment. The major components of the TSSIP include: A capital improvement program that provides intersection control equipment and installs communications links to allow signals to operate as a system. A program to retime signals in a coordinated fashion to improve corridor travel time through accomplishment of the above objectives. Emission Test Results The results of emissions tests are reported in Table 5. The emissions estimates were generated by APCD using transportation inputs and emissions models. The test results do not indicate any failures in the horizon years of the program or plan that would lead to a finding of non-conformity. A qualitative test is required for years prior to 2013 in Denver for carbon monoxide. The regional carbon monoxide estimate for 2005 is 1,517 tpd, which is less than the CO SIP estimate of 1,614 tpd in The 2013 carbon monoxide estimate is 1,274.3 tpd, which is below the budget of 1,625 tpd. The carbon monoxide emissions for years prior to 2013 should then be lower than the budget. No other factors (such as stationary sources) are expected to cause a violation. Qualitative assessments for years prior to 2015 are required for PM 10. The region is currently significantly below the federal health standard. The 2015 estimate for direct PM 10 is 30.5 tpd and 47.7 tpd for NO x associated with PM 10, both of these estimates are below the 54 tpd direct PM 10 and 70 tpd NO x budgets. No violation is expected for years prior to The emissions test results for the Denver region are below all of the budgets listed in Table 1. 24
31 Table 5 Conformity Emissions Test Results Pollutant and Area Carbon Monoxide in Denver Attainment Maintenance Area Test 2013 Staging Budget Staging Budget 2020 Staging Budget Staging Budget Staging Budget 11 Fiscally Constrained 2035 RTP Budget Result<Budget (tons per day) 1,274.3 < 1,625 1,183.0 < 1,625 1,178.9 < 1,625 1,178.1 < 1,600 1,213.7 < 1,600 1,252.6 < 1,600 Pass/Fail Pass Pass Pass Pass Pass Pass Carbon Monoxide in Longmont Attainment Maintenance Area 2010 Staging Budget 2015 Staging Budget 2020 Staging Budget Staging Budget 13 Fiscally Constrained 2035 RTP Budget 36.6 < < < < < 43 Pass Pass Pass Pass Pass PM Staging Budget 2020 Staging Budget Staging Budget Staging Budget 16 Fiscally Constrained 2035 RTP Budget 30.5 < < < < < 55 Pass Pass Pass Pass Pass NO x associated with PM Staging Budget 2020 Staging Budget Staging Budget Staging Budget 19 Fiscally Constrained 2035 RTP Budget 47.7 < < < < < 56 Pass Pass Pass Pass Pass derived from interpolation of 2010 estimate of 1,411.3 tpd and 2015 estimate of 1,183.0 tpd derived from interpolation of 2015 estimate of 1,183.0 tpd and 2025 estimate of 1,174.8 tpd derived from interpolation of 2015 estimate of 1,183.0 tpd and 2025 estimate of 1,174.8 tpd derived from interpolation of 2025 estimate of 1,174.8 tpd and 2035 estimate of 1,252.6 tpd derived from interpolation of 2015 estimate of 34.9 tpd and 2025 estimate of 35.2 tpd derived from interpolation of 2025 estimate of 35.2 tpd and 2035 estimate of 35.6 tpd derived from interpolation of 2015 estimate of 30.5 tpd and 2025 estimate of 36.0 tpd derived from interpolation of 2015 estimate of 30.5 tpd and 2025 estimate of 36.0 tpd derived from interpolation of 2025 estimate of 36.0 tpd and 2035 estimate of 41.0 tpd derived from interpolation of 2015 estimate of 47.7 tpd and 2025 estimate of 33.8 tpd derived from interpolation of 2015 estimate of 47.7 tpd and 2025 estimate of 33.8 tpd derived from interpolation of 2025 estimate of 33.8 tpd and 2035 estimate of 29.8 tpd. 25
32 (intentionally blank) 26
33 APPENDIX A TRANSPORTATION NETWORK ASSUMPTIONS 27
34 (intentionally blank) 28
35
36
37
38
39
40
41
42
43
44
45
46
47
48
49
50
51
52 46
53 47
54 (intentionally blank) 48
55 APPENDIX B TRANSPORTATION MODEL CALIBRATION DESCRIPTION 49
56 (intentionally blank) 50
57 Introduction In support of the conformity determination for the 2035 Regional Transportation Plan (RTP), the Denver Regional Council of Governments (DRCOG) Metro Vision Resource Center employed the Regional Socio-economic Model together with Focus, the updated regional travel modeling system. Travel modeling uses mathematical formulations in computer software programs to show how regional development impacts road and transit usage. The Focus model simulates the travel of millions of individual people in the region throughout a typical weekday. The previous model, Compass, was an aggregate model that did not include this level of detail. The Focus model sums the individual travel to forecast how many vehicles will be driven on major roads, how much congestion there will be and how many people will walk, bike or use transit. To realistically simulate each person s daily travel, Focus models the many choices each person makes each day including: (1) where to work (2) where to go to school (3) how many automobiles are owned by the person s household (4) how many trips each person makes in a day (5) the address where each trip starts from and goes to (6) the mode for each trip, with choices including walk and biking (7) which major streets or bus routes were chosen to reach each destination The model takes into account many characteristics of people, such as their age and income, and how the region will change demographically over time. It also takes into account characteristics of the built environment such as congestion, density, and walkability. The Focus travel model was estimated based on detailed data from a survey called the Travel Behavior Inventory (TBI). The TBI project involved multiple surveys of travel in the Denver metropolitan area, including: The Household Survey a travel diary survey that gathered complete travel information for an assigned day for approximately 5,000 households; 51
58 The Front Range Travel Survey - a survey of vehicles entering and leaving the metropolitan area; The Commercial Vehicle Survey a survey that gathered complete travel information from more than 800 commercial vehicles on an assigned day; and The Non-Respondent Populations Project - an effort to evaluate whether those who did not respond to the survey exhibited different travel behavior than people who did respond to the survey. The bulk of this survey work was conducted in , with data cleaning and summary conducted through Focus was calibrated using 2005 data sources including roadway counts, transit boardings, American Community Survey data, and Census data. Demographic Development Estimation DRCOG works with a panel of economists and planners from both private and public sectors to review current growth trends and evaluate the output of a regional forecast model. This model relates the regional economy to national forecasts by industrial sector. Once employment levels are predicted, a demographic model is used to determine the migration levels needed to generate the labor force to fill the expected jobs. The forecasts are reviewed annually with major revisions expected every five years. Small Area Development Estimates To provide development data at a level of detail necessary for the travel model, the regional urban activity forecasts are disaggregated into 2,800 transportation analysis zones (TAZs), as shown in Figure 1. The allocation to TAZs is carried out based on an attractiveness index for each TAZ, which in effect develops a desirability score for each TAZ. This score is based on roughly 20 variables such as miles of arterial roadway in the TAZ, rapid transit service, vacant land, local land use plans, growth over the last decade, environmental constraints, and income characteristics. Separate attractiveness indices and allocations are developed for commercial and retail employment, and for households. The zones are filled with new development in the given category starting with the TAZ with the highest attractiveness index. The amount of 52
59 development allocated to a TAZ is controlled by the amount of vacant land in the zone available for residential or employment uses, the expected density in the zone, and other factors. The model works its way through the list of zones until all of the growth is allocated. The effects of several regional planning policies also are taken into account in the model: open space plans affect the amount of developable land in the relevant TAZs; the regional urban growth boundary affects expected densities, and the development totals in TAZs outside that boundary; and planned urban centers affect the development capacity in the TAZs in which they are planned. Figure 2 shows a flowchart for the process of socioeconomic forecasting in the Denver region. The forecasting results were refreshed in

60 Figure 1 DRCOG Travel Analysis Zones 54
61 Figure 2 Socioeconomic Model Elements and Flow Regional Employment and Population forecast control totals Panel Review of Model Variables Socioeconomic Model DRCOG Draft Forecasts by TAZ Panel Review of Variable Weights for TAZ scoring Utility Functions Maximum allowable jobs and house-holds (capacity) Community Review of Draft Forecasts Allocate development to TAZs Final 2035 Forecasts of employment and households 55
62 Figure 3 Travel Model Elements and Flow Factors Considered Regional Growth Totals National Economic Forecasts Industrial Base Births/Deaths In-Migration Highway & Transit System Small Area Development Estimates Number of Trips Vacant Land Past Growth Water Supply Roadways & Transit Local Land Use Plans Household Size Income Employment Type Special Generators Trip Destination Travel Time Opportunities Travel Mode Type of Trip Income Travel Time Cost Travel Path Travel Time Congestion Cost 56
63 Focus Model Process Overview Figure 3 shows a simplified diagram of how the Focus model components flow after the socioeconomic forecast has been completed. The model begins with a population synthesizer that creates millions of records for individual households and persons. Then the travel skims that give travel times from each origin zone to each destination zone are created. Tours are the first travel elements to be created. Figure 4 shows a diagram to explain how tours work. This diagram has one tour with three trips and one intermediate stop. The model runs through a set of activity generation, location choice, mode choice, and time of day choice model components for tours. Then the model runs through a parallel set of model components for trips within a tour. Figure 4. Tour Diagram Intermediate Stop Tour Origin Tour Destination Highway and Transit System One of the most significant inputs to all travel model components is the transportation network representations. The highway network is represented by over 25,000 directional road segments, described according to location, length, number of lanes, functional classification, and area type. High-occupancy vehicle (HOV) lanes also are represented as special links. Tollway links are assessed an additional impedance to reflect toll charges. The model also includes a fully detailed representation of transit facilities, including all bus and rapid transit lines, park-n-ride lots, bus stops, and walk access/egress routes. Bus routes follow the same highway network as automobiles trips, and bus speeds are based on auto speeds. Rail speeds are developed based on transit schedule information. Capture areas for park-n-ride lots are quite broad, permitting 57
64 trip-makers in the model to select the lot that produces the shortest overall transit path to their destination. As part of the process of estimating highway and transit use, minimum impedance paths are calculated using time, distance and toll cost over the highway and HOV system, and time and cost over the transit system. Model Components The most important model components are briefly described below. Table 1 enumerates all model components. Most model components are multinomial logit or nested logit models, which are regression models that have more than two discrete choice outcomes. Table 1. Focus Model Components 1. Population Synthesizer 14. Tour Time of Day Simulation 2. TransCAD Initialization 15. Tour Primary Destination Choice 3. TransCAD Trip Generation 16. Tour Priority Assignment 4. TransCAD Skimming 17. Tour Main Mode Choice 5. Size Sum Variable Calculator 18. Tour Time of Day Choice 6. Regular Workplace Location 19. Intermediate Stop Generation Choice 7. Regular School Location 20. Trip Time of Day Simulation 8. Auto Availability 21. Intermediate Stop Location Choice 9. Aggregate Destination Choice Logsum 22. Trip Mode Choice Generation 10. Daily Activity Pattern 23. Trip Time of Day 11. Exact Number of Tours 24. Write Trips To TransCAD 12. Work Tour Destination Type 25. TransCAD Highway and Transit Assignment 13. Work-Based Subtour Generation Population Synthesizer The model begins with a population synthesizer called PopSyn. PopSyn creates a forecast of individual households and persons with detailed demographic characteristics for chosen year. It operates by drawing household and person records from the 2000 Public Use Microsample (PUMS) with the goal of matching forecasted demographic controls, including land use model households by zone. 58
65 Highway and Transit Skims The highway and transit skims are made by finding shortest time paths for origin-destination zone pairs by time-of-day. The skims are used extensively in later model components location choice, mode choice, and time of day choice. Denver International Airport/Internal-External/ External-External Trips After skimming is run, the Compass 2.0 model components must be run for airport trips, internal-external trips, and external-external trips. The entire Compass model must be run to generate and assign these trips. Regular Workplace and School Location The work location choice model takes all regional workers and assigns them a regular work location zone and point. Characteristics of the worker and their home zone are used in combination with zonal characteristics to determine the desirability of any zone. The work location choice model is a nested logit model with the highest nest for a regular workplace at home or outside the home. The second level nest is given the workplace is outside the home, in which zone it is located. Similarly to the regular work location choice model, the regular school location choice model assigns each student a regular school location zone and school. It uses information about the student like income and age, and information on school enrollment and distance from home to school to determine which schools will be attractive for which students. There are four school location choice models by student grade level: pre-school, kindergarden-8 th grade, 9 th -12 th grade, and university. Four separate models are used to reflect that the decision-making of school location for different grade ranges have significantly different characteristics. The models are all multinomial logit with the choice being the location of the school zone. Auto Availability Choice The auto availability choice model is a multinomial logit model that selects number of automobiles available for each household in the region. The choices range from no cars to 4+ cars. The model uses information about households and their accessibility to work and school to determine how many autos are available to households. 59
66 Tour Models After Focus has projected the long-term decisions about work and school location and auto ownership, it forecasts daily activities on a tour-level. The exact number of tours model determines exactly how many tours of each type each person will make in his or her day. The tour types predicted for each person include: work, school, escort, personal business, shop, meal, and social recreation. The model outputs this number of tours by purpose into the tours table in the database. The tour primary destination choice model selects to which zone each tour is destined based the development (e.g. jobs and households) located within the zone. Then it assigns a point within each zone as the final destination. After the tour destination is known, the tour main mode choice model predicts the main travel mode used on the tour. The mode chosen is based on the impedances associated with each mode from the tour origin to the tour destination, zonal characteristics, and demographic person characteristics. Given the known tour origin, destination and mode from previous models, the tour arrival and departure time model predicts the time arriving at the primary destination of the tour and the time leaving the primary destination, both to within 1 hour periods. Trip Models After the tour-level models are run, a series of trip-level models are run. The first trip level model is the intermediate stop generation model which generates intermediate stops on each tour. The intermediate stop location choice model selects the zone for each intermediate stop. The locations of all intermediate stops on tours are modeled one at a time, first for stops from home to the primary activity and then for stops from the primary activity to home. 60
67 The trip mode choice model determines the trip mode on all trips. The tour mode has already been found by the tour mode choice model, and this knowledge is used in combination with skim data, zonal data, and person data to find the trip modes on these tours. Given the origin, destination and mode of each trip, the trip time of day choice model predicts the time each intermediate stop will occur. The trip time of day choice model has 24 alternatives corresponding to each hour period. After the trip models have been run, the following information is known for every trip internal to the region for every person: Origin and Destination Zone and Point Location Trip Purpose (work, school, escort, personal business, shop, social recreation) Trip Mode ( drive alone, shared ride 2, shared ride 3+, walk to transit, drive to transit, walk, bike, school bus) Trip Time of Day ( one of 24 hours) Network Assignment Automobile trips are assigned to the highway network via a user equilibrium algorithm, after commercial trips have been loaded first using an all-or-nothing process. The all or nothing process simply assigns trips to the shortest path between origin and destination, ignoring possible congestion effects that might cause trips to take different paths. The user equilibrium process assigns the trips between each origin and each destination TAZ in such a way that, at the end of the process, no trip can reduce its travel time by changing its path. In other words, taking into account the congestion produced by all other trips in the region, each trip is following its minimum path. Highoccupancy vehicles (HOV) are loaded simultaneously with single-occupant vehicles (SOV). Transit assignment is performed separately, using an all-or-nothing algorithm that does not take into account the possibility that high demand on some transit routes may motivate some riders to shift routes. Finally, the model is run several times, 61
68 feeding back the output speeds to the input stages that require them as input (among them, the trip distribution stage) until the output speeds and the input speeds match. The model also takes into account the effect of toll costs in roadway route choice by converting toll costs into equivalent time cost using an estimated value of time for automobile trip-makers. Model Calibration Each Focus model component was calibrated using 2005 inputs to 2005 external data sources individually and then the entire model was calibrated aggregately against roadway counts and RTD transit boardings. External data from 2005 was used wherever possible to ensure that the model was correctly capturing observed 2005 Denver travel behavior when 2005 inputs were used in the model. The following 2005 datasets were used to calibrate against: 2005 American Community Survey (ACS) 2005 Colorado state demographer data 2005 Colorado Department of Transportation (CDOT) highway counts 2005 HPMS estimated regional VMT 2005 Regional Transportation District (RTD) transit boardings and 2005 Compass trip-based model results. Once comparisons were made of model results against the observed datasets, each model component was calibrated. The calibration involved changing utility function constants, coefficients, and adding variables. Then the model was re-run, results compared again, and modifications made again. This process was iterated as time allowed until satisfactory results were achieved. The major regional level model results of the calibration are shown in Table 2 and Table 3. These tables demonstrate that the aggregate model results match the observed counts and transit boardings well. 62
69 Table 2 Observed and Modeled Vehicle Miles Traveled on Links with Counts Observed VMT Modeled VMT 20,506,768 20,906,583 Table 3 Observed and Modeled Transit Boardings Observed Transit Modeled Boardings Transit Boardings 269, ,508 Air Quality Modeling Formal air pollutant emissions modeling is conducted by the APCD. However, DRCOG, the APCD, and other agencies work closely together in this effort, both in developing the modeling techniques, assumptions, and parameters, and in executing the model runs. Travel model results are, of course, one of the principal inputs to the air pollutant emissions model. The model produces estimates of the amount of emissions of carbon monoxide (CO), volatile organic compounds (VOCs), oxides of nitrogen (NOx), and particulate matter (PM10) generated by motor vehicles. The results are then combined with numerous assumptions concerning meteorology and atmospheric chemical reactions to produce air pollutant concentration estimates. 63
70 (intentionally blank) 64
71 APPENDIX C PM 10 STREET EMISSIONS REDUCTION COMMITMENTS 65
72 (intentionally blank) 66
73
74
75
76
77
78
79

80
81
82
83
84
85
86
87
88
89
90
91
92
93
94
95
96
97
98
99
100
101
102
103
104