Additional analyses of 2009 oceanographic data
|
|
|
- Regina Porter
- 5 years ago
- Views:
Transcription
1 APPENDIX H5.4 Additional analyses of 2009 oceanographic data 1 Olympic Dam Expansion Supplementary Environmental Impact Statement 2010
2 Memorandum From: Daniel Botelho To: David Wiltshire; James Brook Date: 15 September 2010 CC: Michael Barry Subject: Additional Analyses of Spencer Gulf ADCP and Salinity Data Collected in 2009 Dear David, As requested, please find below additional analyses of the ADCP and salinity data sets collected in the Northern Spencer Gulf between April and June 2009, previously presented in BMT WBM (2010). Analysis of ADCP data presented in this memorandum consists of interrogation and statistical distribution of currents in the bin closest to the seabed at Site B (Figure 1). Analyses of salinity data consists of the production of timeseries (and respective distributions) of salinity differences between sites, as well as daily and hourly salinity variations observed at Site 1 (Figure 1), specifically. Please do not hesitate to contact me if you require further information. Best regards, Dr. Daniel A. Botelho Senior Engineer BMT WBM Pty Ltd.
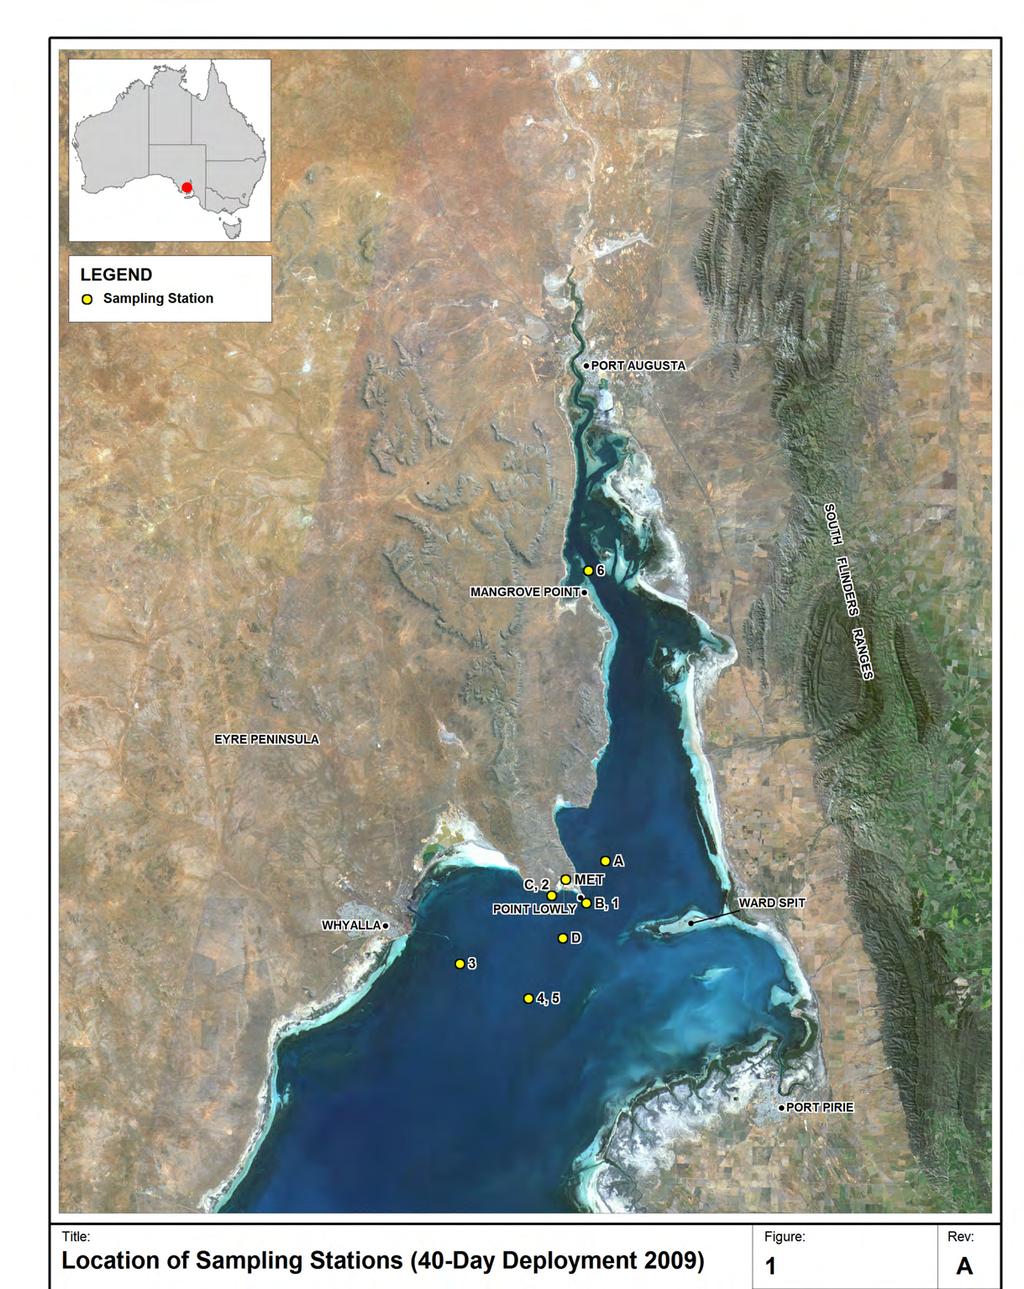
3 I:\B17415_I_brh_AdditionalODXModelling\DRG\WQU_006_090928_NthnSpencerGulfSampling Stations.wor Figure 1 Location of Sampling Stations
.")
4 ADCP Data Vertical profiles of water currents were measured at four locations in the vicinity of Point Lowly for an approximate 6 week deployment period between April and June The locations of these deployments are presented in Figure 1. Details of the deployment and equipment are described in BMT WBM (2010). The ADCP data measured at station B (Figure 1) and respective current magnitude statistics are presented in Figure 2. Sampling was specified at every 6 minutes in 0.5 m bins from 1.1 m from the seabed to about 90% of the total water column height. Average and maximum current magnitudes were 0.45 m/s and 1.50 m/s, respectively. Bottom currents as measured the by the lowest ADCP bin in the water column (top at 1.6 m above seabed) was interrogated and is presented in Figure 3 with respective current magnitude statistics. Average and maximum bottom current magnitudes were 0.29 m/s and 0.81 m/s, respectively. Additional percentiles are also presented in Figure 3. Figure 2 Vertical ADCP Current Profile Measurements at Station B
 and the longest duration that the current speed was maintained below the threshold.")
5 Figure 3 Bottom Current Measurements at Station B Duration of bottom currents below speed thresholds (0.01, 0.05, and 0.10 m/s) were calculated over the measurement period. The analysis obtained the total number of measurements below the given threshold (expressed in terms of percentage) and the longest duration that the current speed was maintained below the threshold. This analysis is summarised in Table 1. Table 1 Summary of Bottom Current Speed Duration below Defined Thresholds Current speed threshold Percentage of time current speed is less than threshold Longest duration that current speed is below threshold <0.01 m/s 0.220% 0.3 h <0.05 m/s 4.86% 1.3 h <0.10 m/s 15.6% 4.9 h Salinity Data Salinity measurements at different sites were performed over the same 6-week deployment period to capture the salinity and temperature variation across the Point Lowly area and surrounds. The locations of these deployments are presented in Figure 1. Details of the deployment and equipment are described in BMT WBM (2010).
6 Measurements were performed at the bottom in each location, with the exception of measurements in Station 4 and 5 (same coordinates), in which both mid-depth (~10.0 m average depth) and bottom (~20.0 m average depth) measurements were made (Figure 1). Sampling was performed at 6 minutes intervals. Salinity measurements were contrasted to laboratory analysis of hand samples and corrected to minimise the effects of conductivity sensor drift. The methodology adopted for the corrections of the salinity measurements are fully described in BMT WBM (2010). Measurements at Site 3 were deemed unreliable (BMT WBM 2010) and are not used in the analysis in this memorandum. The raw and corrected salinity measurements are presented in Figure 4 and the respective cumulative and probability distributions of the corrected salinity measurements are presented in Figure 5. Statistics of the corrected measurements are presented in Table 2. Figure 4 Raw and Corrected CTD Salinities
7 Figure 5 Corrected CTD Salinity Distributions. CDF Cumulative Distribution Function, PDF Probability Distribution Function. Table 2 Corrected CTD Salinity Percentile Distributions Site CTD Site 1 CTD Site 2 CTD Site 4 CTD Site 5 CTD Site 6 n. samples: max: min: mean: %: %: %: %: %: %: %: %: %: %: %: %: %: %: %: %: %: %: %: %: %: Salinity differences between sites were computed from corrected salinity records linearly interpolated to a common time. Comparisons between Sites 4 and 5 indicate the degree of mixing in the water column as they were positioned in the same horizontal coordinates (Figure 1). The difference of salinities between the two sites and the respective salinity difference distribution are presented in Figure 6. The tidal elevations at the location are also presented. The mean and maximum salinity differences observed were 0.38 and 1.66, respectively
8 (Table 3). As expected from the general Northern Gulf salt dynamics (Nunes-Vaz et al. 1990), the salinity differences increased during neaps, indicating some degree of stratification in the water column. With the increased tidal amplitude during springs, the salinity difference quickly subsided to near zero values. The difference between Sites 1 and 2 were calculated to indicate the local variability of bottom salinity between the deep site at the proposed diffuser location and shallow sites where sensitive receptors are located (i.e. cuttlefish habitat - Figure 1). The difference of salinities between the two sites and respective distribution are presented in Figure 7. The mean, minimum and maximum salinity differences observed were 0.47, and 1.99, respectively (Table 3). Figure 7 shows that during the dodge tides, salinities at Site 1 became higher than Site 2 (i.e. the negative difference became positive). Despite the general increase of the salinity differences during these severe neap cycles (Figure 7), the variation pattern was not as obvious as the neap-spring cycle variation presented for the same location in Figure 6. The increase and positivity of the difference during neaps are influenced by higher salinity from northern areas of the gulf flowing towards the Gulf mouth in the deeper channels, as salt is ejected from the Northern Spencer Gulf. In contrast, a pattern of oscillation with the ebb and flood tides was evident. This pattern is influenced by the difference in flow magnitude between the Rip and the shallow site, as flow excursions through the Rip promote larger salinity variations with the tidal motion. The salinity variation at Site 1 is better illustrated by daily and hourly variations of salinity (Figure 8). These variations were calculated by obtaining the difference between the maximum and minimum salinities observed over each day or hour of the record. The mean, minimum and maximum daily salinity ranges were 0.72, 0.31 and 1.26, respectively (Table 3), while the hourly variations were 0.10, 0.00 and 0.87, respectively (Table 3). Both daily and hourly ranges were large during the spring cycles, particularly in the spring cycle subsequent to the first dodge tide of the record. During this spring cycle, hourly variations were sometimes larger than 50% of the observed daily variations (Figure 8), clearly reflecting the effect of the tidal flow excursions at Site 1. During the neap tides however, the hourly variations were insignificant despite appreciable daily variations. These local variations can be contrasted with variation observed at a larger scale in the Northern Spencer Gulf, given by the salinity differences between Site 6 and Site 1, located approximately 40 km apart (Figure 9). The mean, minimum and maximum daily salinity differences were 1.11, and 2.06, respectively (Table 3). The difference between Site 6 and Site 1 was consistently larger than the other differences shown above, particularly at the lower percentiles (Table 3). However, the differences between Site 6 and Site 1 approached zero at the end of the two dodge tides in the records (Figure 9), indicating the connectivity over Northern Spencer Gulf. During spring tides, vertical mixing disrupts this connection and the salinity gradient (i.e. difference) between North and South becomes more significant (Figure 9).
9 Figure 6 Upper panel: Tidal Elevations at Site 5. Middle Panel: Salinity Differences between Site 5 and Site 4, Lower Panel: Cumulative Distribution of the Differences Presented in the Middle Panel.
10 Site Table 3 Salinity Differences Percentile Distributions Site 1 Site 6 Site 1 minus minus Daily Site 2 Site 1 Variation Site 5 minus Site 4 Site 1 Hourly Variation n. samples: max: min: mean: %: %: %: %: %: %: %: %: %: %: %: %: %: %: %: %: %: %: %: %: %:
11 Figure 7 Upper panel: Tidal Elevations at Site 2. Middle Panel: Salinity Differences between Site 1 and Site 2, Lower Panel: Cumulative Distribution of the Differences Presented in the Middle Panel.
12 Figure 8 Upper panel: Tidal Elevations at Site 2. Middle Panel: Daily and Hourly Salinity Differences at Site 1, Lower Panel: Cumulative Distribution of the Differences Presented in the Middle Panel.
13 Figure 9 Upper panel: Tidal Elevations at Site 2 and Site 6. Middle Panel: Salinity Differences between Site 6 and Site 1, Lower Panel: Cumulative Distribution of the Differences Presented in the Middle Panel References Nunes-Vaz, R.A., G.W. Lennon, and D.G. Bowers (1990) Physical behaviour of a large, negative or inverse estuary. Cont. Shelf Res., 10(3): BMT WBM (2010). Hydrodynamic and Water Quality Modelling of Spencer Gulf: Model Validation Report. Report R.B Calibration_Report.doc prepared for BHP Billiton.