2015 Urban Water Management Plan for District 40
|
|
|
- Lester Freeman
- 5 years ago
- Views:
Transcription


1 2015 Urban Water Management Plan for District 40 County of Los Angeles Department of Public Works Los Angeles County Waterworks District No. 40, Antelope Valley Alhambra, California February 2017
2
3 Table of Contents List of Figures... v List of Tables... vi List of Abbreviations... viii Executive Summary... ES-1 Plan Preparation... ES-1 District Service Area... ES-1 Baseline and Target Updates (gpcd)... ES-2 Water Supplies... ES-2 Water Supply Reliability... ES-3 Water Conservation... ES-3 1. Introduction Urban Water Management Planning Act Basis for Preparing the Plan Coordination and Outreach Public Participation and Plan Adoption Plan Organization System Description Description of Service Area Service Area Climate Service Area Population and Demographics System Water Use Water Uses by Sector Distribution System Water Losses Estimating Future Water Savings Water Use for Lower-Income Households SBX7-7 Baseline and Targets Updated Calculations from 2010 UWMP Baseline Periods to 15-Year Baseline Period (Baseline gpcd) Year Baseline Period (Target Confirmation) Service Area Population Gross Water Use Per Capita Water Use Baseline Daily Per Capita Water Use and 2020 gpcd Targets Adjustments to 2015 Gross Water Use and 2015 Compliance iii LAC WW- D40AV 2015 UWMP Final_02_07_2017.docx
4 Table of Contents 2015 Urban Water Management Plan 5. System Supplies Purchased Water Water Banking Acquisition of New Water Supply Groundwater Basin Description and Adjudication Groundwater Quality Groundwater Management Historical Groundwater Pumping Stormwater Wastewater and Recycled Water Recycled Water Coordination Wastewater Collection, Treatment, and Disposal Recycled Water System Recycled Water Beneficial Uses Actions to Encourage and Optimize Future Recycled Water Use Desalinated Water Opportunities Exchanges or Transfers Future Water Projects Summary of Existing and Planned Sources of Water Climate Change Impacts to Supply Water Supply Reliability Assessment Constraints on Water Sources Reliability by Type of Year Supply and Demand Assessment Regional Supply Reliability AVEK Westside Water Bank Interconnecting Pipeline and Pump Station AVEK Enterprise Bank AVEK Southern Antelope Valley Intertie Water Shortage Contingency Planning Stages of Action Prohibitions on End Uses Water Waste Ordinance Landscape Irrigation Commercial, Industrial, Institutional Water Features and Swimming Pools Other Penalties, Charges, Other Enforcement Consumption-Reduction Methods Determining Water Shortage Reductions iv LAC WW- D40AV 2015 UWMP Final_02_07_2017.docx
5 2015 Urban Water Management Plan Table of Contents 7.6 Revenue and Expenditure Impacts Resolution or Ordinance Catastrophic Supply Interruption Plan Earthquakes or Other Natural Disaster Power Outages Contamination Year Minimum Water Supply Demand Management Measures Water Waste Prohibition Metering Conservation Pricing Water Conservation Public Education and Outreach Water Conservation Program Coordination and Staffing Support Programs to Assess and Manage Distribution System Real Loss Other Demand Management Measures Water Audits for all Customers Rebates References Appendix A: Documentation of City/County Notification... A-1 Appendix B: Notice of Public Hearing... B-1 Appendix C: Adoption Resolution...C-1 Appendix D: DWR UWMP Checklist... D-1 Appendix E: Distribution System Water Loss Audit... E-1 Appendix F: SB X7-7 gpcd Verification Form... F-1 Appendix G: Groundwater Basin Judgment/Adjudication... G-1 Appendix H: Phased Water Conservation Plan... H-1 Appendix I: CUWCC Online Reports I-1 List of Figures Figure 2-1. District Service Areas Figure 5-1. Groundwater Sub-basin of Antelope Valley (from the 2014 Salt and Nutrient Plan) Figure 5-2. Recycled and Wastewater Service Areas v LAC WW- D40AV 2015 UWMP Final_02_07_2017.docx
6 Table of Contents 2015 Urban Water Management Plan List of Tables Table ES-1. Retail: Demands for Potable and Raw Water Projected (ac-ft/yr) (DWR Table 4-2)... 2 Table ES gpcd Compliance (DWR Table 5-2)... 2 Table ES-3. Retail: Normal Year Supply and Demand Comparison, ac-ft/yr (DWR Table 7-2)... 3 Table 1-1. Retail: Public Water Systems (DWR Table 2-1) Table 1-2. Plan Identification (DWR Table 2-2) Table 1-3. Agency Identification (DWR Table 2-3) Table 1-4. Retail: Water Supplier Information Exchange (DWR Table 2-4) Table 1-5. Coordination with Appropriate Agencies Table 1-6. Retail: Notification to Cities and Counties (DWR Table 10-1) Table 2-1. Monthly Average Climate Data Summary Table 2-2. Retail: Population- Current and Projected (DWR Table 3-1) Table 3-1. Retail: Demands for Potable and Raw Water Actual (DWR Table 4-1) Table 3-2. District 40 Water Use Duty Factor by Land Use Type Table 3-3. Retail: Demands for Potable and Raw Water Projected (DWR Table 4-2) Table 3-4. Retail: Total Water Demands, ac-ft/yr (DWR Table 4-3) Table 3-5. Retail: Water Loss Audit Reporting (DWR Table 4-4) Table 3-6. Retail Only: Inclusion in Water Use Projections (DWR Table 4-5) Table 3-7. Projected Potable Water Demands for Low-Income Housing, ac-ft/yr Table 4-1. Baselines and Targets Summary Retail Agency or Regional Alliance Only (DWR Table 5-1) Table 4-2. Comparison of 2010 and 2015 Baselines and Targets Table Compliance Retail Agency or Regional Alliance Only (DWR Table 5-2) Table 5-1. Groundwater Volumes Determined from Adjudication Table 5-2. Other Known Groundwater Basin Users Table 5-3. Retail: Groundwater Volume Pumped, ac-ft/yr (DWR Table 6-1) Table 5-4. Wastewater Collected within Service Area in 2015, ac-ft/yr (DWR Table 6-2) Table 5-5. Retail: Wastewater Treatment and Discharge within Service Area in 2015, ac-ft/yr (DWR Table 6-3) Table 5-6. Retail: Current and Projected Recycled Water Direct Beneficial Uses within Service Area, ac-ft (DWR Table 6-4) Table 5-7. Retail: 2010 UWMP Recycled Water Use Projection Compared to 2015 Actual, ac-ft (DWR Table 6-5) Table 5-8. Retail: Methods to Expand Future Recycled Water Use (DWR Table 6-6) vi LAC WW- D40AV 2015 UWMP Final_02_07_2017.docx
7 2015 Urban Water Management Plan Table of Contents Table 5-9. Retail: Expected Future Water Supply Projects or Programs (DWR Table 6-7) Table Water Supplies Actual, ac-ft/yr (DWR Table 6-8) Table Water Supplies Projected, ac-ft/yr (DWR Table 6-9) Table 6-1. Retail Basis of Water Year Data AVEK/SWP (DWR Table 7-1) Table 6-2. Retail: Normal Year Supply and Demand Comparison, ac-ft/yr (DWR Table 7-2) Table 6-3. Single Dry Year Water Supply and Demand Comparison, ac-ft/yr (DWR Table 7-3) Table 6-4. Retail: Multiple-Dry Years Supply and Demand Comparison, ac-ft/yr (DWR Table 7-4) Table 7-1. Retail: Stages of Drought Contingency Plan (DWR Table 8-1) Table 7-2. Restrictions and Prohibitions on End Uses (DWR Table 8-2) Table 7-3. Retail Only: Stages of WSCP - Consumption Reduction Methods (DWR Table 8-3) Table 7-4. Retail: Three-Year Minimum Water Supply, ac-ft/yr (DWR Table 8-4) vii LAC WW- D40AV 2015 UWMP Final_02_07_2017.docx
8 Table of Contents 2015 Urban Water Management Plan List of Abbreviations F degree(s) Fahrenheit AB ac-ft ac-ft/yr Assembly Bill acre-foot/feet acre-foot/feet per year Act California Urban Water Management Planning Act of 1983 ASR aquifer storage and recovery AVEK Antelope Valley East Kern Water Agency AVSWCA Antelope Valley State Water Contractors Association AVWB Antelope Valley Water Bank AWWA American Water Works Association BMP best management practice CALGreen California Green Building Standards Code CASGEM California Statewide Groundwater Elevation Monitoring Census U.S. Census Bureau CII commercial, industrial, and institutional CIMIS California Irrigation Management Information System County County of Los Angeles Court Superior Court of California CUWCC California Urban Water Conservation Council CWC California Water Code DAWN Domestic-Agricultural Water Network DCR Delivery Capability Report District Los Angeles County Waterworks District 40 DMM demand management measure DWR Department of Water Resources ERP Emergency Response Plan ELT Early Long-Term Alternative for State Water Project model runs ETo evapotranspiration gpcd gallon(s) per capita per day gpd gallon(s) per day GWMP groundwater management plan ID identifier in. inch(es) IPR indirect potable reuse IRWMP Integrated Regional Water Management Plan LACSD Los Angeles County Sanitation District LACDPW Los Angeles County Department of Public Works LCID Littlerock Creek Water District MCL maximum contaminant limit M&I municipal and industrial mgd million gallons per day mg/l milligram(s) per liter MOU Memorandum of Understanding N/A not applicable PWCP Phased Water Conservation Plan PWD Palmdale Water District QHWD Quartz Hill Water District RCSD Rosamond Community Services District RWMG Regional Water Management Group SB Senate Bill SB X7-7 Water Conservation Act of 2009 Semitropic Water Storage District SGMA Sustainable Groundwater Management Act SNMP Salt and Nutrient Management Plan State State of California SWP State Water Project SWRCB State Water Resources Control Board SWRU Stored Water Recovery Unit TDS total dissolved solids USGS U.S. Geological Survey UWMP urban water management plan WDF water use duty factor WRP water reclamation plant WSCP Water Shortage Contingency Plan WSSP2 Water Supply Stabilization Project 2 WTP water treatment plant viii LAC WW- D40AV 2015 UWMP Final_02_07_2017.docx
9 Executive Summary This section provides a summary of the 2015 Urban Water Management Plan (UWMP) for the Los Angeles County Waterworks District 40, Antelope Valley (District). Plan Preparation This UWMP for the District was prepared in accordance with the California Urban Water Management Planning Act of 1983 (Act). The Act requires every urban water supplier providing water for municipal purposes to more than 3,000 customers or supplying more than 3,000 acre-feet (ac-ft) of water annually to adopt and submit a UWMP every 5 years to the California Department of Water Resources (DWR). The purpose of the UWMP is to encourage local water agencies and wholesalers to plan ahead with respect to matching future water supply and demand and to report on water conservation efforts and the implementation of the Water Conservation Act of 2009 (SB X7-7) to meet the 20 percent water use reduction goal by The Act describes the required contents of the UWMP and the coordination, outreach, and adoption procedure. Coordination and outreach were done as required with other appropriate water suppliers in the area, suppliers that share a common source, water management agencies, and relevant public agencies. The UWMP was made available for public review, and a public hearing occurred on January 24, 2017 at the County of Los Angeles Board of Supervisors meeting. Adoption of the UWMP occurred at the same meeting. A UWMP that is accepted by DWR is required for a water supplier to be eligible to receive State of California (State) grant and loan funding. District Service Area Eight regions compose the District, which serves customers in the cities of Lancaster and Palmdale (Regions 4 and 34), Pearblossom (Region 24), Littlerock (Region 27), Sun Village (Region 33), Rock Creek (Region 39), Northeast Los Angeles County (Region 35), and Lake Los Angeles (Region 38). Regions 4 and 34 are integrated and operated as one system. Similarly, Regions 24, 27, and 33 are also integrated and operated as one system. The various regions were consolidated into a single district on November 2, The District encompasses approximately 554 square miles. The District s projected water demand is based on the projected acreage in each land use category and water use duty factors (WDFs) by customer category. Annual population growth projections are 1.25 percent over the next 20-year planning horizon. Development is anticipated in the urban areas of Palmdale and Lancaster. Little growth is anticipated outside of those areas. The projected acreage is based on the amount of land that is vacant or currently planned for redevelopment from The projected potable water demand to year 2035 is shown in Table ES-1. ES-1 LAC WW- D40AV 2015 UWMP Final_02_07_2017.docx
10 Executive Summary 2015 Urban Water Management Plan Table ES-1. Retail: Demands for Potable and Raw Water Projected (ac-ft/yr) (DWR Table 4-2) Water Use Type Single-family 66,410 74,330 82,170 90,020 Multi-family 3,590 4,020 4,440 4,870 Commercial a 5,050 4,450 3,840 3,230 Industrial 5,380 6,030 6,660 7,300 Institutional/governmental a 1,680 1,480 1,280 1,080 Losses b 6,180 6,800 7,410 8,020 Total 88,290 97, , ,520 a. Commercial and institutional potable water demands are shown. Recycled water is assumed to be used for the remainder of water use projected for commercial and institutional use types as presented in Table 5-6, below. b. Losses are assumed to be 7% of projected water demand. Baseline and Target Updates (gpcd) In this UWMP update, DWR is allowing for revisions in gallons per capita per day (gpcd) baseline and target analysis. DWR has implemented a new population tool, which was used to recalculate historical population. With this tool, historical population estimates changed slightly. The same target method Method 1, which was used in the 2010 analysis was used. It provides a year 2020 per capita demand target of 225 gpcd with an interim year 2015 target of 253 gpcd. The District s 2015 per capita demand is 165 gpcd, meaning the District is in compliance with the conservation requirement of SB X7-7. A summary of compliance is shown in Table ES-2. Actual 2015 gpcd 2015 Interim Target gpcd Extraordinary Events Table ES gpcd Compliance (DWR Table 5-2) Optional Adjustments to 2015 gpcd Enter 0 for adjustments not used from Methodology 8 Economic Adjustment Weather Normalization Total Adjustments Adjusted 2015 gpcd 2015 gpcd (adjusted if applicable) Did Supplier Achieve Targeted Reduction for 2015? Y/N Y a reflects water conservation mandated by the State political climate. Water Supplies The District uses both purchased (i.e., imported) water and groundwater as its supply sources. The District purchases water from the Antelope Valley East Kern Water Agency (AVEK). The projected need for wholesale water was coordinated with AVEK. AVEK receives water from the State Water Project (SWP) and allocates water to municipalities, ranchers, and agricultural water users. AVEK has an allocation of 144,844 acre-feet per year (ac-ft/yr) of water from the SWP. To maximize the use of its SWP supplies, AVEK has developed the Westside Water Bank within its service area and has ES-2 LAC WW- D40AV 2015 UWMP Final_02_07_2017.docx
11 2015 Urban Water Management Plan Executive Summary entered into various exchange programs with other SWP contractors. AVEK is also able to purchase additional SWP supplies from DWR (such as Article 21 and turnback pool water) when available (AVEK 2016). The District has purchased banked groundwater to use for future dry years when supplies from the SWP and groundwater will not meet demands in the future. Groundwater has historically been the secondary source of potable water supplies. The groundwater basin underlying the District is the Antelope Valley Groundwater Basin (6-44). In December 2015, the Superior Court of California (Court), Santa Clara County, entered a judgment and physical solution in the Antelope Valley Groundwater Cases (2015). Based on the Court s findings that the Antelope Valley Groundwater Basin is currently in overdraft, the judgment and physical solution imposes pumping restrictions, which will be fully implemented following a 7-year rampdown period starting in It is assumed for this UWMP that the District will have an annual pumping right of approximately 23,005 ac-ft/yr based on the rights the District will have in judgment and a related lease agreement with AVEK. Additional water supplies will have to be acquired and imported into the Antelope Valley to meet the demands associated with the level of growth projected for the service area. To acquire these additional water supplies, the District has executed a Memorandum of Understanding (MOU) with AVEK to implement a new Water Supply Entitlement Acquisition program for new developments that will be used to acquire additional imported water supplies. Recycled water is projected to be used in and around the service area. Water Supply Reliability The District has adequate water supplies to meet projected demands in all types of water year. The adequacy to meet water demand in a normal water year is summarized in Table ES-3. The District also has adequate water supplies for the single-dry year, and multiple-dry years through the use of banked water. This amount of recovered banked water ranges from 25,300 to 70,525 ac-ft/yr based on decreases in imported water from AVEK and SWP water. Table ES-3. Retail: Normal Year Supply and Demand Comparison, ac-ft/yr (DWR Table 7-2) Supply 110, , , ,390 Demand 96, , , ,820 Difference (supply minus demand) 13,600 13,580 13,590 13,570 Water Conservation In 2015, the District used creative ways to reach out to the public to meet the mandated temporary water conservation goal set by the governor because of the drought. Public-education notifications were placed in local newspapers, on radio stations, geo-targeted mobile ads, and online. Water audits and device and turf removal rebates were also offered to District customers to help educate and encourage conservation throughout the service area. The public information program includes print and Web-based publications, monthly bill inserts, and public outreach events. Television, radio, and newspaper contacts are routinely made to encourage water conservation. Details about the number and types of programs can be found in the California Urban Water Conservation Council best management practice coverage reports. ES-3 LAC WW- D40AV 2015 UWMP Final_02_07_2017.docx
12 Executive Summary 2015 Urban Water Management Plan In addition to local public education and outreach programs, the District also participates in a regional public education and outreach program through AVEK. The District will continue to provide water conservation materials as part of its community and school outreach programs, as well as continue to work cooperatively with AVEK to develop and distribute water conservation information. ES-4 LAC WW- D40AV 2015 UWMP Final_02_07_2017.docx
13 Section 1 Introduction This Urban Water Management Plan (UWMP) was prepared for the Los Angeles County Waterworks District 40, Antelope Valley (District). This UWMP includes a description of the water supply sources and projected water use, and a comparison of water supply water demands during normal, singledry, and multiple-dry years. The District s water conservation program is also described. This is the year-2015 UWMP as required by the California Urban Water Management Planning Act of 1983 (Act). The remainder of this section provides an overview of the Act, public participation, agency coordination and outreach, and UWMP organization. 1.1 Urban Water Management Planning Act The District s UWMP has been prepared in accordance with the Act, as amended, California Water Code (CWC), Division 6, Part 2.6, Sections through The Act became part of the CWC with the passage of Assembly Bill (AB) 797 during the regular session of the State of California (State) legislature. The Act was amended in November 2009 with the adoption of the Water Conservation Act or Senate Bill (SB) X7-7 and was most recently amended in The Water Conservation Act is described in Division 6, Part 2.55, Section of the CWC. The Act requires every urban water supplier providing water for municipal purposes to more than 3,000 customers or supplying more than 3,000 acre-feet (ac-ft) of water annually to adopt and submit a UWMP every 5 years to the California Department of Water Resources (DWR). The Act describes the required contents of the UWMP as well as how urban water suppliers should adopt the UWMP. 1.2 Basis for Preparing the Plan Table 1-1 presents the public water system name and number as well as the number of active connections and amount of water supplied in Public Water System Number Table 1-1. Retail: Public Water Systems (DWR Table 2-1) Number of Public Water System Name Active Municipal Connections 2015 Los Angeles County Waterworks District 40, Region 4 and 34: Lancaster and Desert Highlands Los Angeles County Waterworks District 40, Region 24, 27,33: Pearblossom (Pearblossom, Littlerock, and Sun Village) Los Angeles County Waterworks District 40, Region 35: Northeast Los Angeles County Volume of Water Supplied 2015, ac-ft/yr 49,775 34,570 2,795 2, Los Angeles County Waterworks District 40, Region 38: Lake Los Angeles 3,546 1, Los Angeles County Waterworks District 40, Region 39: Rock Creek Total 56,681 38, LAC WW- D40AV 2015 UWMP Final_02_07_2017.docx
14 Section Urban Water Management Plan The District has selected individual reporting for this UWMP, as identified in Table 1-2. In 2010, the District submitted a regional UWMP in conjunction with Quartz Hill Water District (QHWD). For the 2015 UWMP, the District has decided to submit an individual UWMP. This UWMP is reporting on a calendar-year basis using acre-feet as the unit of measure as noted in Table 1-3. Table 1-2. Plan Identification (DWR Table 2-2) No Individual UWMP Regional UWMP Does this Regional UWMP include a regional alliance? Type of Agency (select one or both) Table 1-3. Agency Identification (DWR Table 2-3) Agency is a wholesaler Agency is a retailer Fiscal or Calendar Year (select one) UWMP tables are in calendar years UWMP tables are in fiscal years If Using Fiscal Years Provide Month and Day that the Fiscal Year Begins [Day] [Month] Units of Measure Used in UWMP Unit ac-ft 1.3 Coordination and Outreach The Act requires the District to coordinate the preparation of its UWMP with other appropriate agencies in the area, including other water suppliers that share a common source, water management agencies, and relevant public agencies, to the extent practicable. The District has provided water supplier information with wholesale water suppliers as listed in Table 1-4, below. The District coordinated this UWMP with other agencies and the community as summarized in Table 1-5, below. Table 1-4. Retail: Water Supplier Information Exchange (DWR Table 2-4) The retail supplier has informed the following wholesale supplier(s) of projected water use in accordance with CWC Wholesaler water supplier name Antelope Valley-East Kern Water Agency 1-2 LAC WW- D40AV 2015 UWMP Final_02_07_2017.docx
15 2015 Urban Water Management Plan Section 1 Table 1-5. Coordination with Appropriate Agencies Coordinating Agencies Participated in the Preparation of the UWMP Sent a 60-Day Notice Sent a Notice of Public Hearing Commented on the Draft Was Sent a Final Copy City/county name City of Lancaster City of Palmdale Los Angeles County Regional Planning LACSDs Other AVEK PWD QHWD 1.4 Public Participation and Plan Adoption The Act requires the encouragement of public participation and a public hearing as part of the UWMP development and approval process. As required by the Act, prior to adopting this UWMP, the District made the UWMP available for public inspection and held a public hearing. The District notified cities and counties within the service area 60 days before the public hearing as shown in Table 1-6. Appendix A provides documentation that the cities and counties within which the District provides water supplies were notified at least 60 days prior to the UWMP public hearing. This hearing provided an opportunity for the District s customers including social, cultural, and economic community groups to learn about the water supply situation and the plans for providing a reliable, safe, high-quality water supply for the future. The hearing was an opportunity for people to ask questions regarding the current situation and the viability of future plans. Table 1-6. Retail: Notification to Cities and Counties (DWR Table 10-1) City/County Name 60-Day Notice Notice of Public Hearing City of Lancaster City of Palmdale County of Los Angeles A 60-day notification was released to the cities of Lancaster and Palmdale prior to the public hearing. Prior to adoption, the UWMP was made available to the public for inspection. Per the requirements of Government Code Section 6066, a Notice of Public Hearing was published twice in the Antelope Valley Press newspaper to notify all customers and local governments of the public hearing, and copies of the draft UWMP were made available for public inspection at the District s office, at local public libraries, and on the District website ( A public hearing was held on January 24, 2017, with the County of Los Angeles (County) Board of Supervisors. The UWMP was adopted by the County Board of Supervisors after the public hearing. The UWMP must be submitted to DWR, the State Library, and any city/county that received water 1-3 LAC WW- D40AV 2015 UWMP Final_02_07_2017.docx
16 Section Urban Water Management Plan from the supplier within 30 days after adoption. A copy of the Notice of Public Hearing and the resolutions of adoption are included in Appendices B and C. The adopted UWMP will also be available for public review during normal business hours at the District s office. 1.5 Plan Organization This section provides a summary of the sections in this UWMP: Section 2 provides a description of the service area, climate, and historical and projected population Section 3 presents historical and projected water demands Section 4 describes the SB X7-7 gallons per capita per day (gpcd) analysis Section 5 describes the water supplies Section 6 describes water supply reliability Section 7 describes the Water Shortage Contingency Plan (WSCP) Section 8 summarizes demand management measures (DMMs) Section 9 provides a list of references Appendices provide relevant supporting documents DWR has provided a checklist of the items that must be addressed in each UWMP based upon the Act. This checklist makes it simple to identify exactly where in the UWMP each item has been addressed. The checklist is completed for this UWMP and provided in Appendix D. It references the sections in this UWMP where specific items can be found. 1-4 LAC WW- D40AV 2015 UWMP Final_02_07_2017.docx
17 Section 2 System Description This section contains a description of the service area and its climate, and historical and projected population. 2.1 Description of Service Area The District was formed in accordance with Division 16, Sections through of the State Water Code to supply water for urban use throughout the Antelope Valley. It is governed by the Los Angeles County Board of Supervisors with the Waterworks Division of the County Department of Public Works providing administration, operation, and maintenance of the District s facilities. Eight regions compose the District, which serves customers in the cities of Lancaster and Palmdale (Regions 4 and 34), Pearblossom (Region 24), Littlerock (Region 27), Sun Village (Region 33), Rock Creek (Region 39), Northeast Los Angeles County (Region 35), and Lake Los Angeles (Region 38). Regions 4 and 34 are integrated and are operated as one system. Similarly, Regions 24, 27, and 33 are also integrated and operated as one system. The various regions were consolidated into a single district on November 2, The District encompasses approximately 554 square miles. Historically, land uses within the Antelope Valley have focused primarily on agriculture; however, the Antelope Valley is in transition from predominantly agricultural uses to predominantly residential and industrial uses. The service areas within the District are shown on Figure Service Area Climate Comprising the southwestern portion of the Mojave Desert, the Antelope Valley ranges in elevation from approximately 2,300 to 3,500 feet above sea level. Vegetation native to the Antelope Valley is typical of the high desert and includes Joshua trees, saltbush, mesquite, sagebrush, and creosote bush. The climate is characterized by hot summer days, cool summer nights, cool winter days, and cool winter nights. Typical of a semiarid region, mean daily summer temperatures range from 63 degrees Fahrenheit ( F) to 93 F, and mean daily winter temperatures range from 34 F to 57 F. The growing season is primarily from April to October. Precipitation ranges from 5 inches per year along the northern boundary to 10 inches per year along the southern boundary. Table 2-1 summarizes the region s average climate conditions based on the California Irrigation Management Information System (CIMIS) database (DWR 2015a). 2-1 LAC WW- D40AV 2015 UWMP Final_02_07_2017.docx

18 2015 Urban Water Management Plan Section 2 Figure 2-1. District Service Areas 2-2 LAC WW- D40AV 2015 UWMP Final_02_07_2017.docx
19 2015 Urban Water Management Plan Section 2 Table 2-1. Monthly Average Climate Data Summary Parameter Jan. Feb. Mar. Apr. May Jun. Jul. Aug. Sep. Oct. Nov. Dec. Total Standard average ETo, in Average rainfall, in Average max temperature, F Average minimum temperature, F Note: Period of record is from CIMIS Station 197 Palmdale. Accessed from CIMIS: LAC WW- D40AV 2015 UWMP Final_02_07_2017.docx
20 Section Urban Water Management Plan 2.3 Service Area Population and Demographics The historical population in the District is based on the 1990, 2000, and 2010 census for the census blocks within the District s service area using the DWR population tool and the District s 1990, 2000, and 2010 boundaries. The DWR population tool uses the U.S. Census Bureau (Census) data and an electronic map of the District s service area to obtain the historical population for the census years. The tool calculates the population for the non-census years including 2015 based on a correlation of the number of single-family and multi-family connections in the non-census years compared to the number of connections in the census years. Projected population estimates are based on historical connection number growth and an average 3.86 people per residential connection assumption. This assumes a constant growth in residential connections. As seen in Table 2-2, the population projections average 2 percent from the present to 2020 and then 1 percent growth each year afterward. This is consistent with the Antelope Valley Integrated Regional Water Management Plan (IRWMP) (Kennedy Jenks 2007). Table 2-2. Retail: Population- Current and Projected (DWR Table 3-1) Population served 208, , , , , LAC WW- D40AV 2015 UWMP Final_02_07_2017.docx
21 Section 3 System Water Use This section presents the current and projected retail water demands by sector, distribution system water losses, future passive water savings, and low-income household water use. 3.1 Water Uses by Sector The District currently provides water to 56,681 service connections. The District s water uses include residential: single-family and multi-family accounts as well as non-residential: commercial, industrial, institutional (CII)/governmental and other accounts such as those for temporary construction meters. Water use by customer sector for 2015 is based on the District s water sales and production records and is shown in Table 3-1. The District is fully metered. Use Type Table 3-1. Retail: Demands for Potable and Raw Water Actual (DWR Table 4-1) Additional Description 2015 Actual Level of Treatment when Delivered Volume, ac-ft/yr Single-family Drinking water 23,815 Multi-family Drinking water 3,594 Commercial Drinking water 6,254 Industrial Drinking water 63 Institutional/governmental Includes large landscapes Drinking water 2,166 Other Includes construction meters Drinking water 38 Losses 2,483 Total 38,413 Two major factors that affect water usage are weather and water conservation. Historically, when the weather is hot and dry, water usage increases. The amount of increase varies according to the number of consecutive years of hot, dry weather and the conservation activities imposed. During cool and wet years, water usage decreases because of less irrigation demand for external landscaping. Water conservation measures have limited increases in demand. Water use declined in 2015 as a result of the governor s mandated demand reductions. It is not known to what extent per capita water use will rebound to pre-drought levels once the drought ends. The District s projected water demand is based on the projected acreage in each land use category and water use duty factors (WDFs) by customer category. Development is anticipated in the urban areas of Palmdale and Lancaster. Little growth is anticipated outside of those areas. The projected acreage is based on the amount of land that is vacant or currently planned for redevelopment from A list of WDFs for each land use type is provided in the 2010 IRUWMP (LACDPW 2011). Parcels that are supplied by another water source were excluded so that they would not be counted as vacant and potentially developed land. 3-1 LAC WW- D40AV 2015 UWMP Final_02_07_2017.docx
22 Section Urban Water Management Plan A summary of the WDFs for each land use type is found in Table 3-2. District 40 Land Use Type Table 3-2. District 40 Water Use Duty Factor by Land Use Type Water Use Duty Factor, ac-ft/yr/ac Single-family 3.90 Multi-family 2.50 Commercial 2.25 Heavy industry 0.30 Light industry 1.10 Institutional/governmental 2.60 Mixed use 2.50 Note: Factors include water losses. Table 3-3 summarizes the projected demands for potable and raw water usage by use type for the District. Use Type Table 3-3. Retail: Demands for Potable and Raw Water Projected (DWR Table 4-2) Additional Description Projected Water Use, ac-ft/yr Single-family 66,410 74,330 82,170 90,020 Multi-family 3,590 4,020 4,440 4,870 Commercial a 5,050 4,450 3,840 3,230 Industrial 5,380 6,030 6,660 7,300 Institutional/governmental a 1,680 1,480 1,280 1,080 Losses b 6,180 6,800 7,410 8,020 Total 88,290 97, , ,520 a. Commercial and institutional potable water demands are shown. Recycled water is assumed to be used for the remainder of water use projected for commercial and institutional use types as presented in Table 5-6, below. b. Losses are assumed to be 7% of projected water demand. Table 3-4 below summarizes the current and projected demands for potable, recycled, and raw water usage by the District. The District does not currently use or project to use recycled water, although recycled water is used and sold by others within the service area as described in Section 5. Potable and raw water (from DWR Tables 4-1 and 4-2) Recycled water demand (from DWR Table 6-4) Table 3-4. Retail: Total Water Demands, ac-ft/yr (DWR Table 4-3) ,413 88,290 97, , , ,200 10,900 13,600 16,300 Total water demand 38,663 96, , , ,820 Note: 2015 reflects water conservation mandated by the State political climate reflects future water committed for developments. The WDFs reflect average normal water year demand before taking into consideration savings from water conservation. 3-2 LAC WW- D40AV 2015 UWMP Final_02_07_2017.docx
23 2015 Urban Water Management Plan Section Distribution System Water Losses Water losses in the District s water system for 2015 are presented in Table 3-5. It is approximately 6 percent of the 2015 amount of water supplied. The District s water distribution system consists of 1,050 miles of distribution pipelines and transmission mains. A detailed water loss analysis following the American Water Works Association (AWWA) method is provided in Appendix E. The water audit is an accounting exercise that tracks all sources and uses of water within a water system over a specified period. Table 3-5. Retail: Water Loss Audit Reporting (DWR Table 4-4) Reporting Period Start Date (Month/Year) Loss, ac-ft/yr a 1/2015 2,483 a. Taken from the field Water Losses, which is a combination of apparent losses and real losses from the AWWA worksheet provided in Appendix E. 3.3 Estimating Future Water Savings Water savings from codes, standards, ordinances, or transportation and land use plans, are also known as passive savings. These various factors generally decrease the water use for new and future customers, compared to historical customers. These are not estimated for projected water demands. Below is a summary of the applicable State codes and ordinances that could reduce the District s water demand in the future based on information provided in the DWR 2015 UWMP Guidebook, and in the General Plan documents for the Cities of Palmdale and Lancaster (DWR 2016a; City of Lancaster Planning Department 2013). Model Water Efficient Landscape Ordinance. Effective December 1, 2015, this new ordinance is projected to reduce the typical residential outdoor landscape demands for new construction by up to 20 percent from the estimated demand using the prior ordinance provisions. Commercial landscape for new construction may reduce outdoor water demand by up to 35 percent over the prior ordinance. California Energy Commission Title 20 Appliance Standards for Toilets, Urinals, Faucets, and Showerheads. This standard will impact both new construction and replacement fixtures in existing homes. This is included in the California Green Building Standards Code (CALGreen) assumption for new construction described below. CALGreen Building Code. Requires residential and non-residential water efficiency and conservation measures for new buildings and structures. The County Board of Supervisors incorporated CALGreen building code standards into the Green Building Standards Code (Title 31), which together with Title 12 Chapter compose the County s primary green building and low-impact development standards. It is assumed that this code will reduce residential and non-residential indoor water on new construction by up to 20 percent. The City of Palmdale has a Water Efficient Landscape Ordinance (Ordinance 1262, adopted October 2008), a list of approved plants and trees to use for landscaping, and requirements for new development to calculate a water use budget. 3-3 LAC WW- D40AV 2015 UWMP Final_02_07_2017.docx
24 Section Urban Water Management Plan Future water savings, as a result of changes in building codes and in voluntary conservation efforts, are not included in future water demand projections because of the need to obtain an adequate water supply. Low-income residential demands are included in projections as shown in Table 3-6. Table 3-6. Retail Only: Inclusion in Water Use Projections (DWR Table 4-5) Future water savings included? (Y/N) If Yes to above, state the section or page number where citations of the codes, ordinances, etc. utilized in demand projections are found Are lower-income residential demands included in projections? (Y/N) N N/A Y 3.4 Water Use for Lower-Income Households Section of the CWC requires inclusion of projected water use for lower-income single-family and multi-family residential households as identified in the housing element of any city, county, or city and county in the service area of the water purveyor. Lower income is established by the State as 80 percent of the area median income. The projections are meant to assist water purveyors in complying with the requirements of Government Code Section , which requires water purveyors to grant a priority for the provision of water and sewer services to proposed developments that include housing units affordable to lower income households. Table 3-7 below shows the estimated low-income projected water demands for the service area. The low-income water demand projections were based on 41 percent of demand for the service area. Housing needs assessments in the general plans of both the cities of Lancaster and Palmdale were used to identify the projected low-income housing units for the study area (City of Lancaster Planning Department 2013). For the City of Lancaster, 54 percent of the households fall within the lowincome threshold, defined as having a household income of less than 80 percent of mean family income (City of Lancaster Planning Department 2013). For the City of Palmdale, this was approximately 41 percent (2012). These projected low-income water demand projections are included in Tables 3-3 and 3-4 above because water use projections are based on general plan land use and water use factors. Table 3-7. Projected Potable Water Demands for Low-Income Housing, ac-ft/yr District service area 15,750 39,560 44,280 48,950 53, LAC WW- D40AV 2015 UWMP Final_02_07_2017.docx
25 Section 4 SBX7-7 Baseline and Targets This section describes the District s SB X7-7 gpcd baseline and targets as updated from the analysis conducted as part of the 2010 UWMP. Compliance with the 2015 interim target is also discussed. 4.1 Updated Calculations from 2010 UWMP The District s 2010 UWMP provided calculations and a resulting 2015 and 2020 gpcd target based on the DWR methodology (DWR 2016b). Since the adoption of the 2010 UWMP, the 2010 census data are now available at the census block level of detail. Also since the adoption of the 2010 UWMP, DWR has developed an online population tool and SB X7-7 verification tables that the District is required to complete with the updated Census data to determine the updated SB X7-7 baseline and target gpcd. The District s completed verification tables are provided in Appendix F of this UWMP. 4.2 Baseline Periods In this 2015 UWMP, the District changed the years selected for its baseline periods from what was selected in the 2010 UWMP. Two baseline periods are used in the calculation of the gpcd target to 15-Year Baseline Period (Baseline gpcd) The District must select either a 10- or 15-year baseline period ending between December 31, 2004, and December 31, 2010, for water use and calculate the average water use, in gpcd, over the selected baseline period. Whether the District uses a 10-year baseline period or 15-year baseline period is dependent upon the amount of recycled water use in Only water suppliers that have recycled water use greater than 10 percent of their total demand are allowed to select a 15-year baseline period. Because the District did not use recycled water in 2008, the District must use a 10-year baseline period. The District s selected 10-year baseline period is 1996 to 2005, as shown in SB X7-7 Table 1, located in Appendix F. This 10-year baseline period is different from that of the 2010 UWMP, which was from 1995 to Year Baseline Period (Target Confirmation) The District must also calculate water use, in gpcd, for a 5-year baseline period. This is used to confirm that the selected 2020 target meets the minimum water use reduction requirements. This is a continuous 5-year period that ends no earlier than December 31, 2007, and no later than December 31, The District s selected 5-year baseline period is , as shown in SB X7-7 Table 1, located in Appendix F. This is the same period selected in the 2010 UWMP. 4.3 Service Area Population To calculate the annual baseline gpcd, the District must determine the population that was served for each baseline year for both the baseline periods and for the 2015 compliance year. The District conducted this baseline population analysis as part of the 2010 UWMP based on the year 1990 and 2000 census. The year 2010 census data at the block level of detail were not available until after the 2010 UWMP submittal deadline. For this 2015 UWMP, the District is required to recalculate its 4-1 LAC WW- D40AV 2015 UWMP Final_02_07_2017.docx
26 Section Urban Water Management Plan baseline population using 2010 census data. As a result of this analysis update, which is described in Section 2.3, the historical population served by the District is shown in SB X7-7 Table 3, located in Appendix F. 4.4 Gross Water Use Gross water use is the measure of water that enters the District s distribution system over a 12-month period with certain allowable exclusions. These allowable exclusions are recycled water delivered within the service area, recycled water, water placed into long-term storage, water conveyed to another urban supplier, water delivered for agricultural use, and process water. The District s historical gross water use for the baseline years is shown in SB X7-7 Table 4 located in Appendix F. 4.5 Per Capita Water Use The District s baseline and target per capita water use are described in this section. It should be noted that per capita water use (gpcd) as used in the UWMP is different from R-gpcd that is used in drought reporting to the State Water Resources Control Board (SWRCB). The gpcd uses the total water use within a service area. This includes residential and CII/governmental water uses. R-gpcd uses estimated residential water use in a service area divided by population. It is used for drought reporting to comply with the governor s drought declarations and executive orders Baseline Daily Per Capita Water Use The gpcd water use or daily per capita water use, as defined in this UWMP, is the amount of water used per person per day. The daily per capita water use for each year of the two baseline periods is calculated by dividing the gross water use for each year by the service area population for each year. The District s baseline daily per capita use is presented in SB X7-7 Table 5, located in Appendix F. The resulting 5- and 10-year baseline per capita demands are shown in SB X7-7 Table 6, located in Appendix F. The updated 10-year baseline period per capita water use is 281 gpcd. The updated 10- year baseline period per capita water use is less than the 2010 UWMP analysis, which developed a baseline per capita water use of 353 gpcd and 2020 gpcd Targets Per the law as adopted in SB X7-7, the District must establish per capita water use targets using one of four target methods, described as follows: Method 1: 80 percent of the urban retail supplier s baseline per capita daily water use Method 2: the per capita daily water use that is estimated using the sum of several defined performance standards: 55 gallons per day (gpd) for indoor residential water use Water efficiency equivalent to the standards of the Model Water Efficient Landscape Ordinance for landscape irrigated through dedicated or residential meters or connections A 10 percent reduction in CII uses from the baseline CII water use by 2020 Method 3: 95 percent of the applicable State hydrologic region target, as outlined in the State s Methodologies document (DWR 2016b) Method 4: Calculated water savings based on indoor residential water savings, metering savings, CII savings, and landscape and water loss savings, as outlined in DWR s Provisional Method 4 for Calculating Urban Water Use Targets in the Methodologies document (DWR 2016b) 4-2 LAC WW- D40AV 2015 UWMP Final_02_07_2017.docx
27 2015 Urban Water Management Plan Section 4 Regardless of which of the four target methods is adopted by the District, if the 5-year baseline water use is more than 100 gpcd, the District must compare two target gpcd values: 95 percent of the 5-year baseline daily per capita water use The target determined by the target method the District selects from the four methods allowed The 2020 gpcd target is the lower of the two values. A summary of the District s baseline periods and targets is provided in Table 4-1. The District s interim urban water use target is the value halfway between the 10-year baseline gpcd (from SB X7-7 Table 5, located in Appendix F) and the confirmed 2020 gpcd target (from SB X7-7 Table 7, located in Appendix F). Table 4-1. Baselines and Targets Summary Retail Agency or Regional Alliance Only (DWR Table 5-1) Baseline Period Start Year End Year Average gpcd 2015 Interim Target Confirmed 2020 Target 10- to 15-year year In the 2010 IRUWMP the District selected Target Method 1 to determine its urban water use target (LACDPW 2011). Based on Target Method 1 in the 2010 UWMP, the District s 2020 target was 282 gpcd with an interim 2015 target of 318 gpcd. In this 2015 UWMP gpcd analysis, with the updated historical population analysis incorporating the 2010 census data described in Section 2, the District has selected to remain with Target Method 1, which now provides a 2020 target of 225 gpcd, with an interim 2015 target of 253 gpcd. A summary of the analysis of gpcd targets for the 2010 UWMP and the 2015 UWMP is provided in Table 4-2. Table 4-2. Comparison of 2010 and 2015 Baselines and Targets Analysis Year Target Method to Calculate 2020 Target 1: 80% of baseline use in 10-year period ( ) 1: 80% of baseline use in 10-year period ( ) 2020 Target 2015 Interim Target Adjustments to 2015 Gross Water Use and 2015 Compliance Allowable adjustments can be made to the District s 2015 gross water use for extraordinary events, economic adjustments, or weather normalization. The District did not adjust its 2015 gross water use, as shown in Table 4-3 below. Also shown in Table 4-3, the District achieved the targeted gpcd value for It is expected that the District s gpcd will increase from the 2015 actual values in the future assuming drought conditions do not continue. The District is on track to meet its 2020 target. 4-3 LAC WW- D40AV 2015 UWMP Final_02_07_2017.docx
28 Section Urban Water Management Plan Table Compliance Retail Agency or Regional Alliance Only (DWR Table 5-2) Actual 2015 gpcd 2015 Interim Target gpcd Extraordinary Events Optional Adjustments to 2015 gpcd Enter 0 for Adjustments Not Used from Methodology 8 Economic Adjustment Weather Normalization Total Adjustments Adjusted 2015 gpcd 2015 gpcd (adjusted if applicable) Did Supplier Achieve Targeted Reduction for 2015? Y/N Y Note: 2015 reflects water conservation mandated by the State political climate. All values are in gpcd. 4-4 LAC WW- D40AV 2015 UWMP Final_02_07_2017.docx
29 Section 5 System Supplies The District uses both purchased (i.e., imported) water and groundwater as its supply sources. The Antelope Valley can anticipate receiving water from purchased imported water, local groundwater, and other sources. This section describes the District s existing and projected water supplies. 5.1 Purchased Water The District purchases water from the Antelope Valley East Kern Water District (AVEK). AVEK s largest municipal customer is the District. AVEK is a regional water agency formed in 1959 to supplement Antelope Valley groundwater supplies with surface water supplies. AVEK receives water from the State Water Project (SWP) and allocates water to municipalities, ranchers, and agricultural water users. AVEK has an allocation of 144,844 acre-feet per year (ac-ft/yr) of water from the SWP. The maximum allocation a contractor can receive in any year is called its Table A amount. On average, studies have shown that contractors receive about 60 percent of their Table A amount each year (AVRWMG 2007). To maximize the use of its SWP supplies, AVEK has developed the Westside Water Bank within its service area and has entered into various exchange programs with other SWP contractors. Through the Westside Water Bank facilities, AVEK can take delivery of SWP supplies exceeding its customers demands for use as groundwater recharge (recharge capacity currently estimated to be approximately 36,000 ac-ft/yr) for future recovery in dry years Water Banking AVEK is also able to purchase additional SWP supplies from DWR (such as Article 21 and turnback pool water) when available (AVEK 2016). The District has purchased banked groundwater to use for future dry years when supplies from the SWP and groundwater will not meet demands in the future. The maximum recovery volume is proposed to be about 36,000 ac-ft/yr. A 10 percent loss factor is applied to groundwater recharged for the Westside Water Bank to account for evapotranspiration (ETo) and other losses during recharge and conveyance as well as typical metering accuracy. Additional details can be found in the AVEK 2015 UWMP (AVEK 2016). Projections for future deliveries of SWP water are estimated based on DWR s 2015 update of the SWP Delivery Capability Report (DCR), a biennial report to assist SWP contractors and local planners in assessing the near- and long-term availability of supplies from the SWP (DWR 2015b). DWR s estimates of SWP deliveries are based on a computer model that simulates monthly operations of the SWP and Central Valley Project systems. Table C.7 from the 2015 DCR shows the results of the Early Long-Term (ELT) scenario for modeling SWP supplies for AVEK s Table A supply (AVEK 2016). These supply estimations and basis of water years are used for analyzing the reliability of AVEK supply. Water banking is a crucial strategy that water purveyors will use to help navigate the uncertainties in the availability of water supplies for the study area. Water banking involves storing water when it is available in wet years or low-demand periods and subsequently recovering it in periods of drought or high demand. The three methods of banking contemplated for the study area are in-lieu groundwater basin recharge, groundwater basin recharge through surface percolation, and aquifer storage and recovery (ASR). These opportunities are located inside and outside of the Antelope Valley. Generally, 5-1 LAC WW- D40AV 2015 UWMP Final_02_07_2017.docx
30 Section Urban Water Management Plan water banking within the Antelope Valley is preferred over those outside because risks of disruption because of conveyance interruptions are minimized. However, potential water banking opportunities within the Antelope Valley require additional development. In evaluating water banking requirements, two characteristics must be established: the required volume of water in storage, and the required pump-back capacity for the most severe 3-year delivery projection. The 3-year drought sequence is commonly used for water supply planning in California and in UWMPs. The requirements are calculated by comparing projected demand to the sum of available groundwater and SWP supplies during a worst-case 3-year drought scenario composed of two 35 percent SWP allocations followed by a 7 percent SWP allocation. In the event that the annual SWP allocation is less than demand, water that has been stored through in-lieu groundwater basin recharge will typically be used first to make up the difference between demand and SWP supply. If maximum groundwater extraction capacity is insufficient to make up the difference, additional banking methods such as storage of carry-over water in SWP reservoirs or groundwater basin recharge through surface percolation are required. To meet the banked water supply targets in the future, the water retailers in the study area will store sufficient quantities of available supplies in years when supply conditions permit. These targets dictate how the present year s water resources are used. The supply targets increase with demand, and must be recalculated annually. In a similar manner, present-year operations must be modified annually to account for the recalculated targets. Upon adjudication of the Antelope Valley Groundwater Basin, it is anticipated that each water retailer will be able to save credits for not fully utilizing its adjudicated groundwater right in a given year, thus saving unused groundwater for use when SWP supply is limited or interrupted. SWP reservoir storage is crucial to meeting the carry-over and banked supply targets. In the event that a water retailer does not use its full entitlement of SWP water in a given year, AVEK can store the remainder in San Luis Reservoir. Unfortunately, in the event of a high allocation the following year, that quantity of carry-over water may be lost because of limited reservoir capacity. In this case, this carry-over supply can be moved to a water bank for future use. Conversely, if the next year s SWP allocation is insufficient to meet demand, the carry-over supply can be moved into the study area. Banked supply will be used in the event that demand is greater than the sum of the currentyear SWP allocation, available carryover, and maximum groundwater extraction capacity Antelope Valley Water Bank The Antelope Valley Water Bank (AVWB) encompasses an 18-square-mile area totaling roughly 13,440 acres, of which 1,482 acres would be dedicated for spreading basins. More specifically, there would be 11 spreading basins, each approximately 160 acres except for one 40-acre basin, and up to 40 new recovery wells. At full buildout, the AVWB will be a water banking facility capable of 100,000 ac-ft/yr of recharge, 100,000 ac-ft/yr of recovery, and 500,000 ac-ft of total storage capacity within the underlying aquifer. Accordingly, the AVWB would contribute to accomplishing the goal of making more water available, through recharge and recovery, to meet existing and future water requirements in the Antelope Valley and other regions in Southern California during periods when surface water supplies are deficient AVEK s Water Supply Stabilization Project 2 AVEK has analyzed locations and methods for water storage in the Antelope Valley region. Water Supply Stabilization Project 2 (WSSP2) is a groundwater basin banking project that was selected based on studies performed by the U.S. Geological Survey (USGS). Based on USGS s work, it is expected that the percolation rate of raw water placed in the recharge area will average about 0.5 foot per day on 400 acres of the 1,400-acre site. Raw water will be delivered to the site through 5-2 LAC WW- D40AV 2015 UWMP Final_02_07_2017.docx
31 2015 Urban Water Management Plan Section 5 three existing turnouts that are capable of delivering up to 30,000 ac-ft of water during a proposed recharge cycle. A total recharge of approximately 190 ac-ft per day is expected Semitropic Water Storage Bank The Semitropic Water Storage District (Semitropic) is located in the San Joaquin Valley in north-central Kern County, about 20 miles northwest of Bakersfield and immediately east of the California Aqueduct. Semitropic was originally formed in 1958 with the expectation of receiving water from the SWP and surplus water from the Kern River. In 1995, Semitropic began implementation of the Semitropic Groundwater Banking and Exchange Program by using a portion of the available immense groundwater storage capacity (approximately 1 million ac-ft out of over 3 million ac-ft). This long-term water storage program was designed to recharge groundwater and reduce overdraft, increase operational reliability and flexibility, and optimize the distribution and use of available water resources between Semitropic and the banking partners. The existing Semitropic water bank has a storage capacity of 1 million ac-ft, a recharge capacity of 90,500 ac-ft/yr, a firm extraction capacity of 90,000 ac-ft/yr through the pump-back and physical return of groundwater to the SWP facilities, and the ability to return up to 133,000 ac-ft/yr through exchange of Table A SWP entitlement. Approximately 700,000 ac-ft are currently in storage. This program is currently fully operational and is a proven and working water bank. Semitropic is in the process of a second phase of the groundwater banking program called the Stored Water Recovery Unit (SWRU). The SWRU will increase storage by 650,000 ac-ft to a maximum of 1.65 million ac-ft, and increase recovery capacity by 200,000 ac-ft/yr for a total guaranteed or pump-back capacity of 290,000 ac-ft/yr. This means that the Semitropic water storage bank, including its entitlement exchange capability of up to 133,000 ac-ft/yr, will be able to deliver up to 423,000 ac-ft/yr of dry year yield to the California Aqueduct Acquisition of New Water Supply Even with the urban water conservation and the increased use of recycled water to reduce existing potable water demands, the existing and committed demands and existing water supplies are approximately equal. Additional water supplies will have to be acquired and imported into the Antelope Valley to meet the demands associated with the level of growth projected for the service area. To acquire these additional water supplies, the District has executed a Memorandum of Understanding (MOU) with AVEK to implement a new Water Supply Entitlement Acquisition program for new developments that will be used to acquire additional imported water supplies. Developers may secure entitlements by entering into agreements with the District to purchase a permanent water supply. The volume of new water supply needed to serve a project is determined by the District upon review of water demand calculations submitted by developers. The developers must pay the deposit prior to obtaining a will-serve from the District. The District will transfer the deposit to AVEK to acquire the new water supply, which will be allocated to the District. 5.2 Groundwater Groundwater has historically been the secondary source of potable water supplies. The District is aiming to minimize groundwater drawdown and is currently exploring the use of ASR to store recycled water for use in dry years. 5-3 LAC WW- D40AV 2015 UWMP Final_02_07_2017.docx
 entered a judgment and physical solution in the Antelope Valley Groundwater Cases (Appendix G).")
32 Section Urban Water Management Plan Basin Description and Adjudication The groundwater basin underlying the District is the Antelope Valley Groundwater Basin (6-44). In December 2015, the Superior Court of California (Court) entered a judgment and physical solution in the Antelope Valley Groundwater Cases (Appendix G). Based on the Court s findings that the Antelope Valley Groundwater Basin is currently in overdraft, the judgment and physical solution imposes pumping restrictions, which will be fully implemented following a 7-year ramp-down period starting in It is assumed for this UWMP that the District will have an annual pumping right of approximately 23,005 ac-ft/yr based on the rights the District will have in judgment and a related lease agreement with AVEK. The District s groundwater volumes associated with the adjudicated right have been included in Table 5-1 below. DWR Bulletin-118 does not identify the basin as being in overdraft, but describes subsidence that has occurred (DWR 2004). The groundwater basin and Antelope Valley watershed are shown in Figure 5-1 (LACDPW 2014). It has been divided into 12 sub-basins by USGS. Boundaries are based on faults, groundwater divides, and, in some cases, arbitrary boundaries. Figure 5-1. Groundwater Sub-basin of Antelope Valley (from the 2014 Salt and Nutrient Plan) 5-4 LAC WW- D40AV 2015 UWMP Final_02_07_2017.docx
33 2015 Urban Water Management Plan Section 5 The Antelope Valley Groundwater Basin is composed of two primary aquifers: the upper (principal) aquifer and the lower (deep) aquifer. The principal aquifer is an unconfined aquifer and historically provided artesian flows because of perched water tables in some areas. These artesian conditions are currently absent because of extensive pumping of groundwater. Separated from the principal aquifer by clay layers, the deep aquifer is generally considered to be confined. The Antelope Valley is a closed basin and the only major groundwater outflow is groundwater pumping. The total storage capacity of the Antelope Valley Groundwater Basin has been reported at 68 million ac-ft (DWR 2004). The groundwater basin is recharged principally by deep percolation of precipitation and runoff from the surrounding mountains and hills. For the Lancaster sub-unit that underlies most of the District s service area, depths to water levels vary widely, being generally greater in the south and west. As noted above, groundwater moves into the sub-unit from the Neenach, West Antelope, and Finger Buttes sub-units. Groundwater also moves into the principal aquifer from the Buttes and Pearland sub-units. Groundwater has been, and continues to be, an important resource within the Antelope Valley region. Prior to 1972, groundwater provided more than 90 percent of the total water supply in the Antelope Valley region; since 1972, it has provided between 50 and 90 percent (USGS 2003). Groundwater pumping in the Antelope Valley region peaked in the 1950s, and it decreased in the 1960s and 1970s when agricultural pumping declined because of increased pumping costs from greater pumping lifts and higher electric power costs (USGS 2000). The rapid increase in urban growth in the 1980s resulted in an increase in the demand for municipal and industrial (M&I) water and an increase in groundwater use. From the 1990s to the present, agricultural uses have significantly increased groundwater production and exacerbated the drop in groundwater levels across the basin. In 1999, agricultural interests filed for litigation seeking to determine rights to groundwater. Subsequently, public water purveyors, including the District, filed a cross-complaint seeking an adjudication of groundwater rights and a physical solution. These lawsuits and others were joined in a coordinated and consolidated action known as the Antelope Valley Groundwater Cases (Appendix G). In December 2015, after a number of trial phases and a settlement reached among the majority of parties, the Court entered judgment. During the trial phases, the Court determined, inter alia, the basin boundaries: that the total safe yield of the basin is 110,000 ac-ft/yr, that the native safe yield of the basin is 82,500 ac-ft/yr, and that the basin has been in a state of overdraft for over 61 years. The judgment allocates rights to pump groundwater, including the pumping rights of the water purveyors, and sets forth a physical solution. Under the judgment, the District has the right to pump approximately 20,005 ac-ft/yr of groundwater including an allocated right to pump 6,789 ac-ft/yr of the native safe yield, the right to pump 55 percent of the unused portion of the federal reserved right, and imported water return flows. Thirty-nine percent of the previous 5-year average of imported water used by the District is available for pumping in any given year. The annual return flows do not include imported water stored in the basin (i.e., banked water). Banked water is a supply source that will be used in dry hydrology years where SWP supplies are not available. Also, under a separate lease agreement, the District has the right to pump approximately 3,000 ac-ft/yr in groundwater rights allocated to AVEK. A summary of groundwater and associated rights is provided in Table 5-1. Relevant documents regarding the adjudication decision and Web links are found in Appendix G. 5-5 LAC WW- D40AV 2015 UWMP Final_02_07_2017.docx
34 Section Urban Water Management Plan Description of Right Table 5-1. Groundwater Volumes Determined from Adjudication District 40 Annual Groundwater Right (ac-ft) Non-overlying production right 6,789 55% of the unused federal reserve right 3,300 AVEK lease 3,000 Imported water return flows (39% of annual average of imported supplies of 25,425 over the last 5 years) 9,916 Total 23,005 Other known groundwater users in the Antelope Valley Groundwater Basin (4-66) are listed in Table 5-2. AVEK LCID PWD QHWD RCSD Table 5-2. Other Known Groundwater Basin Users Edwards Air Force Base Agricultural water users/farmers Cal Water Note: The adjudication document (Appendix G) includes a complete list of users of the groundwater basin Groundwater Quality Groundwater quality is good and considered to be generally suitable for domestic, agricultural, and industrial uses. The groundwater has a total dissolved solids (TDS) concentration ranging from 126 milligrams per liter (mg/l) to 1,200 mg/l. Hardness levels range from 15 to 260 mg/l and high arsenic, chromium-6, and nitrates are detected in some areas within the District causing those wells to be turned off Groundwater Management This section describes the groundwater management efforts that have been occurring in the Antelope Valley Groundwater Basin (4-66). The basin was recently adjudicated in As part of the judgment, a Watermaster board was appointed by the Court to implement and enforce the judgment. The Watermaster board is empowered to impose a replacement fee on any party that pumps more than its allocated right. The Watermaster board is composed of one representative each from AVEK and the District, one other public water supplier representative, and two landowner representatives. Activities to meet the Sustainable Groundwater Management Act (SGMA) requirements are also described. 5-6 LAC WW- D40AV 2015 UWMP Final_02_07_2017.docx
35 2015 Urban Water Management Plan Section Groundwater Management Plan The Antelope Valley Regional Water Management Group (RWMG) meets the requirements of Assembly Bill (AB) 3030 for the development of a groundwater management plan (GWMP). A copy of the IRWMP and update can be found at: The Antelope Valley RWMG was formed in 2006 by 11 agencies. They signed an MOU and developed the Antelope Valley IRWMP in The Antelope Valley RWMG includes the District, AVEK, Antelope Valley State Water Contractors Association (AVSWCA), City of Lancaster, City of Palmdale, Littlerock Creek Water District (LCID), Los Angeles County Sanitation Districts (LACSDs) 14 and 20, Palmdale Water District (PWD), QHWD, and Rosamond Community Service District (RCSD) Salt and Nutrient Management Plan As a follow-up to the IRWMP update, a Salt and Nutrient Management Plan (SNMP) was developed in 2014 to address the concern for protecting the beneficial uses of groundwater basins and anticipate impacts of using and storing recycled water within the groundwater basin. A monitoring plan is included as part of the SNMP and is used to track the water quality within the basin and compare water quality with those predicted in its models. The monitoring program includes 32 municipal water supply wells. Water quality data is reported to the California Division of Drinking Water Sustainable Groundwater Management Act The SGMA was enacted by the legislature in 2014, with subsequent amendments in The SGMA requires groundwater management in priority groundwater basins. The designation of the priority of groundwater basins was done as part of the California Statewide Groundwater Elevation Monitoring (CASGEM) Program. The CASGEM Program was developed in response to legislation enacted in California s 2009 Comprehensive Water package. The CASGEM Groundwater Basin Prioritization is a statewide ranking of groundwater basin importance that incorporates groundwater reliance and focuses on basins producing greater than 90 percent of California s annual groundwater. The CASGEM Program has ranked the Antelope Valley Groundwater Basin (4-66) as high priority. The SGMA directs DWR to identify groundwater basins and sub-basins in conditions of critical overdraft. DWR identified such basins in Bulletin-118 (DWR 2004). DWR issued an updated draft list of critically overdrafted basins in July The Antelope Valley Groundwater Basin (4-66) is not on the list Historical Groundwater Pumping Table 5-3 presents the amount of groundwater pumping by the District that has occurred over the last 5 years. Table 5-3. Retail: Groundwater Volume Pumped, ac-ft/yr (DWR Table 6-1) Supplier does not pump groundwater. The supplier will not complete the table below. Groundwater Type Location or Basin Name Alluvial basin Antelope Valley Groundwater Basin 17,114 20,361 19,964 25,982 18,049 Total 17,114 20,361 19,964 25,982 18, LAC WW- D40AV 2015 UWMP Final_02_07_2017.docx
36 Section Urban Water Management Plan 5.3 Stormwater Stormwater is not currently used as an urban water supply source. As described in Section 3 above, the ETo rates are greater than precipitation rates. No plans are proposed by the District to divert stormwater runoff as a water source. Projects are currently proposed by neighboring districts for stormwater capture, including the Amargosa Creek stormwater runoff recharge and retention basin projects. 5.4 Wastewater and Recycled Water The purpose of this section is to provide information on recycled water and its potential as a resource for the District. The elements of this section include: (1) the quantity of wastewater generated in the service area; (2) description of the collection, treatment, and disposal/reuse of that wastewater; (3) current water recycling systems; and (4) the potential for water recycling in the service area Recycled Water Coordination LACSD is responsible for the treatment, and disposal of wastewater in the District s service area. The Cities of Lancaster and Palmdale own, inspect, operate, and maintain the collection system within their city boundaries. LACSD owns the trunk lines that convey wastewater to the treatment plants. LACSD owns and operates the Lancaster Water Reclamation Plant (WRP) and Palmdale WRP, which provide treatment to tertiary levels that are suitable for non-potable uses and groundwater recharge. Recycled water is retailed by the City of Lancaster and Palmdale Recycled Water Authority. Service area boundaries are shown in Figure 5-2, below. 5-8 LAC WW- D40AV 2015 UWMP Final_02_07_2017.docx

37 2015 Urban Water Management Plan Section 5 Figure 5-2. Recycled and Wastewater Service Areas 5-9 LAC WW- D40AV 2015 UWMP Final_02_07_2017.docx
38 Section Urban Water Management Plan Wastewater Collection, Treatment, and Disposal Municipal wastewater is generated from a combination of residential and commercial sources. The quantity of wastewater generated is proportional to the population and water use in the service area. Estimates of wastewater generated within the District s service area are presented in Table 5-4, below. Wastewater is collected by gravity in a series of main, trunk, and interceptor sewers. The Cities of Lancaster and Palmdale own, operate and maintain the wastewater collection system in their respective service areas. District 14 of LACSD owns, operates, and maintains the wastewater trunk system in the city of Lancaster and the Lancaster WRP. The Lancaster WRP has a permitted capacity of 18 million gallons per day (mgd) of tertiary treated water that is used for irrigation, agriculture, urban reuse, wildlife habitat, maintenance, and recreational impoundments. District 20 of LACSD owns, operates, and maintains the wastewater trunk system and Palmdale WRP. The permitted capacity is 12 mgd. The tertiary treated water is used for agriculture, irrigation, and maintenance. A summary of wastewater volumes treated, discharged, and recycled by the cities and LACSD in 2015 is provided in Table 5-5, below. Wastewater that is collected from the District service area is treated and discharged outside of the District s service area. Recycled water is projected to be used in and around the service area. The Palmdale Recycled Water Authority jointly studies, promotes, develops, distributes, constructs, installs, finances, uses, and manages recycled water resources created by LACSD District 14 and LACSD District 20 for any and all reasonable and beneficial uses including the irrigation and recharge and to finance the acquisition and construction or installation of recycled water facilities, recharge facilities, and irrigation systems LAC WW- D40AV 2015 UWMP Final_02_07_2017.docx
39 2015 Urban Water Management Plan Section 5 Table 5-4. Wastewater Collected within Service Area in 2015, ac-ft/yr (DWR Table 6-2) There is no wastewater collection system. The supplier will not complete the table below. --% Percentage of 2015 service area covered by wastewater collection system (optional). --% Percentage of 2015 service area population covered by wastewater collection system (optional). Name of Wastewater Collection Agency Wastewater Collection Wastewater Volume Metered or Estimated? Volume of Wastewater Collected in 2015, ac-ft/yr Name of Wastewater Treatment Agency Receiving Collected Wastewater Recipient of Collected Wastewater Treatment Plant Name Is WWTP Located within UWMP Area? Is WWTP Operation Contracted to a Third Party? (optional) City of Lancaster Metered 17,925 Los Angeles County Sanitation District 14 Lancaster WRP No No City of Palmdale Metered 10,434 Los Angeles County Sanitation District 20 Palmdale WRP No No Total wastewater collected from service area 28,359 WWTP = wastewater treatment plant. Wastewater Treatment Plant Name Discharge Location Name or ID Table 5-5. Retail: Wastewater Treatment and Discharge within Service Area in 2015, ac-ft/yr (DWR Table 6-3) Discharge Location Description Wastewater Discharge ID Number No wastewater is treated or disposed of within the UWMP service area. Method of Disposal Does This Plant Treat Wastewater Generated Outside the Service Area? Treatment Level Wastewater Treated 2015 volumes (ac-ft) Discharged Treated Wastewater Recycled Within Service Area Recycled Outside of Service Area Lancaster WRP Wetlands Tertiary 17,927 6, ,631 Palmdale WRP Tertiary 10,435 1,179 9,256 Total 28,362 7, , LAC WW- D40AV 2015 UWMP Final_02_07_2017.docx
40 Section Urban Water Management Plan Recycled Water System The existing recycled water system is located outside of the District s service area. It is located nearby within the city of Palmdale and outside of the city of Lancaster. The system is operated by the Palmdale Recycled Water Authority. The Antelope Valley Backbone provides the necessary distribution infrastructure to convey recycled water to users, and thereby offset potable water demands in the Antelope Valley. Currently, only a portion of the Antelope Valley Backbone is constructed. As future funding sources are identified, the Antelope Valley Backbone will be connected to the Lancaster WRP. Once the northern and southern portions of the Antelope Valley Backbone are linked and the Lancaster WRP and the Palmdale WRP are both connected to the system, the Antelope Valley Backbone will have the redundancy necessary to ensure a reliable source of supply so that the recycled water service area can expand to serve additional recycled water demands. The District recycled water demands were determined with the inclusion of the cities of Lancaster and Palmdale demands, as detailed in the 2006 report, Final Facilities Planning Report, Antelope Valley Recycled Water Project prepared for the District (Kennedy Jenks, 2006) Recycled Water Beneficial Uses Beneficial uses include landscape irrigation for new development and industrial users along the Antelope Valley Backbone. Current beneficial uses of recycled water are agricultural reuse, urban irrigation, construction, wetland water, and at recreational impoundments. Potential uses of recycled water in the District service area may be planned by other entities and municipalities pending construction of the Antelope Valley Backbone. Tables 5-6 and 5-7 (below) show potential recycled water use within the service area as provided in the 2006 report, Final Facilities Planning Report, Antelope Valley Recycled Water Project prepared for the District (Kennedy Jenks, 2006) LAC WW- D40AV 2015 UWMP Final_02_07_2017.docx
41 2015 Urban Water Management Plan Section 5 Table 5-6. Retail: Current and Projected Recycled Water Direct Beneficial Uses within Service Area, ac-ft (DWR Table 6-4) Recycled water is not used currently. It is not planned for use within the service area of the supplier. Name of agency producing (treating) the recycled water Name of agency operating the recycled water distribution system LACSD Cities of Lancaster and Palmdale Supplemental water added in Source of 2015 supplemental water Agricultural irrigation Landscape irrigation (excludes golf courses) Golf course irrigation Beneficial Use Type General Description of 2015 Uses Level of Treatment Drop Down List N/A At institutional locations Tertiary 1,800 2,475 3,150 3,825 Commercial use Tertiary 6,150 8,175 10,200 12,225 Industrial use Geothermal and other energy production Seawater intrusion barrier Recreational impoundment Refill lake at Apollo Park Tertiary Wetlands or wildlife habitat Groundwater recharge IPR Surface water augmentation IPR Direct potable reuse Other IPR = indirect potable reuse LAC WW- D40AV 2015 UWMP Final_02_07_2017.docx
42 Section Urban Water Management Plan Table 5-7. Retail: 2010 UWMP Recycled Water Use Projection Compared to 2015 Actual, ac-ft (DWR Table 6-5) Recycled water was not used in 2010 nor projected for use in The supplier will not complete the table below. Agricultural irrigation Use type 2010 Projection for Actual Use Landscape irrigation (excludes golf courses) Golf course irrigation Commercial use Industrial use 5,400 0 Geothermal and other energy production Seawater intrusion barrier Recreational impoundment 250 Wetlands or wildlife habitat Groundwater recharge (IPR) Surface water augmentation (IPR) Direct potable reuse Other Total 5, Actions to Encourage and Optimize Future Recycled Water Use As recycled water is a reliable water source for all weather types, it is part of the current water supply portfolio and is expected to become a larger portion of the supply. One of the goals of the SNMP is to assess impacts and prioritize projects maximizing recycled water use in the service area. Efforts are currently under way to develop a regional recycled water distribution system in the Antelope Valley, also known as the Antelope Valley Backbone. Because of the size and scope of the project, it is a multi-agency, multi-jurisdictional project that will be implemented collectively. Financial incentives would be used to expand recycled water use, but they would be provided by the recycled water retailer (see Table 5-8). Section Name of Action Table 5-8. Retail: Methods to Expand Future Recycled Water Use (DWR Table 6-6) Supplier does not plan to expand recycled water use in the future. Supplier will not complete the table below but will provide narrative explanation. Provide page location of narrative in UWMP Description Planned Implementation Year Expected Increase in Recycled Water Use 5-14 LAC WW- D40AV 2015 UWMP Final_02_07_2017.docx
43 2015 Urban Water Management Plan Section Desalinated Water Opportunities The District has no sources of ocean water, brackish water, or groundwater that provide opportunities for development of desalinated water as a long-term supply. There are no opportunities for the development of desalinated water within the District s service area as a future supply source. However, one option that AVEK can consider when acquiring new water supplies is partnering with a SWP contractor situated in close proximity to the Pacific Ocean. Under such an arrangement, AVEK could use funds collected from the new water supply (developer fee) to contribute financially to the construction of a desalination facility and, in turn, the partnering agency would transfer a portion of its SWP water rights to AVEK. 5.6 Exchanges or Transfers The District receives purchased (i.e., imported) water supply from AVEK. Any transfer or exchange of water rights will likely be obtained via the SWP and will therefore have to be facilitated by AVEK. 5.7 Future Water Projects The District has water projects planned in the near future that will increase supplies and increase reliability of existing supplies to comply with drinking water standards. The District will also purchase additional SWP water to be banked by AVEK and extracted during future dry years. This is dependent on if there are extra SWP allocations for purchase. The District plans to equip existing wells with wellhead treatment. The District has received grant funding for the 60th Street West Wellhead Treatment and Avenue M and 5th Street East Wellsite Arsenic Treatment project. Construction at the Avenue M and 5th Street East Well site is projected to be completed in November The District plans to conduct additional studies to analyze and quantify the impacts of arsenic and chromium on groundwater supplies. Table 5-9 below provides a summary and schedule of the future water supply projects. Table 5-9. Retail: Expected Future Water Supply Projects or Programs (DWR Table 6-7) Name of Future Projects or Programs Purchase SWP water for banking Wellhead treatment No expected future water supply projects or programs that provide a quantifiable increase to the agency s water supply. Supplier will not complete the table below. Some or all of the supplier s future water supply projects or programs are not compatible with this table and are described in narrative format. LOCATION OF THE NARRATIVE Joint Project with Other Agencies? Yes, AVEK No Description Chromium treatment Planned Implementation Year Depends on extra SWP supplies Starting 2018 Planned for Use in Year Type Single-dry and multidry year All Expected Increase in Water Supply to Agency (ac-ft) 15,000 No net increase in supply, ensures no depletion by water quality issues 5-15 LAC WW- D40AV 2015 UWMP Final_02_07_2017.docx
44 Section Urban Water Management Plan 5.8 Summary of Existing and Planned Sources of Water A summary of actual supply sources and quantities in 2015 is provided in Table The water supplies projected from are provided in Table 5-11, below. The supply projected to be available from each source in normal years is shown. Water Supply Table Water Supplies Actual, ac-ft/yr (DWR Table 6-8) Additional Detail on Water Supply Actual Volume 2015 Water Quality Purchased water AVEK 20,361 Drinking water Groundwater Antelope Valley Groundwater Basin 18,049 Drinking water Recycled water Refill lake at Apollo Park 250 Recycled water Note: A normal year is assumed. Total 38,660 For groundwater projections, it is assumed that imported water return flow credits, defined in Section 5.2.1, are 39 percent of all the SWP water used by the District over the previous 5 years. Because the District has a right to 61,000 ac-ft/yr of SWP water from AVEK in a normal year, demand projections for groundwater assume that return flow credits may increase to 23,790 ac-ft/yr, allowing for a total groundwater right of 36,790 ac-ft/yr starting in For purposes of the water supply projections, it is assumed that this right will be applicable for all water year types. If not, groundwater banked in previous years will be used. Water Supply Table Water Supplies Projected, ac-ft/yr (DWR Table 6-9) Additional Detail on Water Supply Reasonably Available Volume Reasonably Available Volume Reasonably Available Volume Reasonably Available Volume Purchased or imported water 61,000 61,000 61,000 61,000 Groundwater a 36,790 36,790 36,790 36,790 Purchased or imported water New supply, developer fee 4,100 12,900 21,600 30,300 Recycled water 8,200 10,900 13,600 16,300 Total 110, , , ,390 Note: A normal year is assumed. a. The groundwater adjudication judgment provides safe yield rights of 13,000 ac-ft and 39% of return flows based on the District s share of SWP water supply (39% of 61,000 ac-ft or 23,790 ac-ft) for a total of 36,790 ac-ft LAC WW- D40AV 2015 UWMP Final_02_07_2017.docx
45 2015 Urban Water Management Plan Section Climate Change Impacts to Supply The IRWMP Update (AVRWMG 2013) has identified vulnerability issues to supplies that the Antelope Valley RWMG classified as high priority. Appendix H of the IRWMP update includes the DWR Climate Change Vulnerability Assessment Worksheet also located in the Guidebook (DWR 2016a). Vulnerability issues were identified for groundwater supply and SWP supply purchased through AVEK. Groundwater level declines are a longstanding issue in the Antelope Valley region. The region is limited in terms of the groundwater stored from year to year, and has issues with groundwater quality in some areas. Should a prolonged drought occur, this resource may not be available to buffer supply needs during future drought years. The region is heavily dependent upon imported water supplies, which are very susceptible to the impacts of climate change given their reliance on seasonal snowpack. Using historical data and modeling, DWR projects that by 2050 the Sierra snowpack will be reduced from its historical average by 25 to 40 percent (DWR 2013). DWR projects that reductions in snowpack could have dire consequences. Under climate change and in some years, water levels in Lake Oroville the SWP s main supply reservoir could fall below the lowest release outlets, making the system vulnerable to operational interruption. Climate change is also expected to reduce the SWP s median reservoir carryover storage. The supply is highly vulnerable at its source given the dependence upon the stability of the California Bay Delta levee system. Climate change impacts to this area from higher sea level rise and higher storm surges could be catastrophic to the supply. Sea level rise impacts the SWP water deliveries by increasing the risk of breach on the California Bay Delta levee system and requiring greater freshwater releases from Lake Oroville to keep saltwater intrusion from degrading California Bay Delta water quality. Invasive species are becoming more common in the region, and may increase with the projected changes to temperature and precipitation. Certain invasive species, such as Tamarisk and Arundo, may reduce the water supply available for native species. A number of water-dependent species present in the region require certain stream flows to maintain habitats, such as those species dependent on the Piute Ponds (outside of the service area). The projected changes to local temperature and precipitation may impact these environmental flows, and impact water-dependent species, particularly because these species have limited opportunity for migration. Biological opinions also require reservoir releases to maintain instream flow for fish species at particular months of the year, impacting SWP supplies in those months. Decreases in stream flows may reduce the ability of these streams to dilute water quality constituents. Should stream flows decrease because of increases in temperature and decreases in annual precipitation, the water quality of local streams may be impacted. In addition, the projected increase in wildfires in the surrounding mountains may lead to increased erosion and sedimentation in local streams LAC WW- D40AV 2015 UWMP Final_02_07_2017.docx
46 Section Urban Water Management Plan This page intentionally left blank LAC WW- D40AV 2015 UWMP Final_02_07_2017.docx
47 Section 6 Water Supply Reliability Assessment This section describes factors impacting long-term reliability of water supplies and provides a comparison of projected water supplies and demand projections in normal, single-dry, and multipledry years. 6.1 Constraints on Water Sources Water supply reliability is an important component of the water management planning process. Factors contributing to inconsistency in the District s water supplies include legal limitations because of water contracts limiting the quantity of water available to the District, environmental constraints, and reductions in availability because of climatic factors. The availability of SWP supply is known to be variable. It fluctuates from year to year depending on precipitation, regulatory restrictions, legislative restrictions, and operational conditions, and is particularly unreliable during dry years. The DWR SWP DCR anticipates a minimum delivery of 11 percent of full Table A amounts or allocations to each retail water provider (Table 6-4) (DWR 2015b). The Antelope Valley region likely cannot meet expected demands without imported water, and the variable nature of the supply presents management challenges to ensure flexibility. AVEK is developing projects for storage and banking of SWP water during wet years for use in dry years to increase reliability of purchased water supplies. Groundwater quantity is generally unaffected by short-term drought conditions. It is assumed that the District s available groundwater supply during all year types will be the same and based on the annual sustainable yield determined by the adjudication process. Water quality issues are not anticipated to have significant impact on water supply reliability. It is assumed that any chemical contamination from the known contaminant plumes and the lowering of maximum contaminant limits (MCLs) of naturally occurring constituents such as arsenic and chromium can be mitigated by constructing new treatment facilities for treatment prior to the water s delivery into the water distribution system. However, these treatment facilities have significant cost. 6.2 Reliability by Type of Year The basis of the water year data is provided in Table 6-1 for the AVEK supply. From the AVEK 2015 Draft UWMP, the base years and available supplies are estimated based on the SWP DCR (DWR 2015b). It is assumed that the District will receive 70 percent of the AVEK allocations. There are no water quality issues with the AVEK water supply. 6-1 LAC WW- D40AV 2015 UWMP Final_02_07_2017.docx
48 Section Urban Water Management Plan Year Type Table 6-1. Retail Basis of Water Year Data AVEK/SWP (DWR Table 7-1) Base Year Volume Available, ac-ft/yr Percentage of Average Supply Average year average 59, % Single-dry year ,800 8% Multiple-dry years 1st year ,000 20% Multiple-dry years 2nd year ,200 27% Multiple-dry years 3rd year ,500 41% Note: Base years and volumes are from the AVEK Draft 2015 UWMP. It is assumed that 70% of AVEK supply is allocated to the District. Numbers are rounded to the nearest 100. For the new supply for new development, it is assumed that reliability will be the same proportion that the AVEK supply will be reduced in single-dry years and multiple-dry years. Groundwater supplies are assumed to remain constant in all year types. It is assumed that the settlement pumping amount of groundwater share of 36,790 ac-ft is used for all year types. 6.3 Supply and Demand Assessment This section provides a comparison of normal, single-dry, and multiple-dry water year supply and demand for the District. Water demands are addressed in Section 3 and water supplies are addressed in Section 5. The normal water year current and projected water supplies are compared to the current and projected demand for the District in Table 6-2. Table 6-2. Retail: Normal Year Supply and Demand Comparison, ac-ft/yr (DWR Table 7-2) Supply a 110, , , ,390 AVEK 61,000 61,000 61,000 61,000 Groundwater 36,790 36,790 36,790 36,790 New supply 4,100 12,900 21,600 30,300 Recycled water 8,200 10,900 13,600 16,300 Demand b 96, , , ,820 Difference (supply minus demand) 13,600 13,580 13,590 13,570 a. Supply from Table b. Demand from Table LAC WW- D40AV 2015 UWMP Final_02_07_2017.docx
49 2015 Urban Water Management Plan Section 6 The current and projected water supplies are compared to the demands for a single-dry year for the District in Table 6-3, below. Table 6-3. Single Dry Year Water Supply and Demand Comparison, ac-ft/yr (DWR Table 7-3) Supply 96, , , ,820 AVEK 4,800 4,800 4,800 4,800 Groundwater 36,790 36,790 36,790 36,790 New supply a 320 1,015 1,700 2,385 Groundwater from banked supplies 46,380 54,505 62,510 70,545 Recycled water 8,200 10,900 13,600 16,300 Demand 96, , , ,820 Difference (supply minus demand) a. Because new supply funded by developers is from AVEK, single-dry year supply is taken as the ratio from AVEK purchased water. The projected water supplies are compared to the demands for multiple-dry years for the District in Table 6-4. First year Second year Table 6-4. Retail: Multiple-Dry Years Supply and Demand Comparison, ac-ft/yr (DWR Table 7-4) Supply 96, , , ,820 AVEK 12,000 12,000 12,000 12,000 Groundwater 36,790 36,790 36,790 36,790 New supply 820 2,580 4,320 6,060 Groundwater from banked supplies 38,680 45,740 52,690 59,670 Recycled water 8,200 10,900 13,600 16,300 Demand 96, , , ,820 Difference (supply minus demand) Supply 96, , , ,820 AVEK 16,200 16,200 16,200 16,200 Groundwater 36,790 36,790 36,790 36,790 New supply 1,100 3,500 5,800 8,200 Groundwater from banked supplies 34,200 40,620 47,010 53,330 Recycled water 8,200 10,900 13,600 16,300 Demand 96, , , ,820 Difference (supply minus demand) LAC WW- D40AV 2015 UWMP Final_02_07_2017.docx
50 Section Urban Water Management Plan Third year Table 6-4. Retail: Multiple-Dry Years Supply and Demand Comparison, ac-ft/yr (DWR Table 7-4) Supply 96, , , ,820 AVEK 24,500 24,500 24,500 24,500 Groundwater 36,790 36,790 36,790 36,790 New supply 1,700 5,300 8,900 12,400 Groundwater from banked supplies 25,300 30,520 35,610 40,830 Recycled water 8,200 10,900 13,600 16,300 Demand 96, , , ,820 Difference (supply minus demand) Regional Supply Reliability Water management tools are described and prioritized in the IRWMP Update (AVRWMG 2013). Programs to increase regional supply reliability are closely related to AVEK s efforts. Descriptions of AVEKS s programs are included below AVEK Westside Water Bank Interconnecting Pipeline and Pump Station The project includes construction of a pump station and completion of the South North Intertie Pipeline Turnout that would allow AVEK to use stored water in the Westside Water Bank for customers in the majority of AVEK s service area. The South North Intertie Pipeline Turnout is capable of moving water to and from the District at the rate of about 86 ac-ft/day or 28 mgd. The pipeline also provides flexibility in the method of return of water banked in the Westside Water Bank via direct delivery or transfer AVEK Enterprise Bank This project includes the development of a new groundwater recharge and recovery facility. Construction would include recharge basins and pipelines, groundwater recovery wells, a well collection system, and transmission and pumping facilities to deliver water from the bank to the aqueduct for delivery to the AVEK s banking partners AVEK Southern Antelope Valley Intertie Construction is planned for an interconnecting pipeline and pump station between AVEK s East Feeder and South Feeder systems that will allow AVEK to transfer water supplies from one end of the service area to the other in both directions. This allows AVEK the ability to use stored water from its water banks for delivery to customers within any region of their service area. 6-4 LAC WW- D40AV 2015 UWMP Final_02_07_2017.docx
51 Section 7 Water Shortage Contingency Planning This section describes the District s water shortage contingency planning process and how the District responds to water shortages. The District s Phased Water Conservation Plan (PWCP) is Part 5 of the Rules and Regulations of the Los Angeles County Waterworks Districts and the Marina del Rey (MdR) Water System. A copy is provided in Appendix I. It was adopted in May 1991 and most recently amended in June Stages of Action The District will implement an appropriate water shortage contingency stage based on the District s current water supply conditions, as listed for the 10 stages defined in Table 7-1. The Board of Directors of the Los Angeles County Waterworks Districts may determine the appropriate stage and implement rate changes and conservation surcharges. Regardless of the water supply availability or service conditions within the District, the Board of Directors may set water conservation goals and modify stage declarations as necessary to align with regional or State water conservation policies, agreements or declarations, or legal requirements. Stage Percent Supply Reduction (numerical value as a percentage) Phase I shortage 5 Table 7-1. Retail: Stages of Drought Contingency Plan (DWR Table 8-1) Water Supply Condition a (narrative description) District engineer determines over consumption of water, loss of pressure in a system, breakdown, drought conditions, or any similar occurrence Phase II shortage 10 Board of directors determines that the District will suffer a 10% shortage on supplies Phase III shortage 15 Board of directors determines that the District will suffer a 10% 15% shortage on supplies Phase IV shortage 20 Board of directors determines that the District will suffer a 15% 20% shortage on supplies Phase V shortage 25 Board of directors determines that the District will suffer a 20% 25% shortage on supplies Phase VI shortage 30 Board of directors determines that the District will suffer a 25% 30% shortage on supplies Phase VII shortage 35 Board of directors determines that the District will suffer a 30% 35% shortage on supplies Phase VIII shortage 40 Board of directors determines that the District will suffer a 35% 40% shortage on supplies Phase IX shortage 45 Board of directors determines that the District will suffer a 40% 45% shortage on supplies Phase X shortage 50 Board of directors determines that the District will suffer a 45% 55% shortage on supplies a. Water supply condition ranges are based on current normal year supplies. 7-1 LAC WW- D40AV 2015 UWMP Final_02_07_2017.docx
52 Section Urban Water Management Plan 7.2 Prohibitions on End Uses The District s Phased Water Conservation Plan (PWCP) and Water Waste Ordinance include mandatory prohibitions on water uses. DWR categorizes the types of restrictions and prohibitions as landscape irrigation, CII (Commercial, Industrial, Institutional), water features and swimming pools, and other. A summary of the District s restrictions and prohibitions is provided in Table 7-2. Stage a Normal Normal Normal Normal Restrictions and Prohibitions on End Users (from drop down list) Other: prohibit use of potable water for washing hard surfaces Landscape: limit landscape irrigation to specific times Landscape: other landscape restriction or prohibition Other: customers must repair leaks, breaks, and malfunctions in a timely manner Table 7-2. Restrictions and Prohibitions on End Uses (DWR Table 8-2) Additional Explanation Exception for benefit of public health and safety Prohibition from 10a.m. 5p.m. Prohibit lawn watering more than once a day, and irrigation causing runoff Required for renters and owners Penalty, Charge, or Other Enforcement? b Normal Other: require automatic-shutoff hoses For car washing Yes Normal CII: restaurants may serve water upon request, only Yes Normal Water features: restrict water use for decorative water features, such as fountains Other: prohibit use of potable water for construction and dust control Landscape: limit landscape irrigation to specific days Landscape: limit landscape irrigation to specific days CII: lodging establishment must offer opt out of linen service a. Items at the normal stage are included in the Water Waste Ordinance. Prohibit cleaning, filling, or maintaining levels New meters for construction water service to be removed, no new meters installed Irrigation to occur every other day Irrigation to occur 3 times per week in the summer, 2 times per week in the winter b. Enforcement is not by the District but by the County Department of Public Health or city of jurisdiction. Yes Yes Yes Yes Yes Yes Yes Yes Yes Water Waste Ordinance The Water Waste Ordinance is found in Chapter 11 of the Municipal Code for Los Angeles County, Part 4: Water Conservation Requirements for the Unincorporated Los Angeles County Area outlines hose water prohibitions, irrigation prohibitions, leak prohibitions, prohibitions for car wash facilities and public eateries, and decorative fountains (LACDPW 2015). It was last updated in June 2015 and includes water conservation measures determined by the State Landscape Irrigation Landscape irrigation prohibitions are enforced in all stages and become progressively restrictive in terms of allowable watering times, then days, then types of plants allowed. Runoff and water waste are always prohibited under the Water Waste Ordinance. 7-2 LAC WW- D40AV 2015 UWMP Final_02_07_2017.docx
53 2015 Urban Water Management Plan Section Commercial, Industrial, Institutional CII water use prohibitions are enforced by the Water Waste Ordinance. Eating establishments may serve drinking water only at customer request Water Features and Swimming Pools Use of water in ornamental fountains, ponds, lakes, or other similar aesthetic features shall be prohibited unless the water is recirculated. This is outlined in the Water Waste Ordinance Other At Phase I, existing meters for construction water service may be removed, and no new permanent meters may be installed. 7.3 Penalties, Charges, Other Enforcement The Water Waste Ordinance specifies a fine of $500 each day the violation occurs. The PWCP outlines the procedure to enforce any violation of the water conservation requirements. Enforcement of the requirements of each water conservation stage is conducted in a progressive manner and could lead to placement of a flow-restricting device where the violator refuses to stop activities constituting water waste. Up to a third violation may be issued. The Phased Water Conservation Plan sets a conservation surcharge for water use exceeding a percentage of the base monthly water use based on the phase of shortage determined. 7.4 Consumption-Reduction Methods Consumption-reduction methods are actions taken by the District to reduce water demand within the service area, whereas prohibitions addressed in Section 7.2 above limit specific uses of water. Table 7-3 below summarizes the District s consumption-reduction methods to reduce water demand in the service area. Table 7-3. Retail Only: Stages of WSCP - Consumption Reduction Methods (DWR Table 8-3) Phase Consumption Reduction Methods by Water Supplier Additional Explanation or Reference 1-10 Expand public information campaign Free school assembly program to 5th graders 1-10 Provide rebates on plumbing fixtures and devices Grant funding for rebate programs 1-10 Provide rebates for landscape irrigation efficiency 1-10 Provide rebates for turf replacement Cash for Grass 1-10 Implement or modify drought rate structure or surcharge 7-3 LAC WW- D40AV 2015 UWMP Final_02_07_2017.docx
54 Section Urban Water Management Plan Penalties imposed for the various stages are as described in the PWCP. The conservation target is a percentage of the quantity used during a base billing period set by the County Board of Supervisors. Water use up to the target quantities shall be billed at the established quantity charge or normal charge. Water use exceeding aforementioned target quantities shall be subject to the following conservation surcharges in addition to the established quantity charge or normal charge: For all customers within Los Angeles County Waterworks Districts, an additional conservation surcharge of 1 times the established quantity charge or normal charge will be assessed for water use exceeding the target quantity, up to 115 percent of the target quantity For all customers within Los Angeles County Waterworks Districts, an additional conservation surcharge of 2 times the established quantity charge or normal charge will be assessed for water use exceeding 115 percent of the target quantity 7.5 Determining Water Shortage Reductions To monitor the reduction in water use during a water shortage stage, supply and demand data are reported on a monthly basis with excess use violations reported to the Los Angeles County Waterworks Districts and to the customer. Bimonthly water meter readings are collected and compiled to determine if the water usage meets the target goal. 7.6 Revenue and Expenditure Impacts The implementation of the PWCP could potentially result in revenue losses ranging between 10 and 50 percent. Four sources of funding are available to the District to cover these losses: service charge, facility surcharge, water quantity charge, and standby charges. The service charge is a fixed connection charge based on the size of the meter. The facility surcharge and water quantity charge are based on the actual quantity of water used each month. Standby charges are assessed on all properties. Thus a reduction in water use will affect only the facility surcharge and water quantity charges. To reduce the impact of these losses, the District can use the following measures: use extra revenues contributed by the conservation surcharge, delay capital improvement projects, and increase water rates. The current PWCP includes a water quantity surcharge. In June 2015, the County Board of Supervisors lowered the conservation surcharges to be half for the first year that the PWCP was implemented. Monies collected as a result of the PWCP are deposited to the District s General Fund as reimbursement for the District s costs and expenses for administering the PWCP. 7.7 Resolution or Ordinance The Water Conservation Regulation is found in Part 5 of the Rules and Regulations of the Los Angeles County Waterworks Districts and the MdR Water System. It is located in Appendix H. 7.8 Catastrophic Supply Interruption Plan The District maintains an Emergency Response Plan (ERP) to address responding to catastrophic supply interruptions as well as other emergencies. The District also has standby power available in the form of portable diesel, natural gas, and propane generator units. This increases the reliability of supply. The ERP is not included in this document because of security reasons. The District uses an emergency organizational structure and chain of command in response to all emergencies within or affecting its service area. The ERP defines the emergency management positions. 7-4 LAC WW- D40AV 2015 UWMP Final_02_07_2017.docx
55 2015 Urban Water Management Plan Section 7 In February 2016, the Los Angeles County Waterworks Districts, through Verizon Wireless, implemented a feature to contact customers of critical notifications via text messaging and at a rate of 900 contacts per minute, which allows all District customers to be reached within 90 minutes Earthquakes or Other Natural Disaster The Antelope Valley is located in an earthquake zone. In the event of an earthquake or natural disaster, the Antelope Valley has the potential of losing its SWP supply. According to the California Division of Mines and Geology, a displacement along the San Andreas Fault could rupture the two aqueduct systems importing water to Southern California, resulting in a potential delay of 3 to 6 weeks in SWP water delivery. Additional delays may occur because of damage to pumping facilities. DWR estimates a 4-month delay if a major break should occur. If such a delay occurs, each water purveyor could maximize its groundwater production and use its emergency storage to meet water demands until the aqueduct is repaired. In the event of a prolonged absence of SWP water, the water purveyors could implement their established No Waste ordinances and PWCP stages to substantially reduce demands until SWP supply is restored SWP Emergency Outage Scenarios Following is a discussion of three possible scenarios for an outage of SWP water because of an earthquake, power outage, or other event. In past years, slippage of side panels, flood events, and subsidence repairs were handled by DWR without interruption in delivery. This is mainly due to a key design feature of the aqueduct that allows isolation of various sections. Thus, DWR can repair the damaged section without interrupting operation of another. However, three potential scenarios that would result in a loss of delivery to the service area are described below. They include a levee breach near the Sacramento-San Joaquin Delta, loss of the San Joaquin Valley transverse because of flood or earthquake, and loss of the East Branch because of an earthquake. The water purveyors ability to meet demands during the worst of these scenarios is also presented Levee Breach near Banks Pumping Plant The California Bay Delta plays an essential role in the SWP operation. Water from the delta is diverted to the SWP s main pumping facility, the Banks Pumping Plant located in the southern delta, into the California Aqueduct. If a major levee breach were to occur near this facility, the fresh water in the delta may become displaced with salt water rushing in from the San Francisco Bay. Pumping from the Delta would cease until the water quality was restored. Depending on the time of the breach, the necessary freshwater inflows required to restore the Delta may not be available. Historically, levee breaks such as the Jones Tract break may take several months to completely restore. Assuming that the Banks Pumping Plant was down for 6 months, DWR could use water stored in the San Luis Reservoir to continue delivery of some SWP water to Southern California. However, availability of supply will vary depending on the time of the breach. An occurrence in late summer or early fall would result in minimal delivery because of the typically low levels in San Luis Reservoir during this period. In addition to supply from San Luis Reservoir, the water purveyors could use storage from their facilities and maximize groundwater until the California Bay Delta is restored. The water purveyors could also use any water previously stored in groundwater banks Complete Disruption of the California Aqueduct in the San Joaquin Valley As demonstrated by the past flood event at Arroyo Pasajero, which resulted in the temporary loss of the Edmund G. Pat Brown portion of the California Aqueduct, the SWP facilities are vulnerable to flood. If a similar incident were to occur because of a flood or earthquake, loss of deliveries from the San Luis Reservoir could result. DWR anticipates an outage of up to 4 months should a loss in this 7-5 LAC WW- D40AV 2015 UWMP Final_02_07_2017.docx
56 Section Urban Water Management Plan portion of the California Aqueduct occur. If delivery were prevented from the San Luis Reservoir, the water purveyors could receive water through the Domestic-Agricultural Water Network (DAWN) Project facilities and maximize groundwater until the supply is restored. The bulk of the water imported by AVEK is treated and distributed to customers throughout its service area through DAWN Project facilities. Additionally, the water purveyors could use any water previously banked Complete Disruption of the East Branch of the California Aqueduct The East Branch of the California Aqueduct begins at a bifurcation of the aqueduct south of the Edmonston Pumping Plant. The East Branch conveys water through the Alamo Power Plant to the Pearblossom Pumping Plant, which pumps the water 540 feet uphill. The water is then conveyed in an open channel into the Mojave Siphon Power Plant and into Lake Silverwood. When needed, water is discharged to the Devil s Canyon Power Plant and its two afterbays. The Santa Ana Pipeline then conveys the water 28 miles underground to the California Aqueduct s terminus at Lake Perris. If a portion of the East Branch were damaged because of a major earthquake, deliveries to the water purveyors could be interrupted depending on the location of the break. It is assumed that a singlelocation break occurred north of the Pearblossom Pumping Plant and prevented delivery of water stored in the DAWN Project facilities. The water purveyors could maximize groundwater and use water stored in groundwater banks until SWP delivery resumed. Of the three scenarios, the disruption of the East Branch of the California Aqueduct would result in the worst-case scenario for the water purveyors of the Antelope Valley because it would prevent any delivery of SWP water. In this case, the water purveyors would rely on local groundwater and water stored in groundwater banks. Water supplies are assumed to be one half of the volume available in a single-dry year with the exception of recycled water. This would result in the District implementing Phase 8 of the PWCP Breach of the East Branch of the California Aqueduct in October 2015 In October 2015, flash flooding caused mud and debris flow to breach the East Branch of the California Aqueduct. This caused the SWP water to be isolated and inoperable for approximately 3 weeks until sediment-removal operations were complete and repairs could be made to the aqueduct itself. During the event, water treatment of imported supplies was interrupted at AVEK water treatment plant (WTP) facilities. Potable water demand at this time was near 30 mgd for District customers. This demand was completely met with existing local supplies. A portion of these local supplies consisted of groundwater from existing District wells. In addition to District wells, AVEK has water-banking operations that extract stored water from recharge fields known as the AVEK Water Bank (a.k.a., WSSP2). The bank uses previously stored SWP supplies. In the case that the breach occurred in a high-demand time such as summer, local water supplies and stored AVEK groundwater would not have been able to meet water demands during the 3-week outage. This event occurred during the mandated water conservation order issued by the governor and reflects Phase VII shortage conditions Power Outages In the event of a power outage, the water purveyors would follow their established ERPs. ERPs for a power outage include ensuring backup power supply for all water supply facilities to continue supplying water to customers, communicating with the power company, activating emergency connections with adjacent water systems, continuing water quality monitoring, and issuing boil water advisories as necessary. 7-6 LAC WW- D40AV 2015 UWMP Final_02_07_2017.docx
57 2015 Urban Water Management Plan Section Contamination Contamination of water supply can result from a number of different events including a reduction in water supply, water main break, cross-connection condition, water source pollution, or covert action. Water supplies for the service area are generally of good quality and no foreseeable permanent contamination issues are anticipated. In the event of a toxic spill or major contamination, the water purveyors would follow their ERPs to isolate the problem and reduce the impact to the water supply. Once the problem has been isolated, the contamination would be cleaned up using the outlined chlorination or other necessary procedures and the water supply returned to service as soon as possible. In the meantime, emergency storage or alternative supply would be used to meet demand. Implementation of additional DMMs could also be used if the outage is anticipated to be of longer consequence Year Minimum Water Supply An estimate of the minimum water supply for 2016, 2017, and 2018 is based on the combined availability of all water sources available during the District s historical multiple-dry year sequence and is reflected in Table 7-4. Table 7-4. Retail: Three-Year Minimum Water Supply, ac-ft/yr (DWR Table 8-4) Parameter Available water supply 58,800 58,800 60, LAC WW- D40AV 2015 UWMP Final_02_07_2017.docx
58 Section Urban Water Management Plan This page intentionally left blank. 7-8 LAC WW- D40AV 2015 UWMP Final_02_07_2017.docx
59 Section 8 Demand Management Measures The District conducts an ongoing water conservation program. The District is committed to implementing water conservation measures for all customer sectors. This section provides narrative descriptions addressing the nature and extent of each DMM implemented during the past 5 years, from , as well as the District s planned implementation of each conservation measure. The District is a signatory to the California Urban Water Conservation Council (CUWCC) MOU. The District is in full compliance with the CUWCC MOU and is on track with all best management practices (BMPs) implementation. The District s most recent conservation reports to CUWCC for implementation are provided in Appendix I. 8.1 Water Waste Prohibition The District s Rules and Regulations, Part 5, is the Phased WSCP. Under normal water supply conditions, a Water Waste Ordinance is in effect unless the Board of Directors modifies or adds to these restrictions. The Water Waste Ordinance is part of the Los Angeles County Water Conservation Ordinance U. The City of Lancaster s Water Waste Ordinance is part of its Municipal Code, Title 8, Chapter These documents are located in Appendix H. The District has set up an online form and phone number to report water waste. Enforcement of water waste is conducted in the manner of two site visits to the documented location and then a referral to the Department of Public Health or the cities of jurisdiction for enforcement. A flowrestricting device may be installed for customers repeatedly receiving notices of violation. Planned Implementation. The implementation of this DMM is ongoing. The District will continue to enforce this regulation. Method to Estimate Expected Water Savings. Water savings from this program cannot be directly quantified. Water waste complaints and violations are received and investigated by District staff and addressed via door hangers and/or a letter to the billing address as well as fines. 8.2 Metering The District is fully metered. The District has conducted a feasibility study to assess the merits of a program to provide incentives to switch mixed-use or commercial accounts to dedicated landscape meters. As discussed in Section 3 above, most of the accounts are residential uses. Planned Implementation. This DMM is on track. 8.3 Conservation Pricing The District currently implements conservation pricing for all its metered customers. An increasing block seasonal charge is charged for single-family residential customers. A uniform charge is used for all other customer types. Both commodity charges and fixed charges are used. This DMM is on track for 2015 given the use of BMP 1.4 Option 3 Matrix Score Calculator for CUWCC reporting. This method was adopted June 22, Planned Implementation. The implementation of this DMM is ongoing. The District plans to continue implementing its increasing block seasonal charge for all customer types. 8-1 LAC WW- D40AV 2015 UWMP Final_02_07_2017.docx
60 Section Urban Water Management Plan 8.4 Water Conservation Public Education and Outreach The current annual budget for the District s public information programs is $75,000. The District has contracted with O Rorke Inc. to intensify water conservation outreach efforts. The public information program includes print and Web-based publications, monthly bill inserts, and public outreach events. Television, radio, and newspaper contacts are routinely made to encourage water conservation. Details about the number and types of programs can be found in the CUWCC BMP coverage reports. In addition to local public education and outreach programs, the District also participates in a regional public education and outreach program through AVEK. Planned Implementation. The District s public information and school education program is an ongoing, annual program. The District will continue to provide water conservation materials as part of its community and school outreach programs, as well as continue to work cooperatively with AVEK to develop and distribute water conservation information. Methods to Estimate Expected Water Savings. The District has no method to quantify water conservation savings directly as a result of this DMM. 8.5 Water Conservation Program Coordination and Staffing Support The District has the equivalent of one full-time water conservation coordinator, who establishes an annual program budget based on available funding and resources. Program accomplishments are highlighted and corresponding goals are established for the upcoming year. The District also hires part-time staff as needed to aid in water conservation program implementation activities. The contact information for the water conservation coordinator is: Phone number: info@dpw.lacounty.gov Planned Implementation. The implementation of this DMM is ongoing. Methods to Estimate Expected Water Savings. Water savings from this DMM cannot be directly quantified. Effectiveness of this DMM will be evaluated by the success of the District s water conservation program. 8.6 Programs to Assess and Manage Distribution System Real Loss The District s progress to assess and manage the system s real losses consists of ongoing leak detection and repair within the system, focused on the high-probability leak areas. The District conducts water audits and leak detection and repair on an ongoing basis. The District conducted a water loss audit for 2015 as described in Section 3.2, provided in Appendix E. The District maintains records on all leaks repaired on its treated water system. The information is reviewed each year to determine which pipelines should be considered for replacement as part of the annual budgeted project list. Planned Implementation. The District is in compliance with this DMM. This DMM is currently being implemented and will continue to be implemented as part of the District s ongoing operations and maintenance program. Methods to Estimate Expected Water Savings. The total amount of water conserved over the 5-year period by implementing this DMM is directly related to the percentage of system water losses. 8-2 LAC WW- D40AV 2015 UWMP Final_02_07_2017.docx
61 2015 Urban Water Management Plan Section Other Demand Management Measures The District implements other residential and non-residential DMMs, as described in this section Water Audits for all Customers The District provides water audits, or surveys, for customers who request it and for customers who have received a notice of violation. As part of the audits, indoor and outdoor water efficiency checks will be made for fixtures and an efficient, custom irrigation watering schedule will be created Rebates The District has historically provided and plans to continue to provide a menu of rebate options based on available funding. Menu options include rebates for replacement of toilets, clothes washers, turf grass, irrigation controllers, weather-based irrigation controllers, and rain sensors. 8-3 LAC WW- D40AV 2015 UWMP Final_02_07_2017.docx
62 Section Urban Water Management Plan This page intentionally left blank. 8-4 LAC WW- D40AV 2015 UWMP Final_02_07_2017.docx
63 Section 9 References Antelope Valley East Kern Water Agency (AVEK) Urban Water Management Plan. Antelope Valley Regional Water Management Group (AVRWMG) Integrated Regional Water Management Plan AVRWMG Antelope Valley Integrated Regional Water Management Plan Update. City of Lancaster Planning Department City of Lancaster General Plan Housing Element (2014 to 2021). October. City of Palmdale Housing Element of the General Plan. Adopted by City Council on September 5, Department of Water Resources (DWR) California s Groundwater Bulletin-118, Antelope Valley Groundwater Basin. February. DWR Draft Delivery Reliability Report The State Water Project. December. State of California Department of Water Resources (DWR). 2015a. California Irrigation Management Information System. Website, accessed at: DWR. 2015b. State Water Project Final Delivery Capability Report July. DWR. 2016a Urban Water Management Plans Guidebook for Urban Water Suppliers. March. DWR. 2016b. Methodologies for Calculating Baseline and Compliance Urban Per Capita Water Use. February. Kennedy Jenks Final Facilities Planning Report, Antelope Valley Recycled Water Project. Kennedy Jenks Water System Master Plan. Los Angeles County Department of Public Works (LACDPW) Integrated Regional Urban Water Management Plan for the Antelope Valley. LACDPW Salt and Nutrient Management Plan for the Antelope Valley. Waterworks District 40, LACSDs, Antelope Valley Salt and Nutrient Management Planning Stakeholders Group. LACDPW Water Waste Ordinance. Accessed online at: U.S. Geological Survey (USGS) Aquifer-System Compaction: Analyses and Simulations- the Holly Site, Edwards Air Force Base, Antelope Valley, California. By Michelle Sneed and Devin L. Galloway. Water-Resources Investigations Report USGS Simulation of Groundwater Flow and Land Subsidence. 9-1 LAC WW- D40AV 2015 UWMP Final_02_07_2017.docx
64 Section Urban Water Management Plan This page intentionally left blank. 9-2 LAC WW- D40AV 2015 UWMP Final_02_07_2017.docx
65 2015 Urban Water Management Plan Appendix A: Documentation of City/County Notification A-1 LAC WW- D40AV 2015 UWMP Final_02_07_2017.docx
66
67 Kirk Allen From: Sent: To: Cc: Subject: Kirk Allen Thursday, April 28, :50 AM Matthew Knudson; 'Tom Barnes Chad Reed; Patricia Hachiya; Bensch, Erika Skutecki, Lisa Notice of Preparation of Los Angeles County Waterworks District No. 40, Antelope Valley's 2015 Urban Water Management Plan Tracking: Recipient Delivery Read Matthew Knudson 'Tom Barnes Chad Reed Patricia Hachiya Delivered: 4/28/ :50 AM Read: 4/28/ :05 AM Bensch, Erika Skutecki, Lisa Gordon Phair - City of Palmdale (GPhair@cityofpalmdale.org) Carolina Hernandez Tim Chen CHERNANDEZ@dpw.lacounty.gov Delivered: 4/28/ :50 AM Delivered: 4/28/ :50 AM To: City of Lancaster, Attn. Carlyle Workman To: City of Lancaster, Attn. Allen Thompson To: City of Palmdale, Attn. Mark Oyler To: Palmdale Water District, Attn. Matthew Knudson To: Antelope Valley-East Kern Water Agency, Attn. Tom Barnes To: Quartz Hill Water District, Attn. Chad Reed To: Regional Planning Impact Analysis Section, Attn. Patricia Hachiya To: Los Angeles County San. District Nos. 14 & 20, Attn. Ann Heil To: Los Angeles County San. District Nos. 14 & 20, Attn. Erika Bensch Notice of Preparation of Los Angeles County Waterworks District No. 40, Antelope Valley s 2015 Urban Water Management Plan 1
68 Los Angeles County Waterworks District No. 40, Antelope Valley is in the process of preparing the 2015 Urban Water Management Plan (UWMP) update. UWMPs are prepared by California urban water suppliers to support their long-term resource planning and ensure adequate water supplies are available to meet existing and future water demands. Every urban water supplier that either provides over 3,000 acre-feet of water annually or serves 3,000 or more connections is required to prepare an UWMP every five years. As an urban water supplier, the Waterworks District is required, pursuant to Section 10620(d)(2) of the UWMP Act, to coordinate with water management agencies, relevant public agencies and other water suppliers on the preparation of the UWMPs. The Waterworks Districts invites you to submit comments in anticipation of the development of the 2015 UWMP. We anticipate that the draft UWMP will be available for review in late May. Copies of the plan will be made available in all Public Libraries in the District s service areas and on the District website prior to the public hearing which is tentatively scheduled for Tuesday, June 28, 2016 at 9:30 A.M. at the Kenneth Hahn Hall of Administration, 500 West Temple Street, Los Angeles California Subsequent to the Public Hearing, the Board of Supervisors will consider adoption of the UWMP. If you have questions regarding this notification or about the Waterworks District s 2015 UWMP, please contact Kirk Allen, Associate Civil Engineer, at (626) or via kallen@dpw.lacounty.gov Thank you for your assistance in this process. Regards, Kirk Allen, P.E. County of Los Angeles - Department of Public Works Waterworks Division - Water Resources Unit 1000 South Fremont Avenue Suite A-9 East, 4 th Floor Alhambra, CA (t) (f) kallen@dpw.lacounty.gov 2
69 May Huang From: Kirk Allen Sent: Monday, November 21, :07 PM To: 'Matthew Knudson'; 'Tom Barnes 'Chad Reed'; Patricia Hachiya; 'Bensch, Erika'; Cc: Lisa Skutecki; Nikolaus Reppuhn; May Huang Subject: RE: Notice of Preparation of Los Angeles County Waterworks District No. 40, Antelope Valley's 2015 Urban Water Management Plan Good afternoon, all The Public Hearing regarding the 2015 UWMP has been rescheduled for January 24, 2017 at 9:30 a.m., at the Kenneth Hahn Hall of Administration, 500 West Temple Street, Los Angeles, California, This will serve as an updated 60 day notice of Public Hearing to the Cities and County. Subsequent to the Public Hearing, the Board of Supervisors will consider adoption of the 2015 UWMP. Should you have any questions or comments please contact Nikolaus Reppuhn, Associate Civil Engineer, at or via Thank you, Kirk Allen, P.E. County of Los Angeles Department of Public Works Waterworks Division Water Resources Unit 1000 South Fremont Avenue Suite A 9 East, 4 th Floor Alhambra, CA (t) (f) kallen@dpw.lacounty.gov From: Kirk Allen Sent: Thursday, August 25, :26 PM To: 'cworkman@cityoflancasterca.org'; 'athompson@cityoflancasterca.org'; 'moyler@cityofpalmdale.org'; 'Matthew Knudson'; 'Tom Barnes (tbarnes@avek.org)'; 'Chad Reed'; Patricia Hachiya; 'AHeil@lacsd.org'; 'Bensch, Erika'; 'mmischel@cityofpalmdale.org' Cc: 'Skutecki, Lisa'; Nikolaus Reppuhn; May Huang Subject: RE: Notice of Preparation of Los Angeles County Waterworks District No. 40, Antelope Valley's 2015 Urban Water Management Plan Good afternoon, all The pubic draft for the 2015 Urban Water Management Plan for Los Angeles County Waterworks District No. 40, Antelope Valley, is now available for public review. The Public 1
70 Hearing has been set for October 25, 2016 at 9:30 a.m., at the Kenneth Hahn Hall of Administration, 500 West Temple Street, Los Angeles, California, The public draft plan is available on the District s website: Should you have any questions or comments please contact Nikolaus Reppuhn, Associate Civil Engineer, at or via NReppuhn@dpw.lacounty.gov Thank you, Kirk Allen, P.E. County of Los Angeles Department of Public Works Waterworks Division Water Resources Unit 1000 South Fremont Avenue Suite A 9 East, 4 th Floor Alhambra, CA (t) (f) kallen@dpw.lacounty.gov From: Kirk Allen Sent: Thursday, April 28, :50 AM To: 'cworkman@cityoflancasterca.org'; 'athompson@cityoflancasterca.org'; 'moyler@cityofpalmdale.org'; Matthew Knudson; 'Tom Barnes (tbarnes@avek.org)'; Chad Reed; Patricia Hachiya; 'AHeil@lacsd.org'; Bensch, Erika Cc: Skutecki, Lisa Subject: Notice of Preparation of Los Angeles County Waterworks District No. 40, Antelope Valley's 2015 Urban Water Management Plan To: City of Lancaster, Attn. Carlyle Workman To: City of Lancaster, Attn. Allen Thompson To: City of Palmdale, Attn. Mark Oyler To: Palmdale Water District, Attn. Matthew Knudson To: Antelope Valley East Kern Water Agency, Attn. Tom Barnes To: Quartz Hill Water District, Attn. Chad Reed To: Regional Planning Impact Analysis Section, Attn. Patricia Hachiya To: Los Angeles County San. District Nos. 14 & 20, Attn. Ann Heil To: Los Angeles County San. District Nos. 14 & 20, Attn. Erika Bensch Notice of Preparation of Los Angeles County Waterworks District No. 40, Antelope Valley s 2015 Urban Water Management Plan 2
71 Los Angeles County Waterworks District No. 40, Antelope Valley is in the process of preparing the 2015 Urban Water Management Plan (UWMP) update. UWMPs are prepared by California urban water suppliers to support their long term resource planning and ensure adequate water supplies are available to meet existing and future water demands. Every urban water supplier that either provides over 3,000 acre feet of water annually or serves 3,000 or more connections is required to prepare an UWMP every five years. As an urban water supplier, the Waterworks District is required, pursuant to Section 10620(d)(2) of the UWMP Act, to coordinate with water management agencies, relevant public agencies and other water suppliers on the preparation of the UWMPs. The Waterworks Districts invites you to submit comments in anticipation of the development of the 2015 UWMP. We anticipate that the draft UWMP will be available for review in late May. Copies of the plan will be made available in all Public Libraries in the District s service areas and on the District website prior to the public hearing which is tentatively scheduled for Tuesday, June 28, 2016 at 9:30 A.M. at the Kenneth Hahn Hall of Administration, 500 West Temple Street, Los Angeles California Subsequent to the Public Hearing, the Board of Supervisors will consider adoption of the UWMP. If you have questions regarding this notification or about the Waterworks District s 2015 UWMP, please contact Kirk Allen, Associate Civil Engineer, at (626) or via kallen@dpw.lacounty.gov Thank you for your assistance in this process. Regards, Kirk Allen, P.E. County of Los Angeles Department of Public Works Waterworks Division Water Resources Unit 1000 South Fremont Avenue Suite A 9 East, 4 th Floor Alhambra, CA (t) (f) kallen@dpw.lacounty.gov 3
72 This page intentionally left blank.
73 2015 Urban Water Management Plan Appendix B: Notice of Public Hearing B-1 LAC WW- D40AV 2015 UWMP Final_02_07_2017.docx
74
75 AFFIDAVIT OF PUBLICATION ( C.C.P.) STATE OF CALIFORNIA \ County of Los Angeles -* NOTICE OF PUBLIC HEARING CN SS I am a citizen of the United States and a resident of the County aforesaid; I am over the age of eighteen years, and not a party to or interested in the above entitled matter. I am the principal clerk of the printer of the Antelope Valley Press, a newspaper of general circulation, printed and published daily in the City of Palmdale, County of Los Angeles, and which newspaper has been adjudged a newspaper of general circulation by the Superior Court of the County of Los Angeles, State of California, under date of October 24, 1931, Case Number ; Modified Case Number April 11, 1956; also operating as the Ledger-Gazette, adjudicated a legal newspaper June 15, 1927, by Superior Court decree No ; also operating as the Desert Mailer News, formerly known as the South Antelope Valley Foothill News, adjudicated a newspaper of general circulation by the Superior Court of the County of Los Angeles, State of California on May 29, 1967, Case Number NOC564 and adjudicated a newspaper of general circulation for the City of Lancaster, State of California on January 26, 1990, Case Number NOC10714, Modified October 22, 1990; that the notice, of which the annexed is a printed copy (set in type not smaller than nonpareil), has been published in each regular and entire issue of said newspaper and not in any supplement thereof on the following dates, to-wit: January 4,10, 2017 I certify (or declare) under penalty of perjury that the fore-going is true and correct. Signature The space above for filing stamp only j LOS ANGELES COUNTY WATERWORKS DISTRICT NO. 40, ANTELOPE VALLEY NOTICE OF PUBLIC HEARING FOR ADOPTION OF THE 2016 URBAN WATER MANAGEMENT PLAN The County of Los Angeles Board of Supervisors, as the governing body of the Los Angeles County Waterworks District No. 40, Antelope Valley, will hold a public hearing on January 24, 2017, at 9:30 a.m., in Room 381B, Kenneth Hahn Hall of Administration, 500 West Temple Street, Los Angeles, California 90012, in the matter of adopting the 2015 Urban Water Management Plan for the Los Angeles County Waterworks District No. 40, Antelope Valley. The Plan has been prepared in ' compliance with the Urban Water Management Planning Act and includes a water } shortage contingency plan, the projection of future water demands, identification of - sufficient water supplies to meet i projected water demands, and i an explanation of existing and future water conservation practices to meet the reduction : of 20 percent per capita use by the Year 2020 based on the Legislative Senate Bill X7-7. Copies of the Plan will be available for public review priori to the public hearing at the County libraries located in Lake :. Los Angeles, Lancaster,: Littlerock, and Quartz Hill, and at the Waterworks field office located at 260 East Avenue K-8 in Lancaster. The Plan will also be available for review at Publications/WMP.aspyJhp Board of Supervisors will consider and may approve the Plan as recommended by the Director of Public Works. For further information regarding this matter, please call (626) CN Jan 4,10, 2017 Dated: January 10,2017 Executed at Palmdale, California SIERRA HWY., PALMDALE CA Telephone (661) /Fax (661)
76 INSTRUCTION SHEET FOR PUBLISHING LEGAL ADVERTISEMENTS ENCLOSURE D TO: FROM: Executive Officer Board of Supervisors County of Los Angeles Department of Public Works Waterworks Division NOTICE OF HEARING 2015 URBAN WATER MANAGEMENT PLAN FOR THE LOS ANGELES COUNTY WATERWORKS DISTRICT NO. 40, ANTELOPE VALLEY Publishing That the Executive Officer of the Board of Supervisors shall cause notice of the public hearing, in the form and manner specified in Section 6066 of the Government Code, to be published once a week for two consecutive weeks in the Antelope Valley Press, a newspaper published and circulated in the County of Los Angeles, which is hereby designated for that purpose, such publication to be completed not less than 10 days prior to the date of said hearing. Copies of the Urban Water Management Plan will be available for review prior to the public hearing in all Public Libraries in District 40, Antelope Valley's service areas. The Urban Water Management Plan will also be available for review at Forward five reprints of the attached advertisement to the County of Los Angeles Department of Public Works, Waterworks Division, P.O. Box 1460, Alhambra, California ; City of Lancaster, North Fern Avenue, Lancaster, California ; and the City of Palmdale, North Sierra Highway, Palmdale, California Should there be any questions regarding this matter, please contact Mr. Adam Ariki, of this office, at (626) , Monday through Thursday, 7 a.m. to 5:45 p.m. Attach.
77 LOS ANGELES COUNTY WATERWORKS DISTRICT NO. 40, ANTELOPE VALLEY NOTICE OF PUBLIC HEARING FOR ADOPTION OF THE 2015 URBAN WATER MANAGEMENT PLAN The County of Los Angeles Board of Supervisors, as the governing body of the Los Angeles County Waterworks District No. 40, Antelope Valley, will hold a public hearing on January 24, 2017, at 9:30 a.m., in Room 381, Kenneth Hahn Hall of Administration, 500 West Temple Street, Los Angeles, California 90012, in the matter of adopting the 2015 Urban Water Management Plan for the Los Angeles County Waterworks District No. 40, Antelope Valley. The Plan has been prepared in compliance with the Urban Water Management Planning Act and includes a water shortage contingency plan, the projection of future water demands, identification of sufficient water supplies to meet projected water demands, and an explanation of existing and future water conservation practices to meet the reduction of 20 percent per capita use by the Year 2020 based on the Legislative Senate Bill X7-7. Copies of the Plan will be available for public review prior to the public hearing at the County libraries located in Lake Los Angeles, Lancaster, Littlerock, and Quartz Hill, and at the Waterworks field office located at 260 East Avenue K-8 in Lancaster. The Plan will also be available for review at The Board of Supervisors will consider and may approve the Plan as recommended by the Director of Public Works. For further information regarding this matter, please call (626) ATTACHMENT 1 - D
78 This page intentionally left blank.
79 2015 Urban Water Management Plan Appendix C: Adoption Resolution C-1 LAC WW- D40AV 2015 UWMP Final_02_07_2017.docx
80

81 STATEMENT OF PROCEEDINGS FOR THE REGULAR MEETING OF THE BOARD OF SUPERVISORS OF THE COUNTY OF LOS ANGELES HELD IN ROOM 381B OF THE KENNETH HAHN HALL OF ADMINISTRATION 500 WEST TEMPLE STREET, LOS ANGELES, CALIFORNIA Tuesday, January 24, :30 AM 1. Hearing on the 2015 Urban Water Management Plans; acting as the Governing Body of the Los Angeles County Waterworks District No. 29, Malibu, the Marina del Rey Water System (3 and 4), and the Los Angeles County Waterworks District No. 40, Antelope Valley (5) adopt the 2015 Urban Water Management Plans for District No. 29, Malibu and the Marina del Rey Water System District No. 40, Antelope Valley. (Department of Public Works) ( ) All persons wishing to testify were sworn in by the Executive Officer of the Board. Opportunity was given for interested persons to address the Board. Eric Preven addressed the Board. No correspondence was presented. On motion of Supervisor Hahn, seconded by Supervisor Solis, the Board, acting as the Governing Body of the Los Angeles County Waterworks District No. 29, Malibu, the Marina Del Rey Water System, and the Waterworks District No. 40, Antelope Valley, closed the public hearing and took the following actions: 1. Adopted the resolution approving the 2015 Urban Water Management Plan for the Los Angeles County Waterworks District No. 29, Malibu and the Marina del Rey Water System; and 2. Adopted the resolution approving the 2015 Urban Water Management Plan for the Waterworks District No. 40, Antelope Valley. Ayes: 5 - Supervisor Solis, Supervisor Kuehl, Supervisor Hahn, Supervisor Barger and Supervisor Ridley-Thomas Attachments: Board Letter Video Audio


82 Hearing Board of Supervisors Statement Of Proceedings January 24, 2017 The foregoing is a fair statement of the proceedings of the regular meeting, January 24, 2017, by the Board of Supervisors of the County of Los Angeles and ex officio the governing body of all other special assessment and taxing districts, agencies and authorities for which said Board so acts. Lori Glasgow, Executive Officer Executive Officer-Clerk of the Board of Supervisors By Lori Glasgow Executive Officer County of Los Angeles Page 2
83 2015 Urban Water Management Plan Appendix D: DWR UWMP Checklist D-1 LAC WW- D40AV 2015 UWMP Final_02_07_2017.docx
84
85 Appendix D Checklist Final Checklist Arranged by Water Code Section CWC Section (b) UWMP Requirement Subject Guidebook Location Retail suppliers shall adopt a 2020 water use target using one of four methods (e) Retail suppliers shall provide baseline daily per capita water use, urban water use target, interim urban water use target, and compliance daily per capita water use, along with the bases for determining those estimates, including references to supporting data Retail suppliers per capita daily water use reduction shall be no less than 5 percent of base daily per capita water use of the 5 year baseline. This does not apply if the suppliers base GPCD is at or below (a) (d)(2) (a) Retail suppliers shall meet their interim target by December 31, If the retail supplier adjusts its compliance GPCD using weather normalization, economic adjustment, or extraordinary events, it shall provide the basis for, and data supporting the adjustment. Retail suppliers shall conduct a public hearing to discuss adoption, implementation, and economic impact of water use targets Wholesale suppliers shall include an assessment of present and proposed future measures, programs, and policies to help their retail water suppliers achieve targeted water use reductions Retail suppliers shall report on their progress in meeting their water use targets. The data shall be reported using a standardized form (b) 10620(d)(2) Every person that becomes an urban water supplier shall adopt an urban water management plan within one year after it has become an urban water supplier. Coordinate the preparation of its plan with other appropriate agencies in the area, including other water suppliers that share a common source, water management agencies, and relevant public agencies, to D - 1 Baselines and Targets Baselines and Targets Baselines and Targets Baselines and Targets Baselines and Targets Plan Adoption, Submittal, and Implementation Baselines and Targets Baselines and Targets Section 5.7 and App E Chapter 5 and App E Section Section 5.8 and App E Section UWMP Location (Optional Column for Agency Use) Section and App F Section 4 and App F Section and App F Section and App F Not applicable Section 10.3 Section 1.4 Section 5.1 Section 5.8 and App E Not applicable Section and App F Plan Preparation Section 2.1 Section 1.1 Plan Preparation Section Section 1.3
86 Appendix D Checklist Final 10620(f) 10621(b) 10621(d) the extent practicable. Describe water management tools and options to maximize resources and minimize the need to import water from other regions. Notify, at least 60 days prior to the public hearing, any city or county within which the supplier provides water that the urban water supplier will be reviewing the plan and considering amendments or changes to the plan. Each urban water supplier shall update and submit its 2015 plan to the department by July 1, D - 2 Water Supply Reliability Assessment Plan Adoption, Submittal, and Implementation Plan Adoption, Submittal, and Implementation 10631(a) Describe the water supplier service area. System Description 10631(a) 10631(a) Describe the climate of the service area of the supplier. Indicate the current population of the service area (a) Provide population projections for 2020, 2025, 2030, and (a) 10631(b) 10631(b) 10631(b)(1) Describe other demographic factors affecting the supplier s water management planning. Identify and quantify the existing and planned sources of water available for 2015, 2020, 2025, 2030, and Indicate whether groundwater is an existing or planned source of water available to the supplier. Indicate whether a groundwater management plan has been adopted by the water supplier or if there is any other specific authorization for groundwater management. Include a copy of the plan or authorization. System Description System Description and Baselines and Targets System Description System Description Section 7.4 Section 6.4 Section Section 1.4 Sections and 10.4 Section 1.4 Section 3.1 Section 2.1 Section 3.3 Section 2.2 Sections 3.4 and 5.4 Section 2.3 Section 3.4 Section 2.3 Section 3.4 Section 2.3 System Supplies Chapter 6 Section 5 System Supplies Section 6.2 Section 5.2 System Supplies Section Section (b)(2) Describe the groundwater basin. System Supplies Section Section (b)(2) 10631(b)(2) Indicate if the basin has been adjudicated and include a copy of the court order or decree and a description of the amount of water the supplier has the legal right to pump. For unadjudicated basins, indicate whether or not the department has identified the basin as overdrafted, or projected to become overdrafted. Describe efforts by the supplier to eliminate the long-term overdraft condition. System Supplies Section Appendix G System Supplies Section Not applicable
87 Appendix D Checklist Final 10631(b)(3) 10631(b)(4) 10631(c)(1) 10631(c)(1) 10631(c)(2) 10631(d) 10631(e)(1) 10631(e)(3)(A) 10631(f)(1) 10631(f)(2) 10631(g) 10631(h) Provide a detailed description and analysis of the location, amount, and sufficiency of groundwater pumped by the urban water supplier for the past five years Provide a detailed description and analysis of the amount and location of groundwater that is projected to be pumped. Describe the reliability of the water supply and vulnerability to seasonal or climatic shortage. Provide data for an average water year, a single dry water year, and multiple dry water years For any water source that may not be available at a consistent level of use, describe plans to supplement or replace that source. Describe the opportunities for exchanges or transfers of water on a short-term or longterm basis. Quantify past, current, and projected water use, identifying the uses among water use sectors. Report the distribution system water loss for the most recent 12-month period available. Retail suppliers shall provide a description of the nature and extent of each demand management measure implemented over the past five years. The description will address specific measures listed in code. Wholesale suppliers shall describe specific demand management measures listed in code, their distribution system asset management program, and supplier assistance program. Describe the expected future water supply projects and programs that may be undertaken by the water supplier to address water supply reliability in average, single-dry, and multiple-dry years. Describe desalinated water project opportunities for long-term supply (i) CUWCC members may submit their CUWCC BMP annual reports in lieu of, or in addition to, describing the DMM implementation in their UWMPs. This option is only allowable if the supplier has been found to be in full compliance with the CUWCC MOU. System Supplies Section Section System Supplies Sections 6.2 and 6.9 Water Supply Reliability Assessment Water Supply Reliability Assessment Water Supply Reliability Assessment Sections 5.2 and 5.8 Section 7.1 Section 6.2 Section 7.2 Section 6.2 Section 7.1 Section 6.1 System Supplies Section 6.7 Section 5.6 System Water Use System Water Use Demand Management Measures Demand Management Measures Section 4.2 Section 3.1 Section 4.3 Section 3.2 Sections 9.2 and 9.3 Sections 9.1 and 9.3 Sections 8.1 to 8.7 Not applicable System Supplies Section 6.8 Sections 5.7 and 5.8 System Supplies Section 6.6 Section 5.5 Demand Management Measures Section 9.5 Section 8.1, Appendix I D - 3
88 Appendix D Checklist Final 10631(j) 10631(j) (a) 10632(a) and 10632(a)(1) 10632(a)(2) 10632(a)(3) 10632(a)(4) 10632(a)(5) 10632(a)(6) 10632(a)(7) 10632(a)(8) 10632(a)(9) Retail suppliers will include documentation that they have provided their wholesale supplier(s) if any - with water use projections from that source. Wholesale suppliers will include documentation that they have provided their urban water suppliers with identification and quantification of the existing and planned sources of water available from the wholesale to the urban supplier during various water year types. Include projected water use needed for lower income housing projected in the service area of the supplier. Provide an urban water shortage contingency analysis that specifies stages of action and an outline of specific water supply conditions at each stage. Provide an estimate of the minimum water supply available during each of the next three water years based on the driest threeyear historic sequence for the agency. Identify actions to be undertaken by the urban water supplier in case of a catastrophic interruption of water supplies. Identify mandatory prohibitions against specific water use practices during water shortages. Specify consumption reduction methods in the most restrictive stages. Indicated penalties or charges for excessive use, where applicable. Provide an analysis of the impacts of each of the actions and conditions in the water shortage contingency analysis on the revenues and expenditures of the urban water supplier, and proposed measures to overcome those impacts. Provide a draft water shortage contingency resolution or ordinance. Indicate a mechanism for determining actual reductions in water use pursuant to the water shortage contingency analysis For wastewater and recycled water, coordinate with local water, wastewater, groundwater, and planning agencies that operate within the supplier's service area. D - 4 System Supplies Section Table 5-10 and 5-11 System Supplies Section Not applicable System Water Use Water Shortage Contingency Planning Water Shortage Contingency Planning Water Shortage Contingency Planning Water Shortage Contingency Planning Water Shortage Contingency Planning Water Shortage Contingency Planning Water Shortage Contingency Planning Water Shortage Contingency Planning Water Shortage Contingency Planning System Supplies (Recycled Water) Section 4.5 Section 3.4 Section 8.1 Section 7.1 Section 8.9 Section 7.9 Section 8.8 Section 7.8 Section 8.2 Section 7.2 Section 8.4 Section 7.4 Section 8.3 Section 7.3 Section 8.6 Section 7.6 Section 8.7 Section 7.7, Appendix H Section 8.5 Section 7.5 Section Section 5.4.1
89 Appendix D Checklist Final 10633(a) 10633(b) 10633(c) 10633(d) 10633(e) 10633(f) 10633(g) Describe the wastewater collection and treatment systems in the supplier's service area. Include quantification of the amount of wastewater collected and treated and the methods of wastewater disposal. Describe the quantity of treated wastewater that meets recycled water standards, is being discharged, and is otherwise available for use in a recycled water project. Describe the recycled water currently being used in the supplier's service area. Describe and quantify the potential uses of recycled water and provide a determination of the technical and economic feasibility of those uses. Describe the projected use of recycled water within the supplier's service area at the end of 5, 10, 15, and 20 years, and a description of the actual use of recycled water in comparison to uses previously projected. Describe the actions which may be taken to encourage the use of recycled water and the projected results of these actions in terms of acre-feet of recycled water used per year. Provide a plan for optimizing the use of recycled water in the supplier's service area Provide information on the quality of existing sources of water available to the supplier and the manner in which water quality affects water management strategies and supply reliability 10635(a) 10635(b) Assess the water supply reliability during normal, dry, and multiple dry water years by comparing the total water supply sources available to the water supplier with the total projected water use over the next 20 years. Provide supporting documentation that Urban Water Management Plan has been, or will be, provided to any city or county within which it provides water, no later than 60 days after the submission of the plan to DWR Provide supporting documentation that the water supplier has encouraged active involvement of diverse social, cultural, and economic elements of the population within the service area prior to and during the preparation of the plan. System Supplies (Recycled Water) System Supplies (Recycled Water) System Supplies (Recycled Water) System Supplies (Recycled Water) System Supplies (Recycled Water) System Supplies (Recycled Water) System Supplies (Recycled Water) Water Supply Reliability Assessment Water Supply Reliability Assessment Plan Adoption, Submittal, and Implementation Section Section Section and Section Section Section Section Section Section and Table 5-5 Sections and Section Section Section Section Section 7.1 Section 6.1 Section 7.3 Section 6.3 Section Section 1.4 Plan Preparation Section Section 1.4 D - 5
90 Appendix D Checklist Final Provide supporting documentation that the urban water supplier made the plan available for public inspection, published notice of the public hearing, and held a public hearing about the plan. Plan Adoption, Submittal, and Implementation Sections , 10.3, and 10.5 Section The water supplier is to provide the time and place of the hearing to any city or county within which the supplier provides water Provide supporting documentation that the plan has been adopted as prepared or modified (a) Provide supporting documentation that the urban water supplier has submitted this UWMP to the California State Library (a)(1) 10644(a)(2) Provide supporting documentation that the urban water supplier has submitted this UWMP to any city or county within which the supplier provides water no later than 30 days after adoption. The plan, or amendments to the plan, submitted to the department shall be submitted electronically Provide supporting documentation that, not later than 30 days after filing a copy of its plan with the department, the supplier has or will make the plan available for public review during normal business hours. Plan Adoption, Submittal, and Implementation Plan Adoption, Submittal, and Implementation Plan Adoption, Submittal, and Implementation Plan Adoption, Submittal, and Implementation Plan Adoption, Submittal, and Implementation Plan Adoption, Submittal, and Implementation Sections Section 1.4 Section Section 1.4, Appendix C Section Section 1.4, Appendix C Section Section 1.4 Sections and Section 1.4 Section 10.5 Section 1.4 D - 6
91 2015 Urban Water Management Plan Appendix E: Distribution System Water Loss Audit E-1 LAC WW- D40AV 2015 UWMP Final_02_07_2017.docx
92
93 AWWA WLCC Free Water Audit Software: Reporting Worksheet Copyright 2010, American Water Works Association. All Rights Reserved. WAS v4.1 Back to Instructions? Click to access definition Water Audit Report for: Los Angeles County Waterworks District No. 40 Reporting Year: / /2015 Please enter data in the white cells below. Where available, metered values should be used; if metered values are unavailable please estimate a value. Indicate your confidence in the accuracy of the All volumes to be entered as: ACRE-FEET PER YEAR WATER SUPPLIED << Enter grading in column 'E' Volume from own sources:? 9 18, acre-ft/yr Master meter error adjustment (enter positive value):? acre-ft/yr Water imported:? 9 20, acre-ft/yr Water exported:? n/a acre-ft/yr WATER SUPPLIED: 38, acre-ft/yr. AUTHORIZED CONSUMPTION Click here:? Billed metered:? 10 35, acre-ft/yr for help using option Billed unmetered:? acre-ft/yr buttons below Unbilled metered:? acre-ft/yr Pcnt: Value: Unbilled unmetered:? acre-ft/yr 1.25% AUTHORIZED CONSUMPTION:? 35, acre-ft/yr WATER LOSSES (Water Supplied - Authorized Consumption) 2, acre-ft/yr Apparent Losses Pcnt: Value: Unauthorized consumption:? acre-ft/yr 0.25% Default option selected for unauthorized consumption - a grading of 5 is applied but not displayed Customer metering inaccuracies:? 6 2, acre-ft/yr Systematic data handling errors:? 5 acre-ft/yr Systematic data handling errors are likely, please enter a non-zero value; otherwise grade = 5 Apparent Losses:? 2, Real Losses (Current Annual Real Losses or CARL) Real Losses = Water Losses - Apparent Losses:? acre-ft/yr WATER LOSSES: 2, acre-ft/yr Use buttons to select percentage of water supplied OR value 2, Choose this option to enter a percentage of billed metered consumption. This is NOT a default value NON-REVENUE WATER NON-REVENUE WATER:? 2, acre-ft/yr = Total Water Loss + Unbilled Metered + Unbilled Unmetered SYSTEM DATA Length of mains:? 9 1,050.7 miles Number of active AND inactive service connections:? 10 56,817 Connection density: 54 conn./mile main Average length of customer service line:? ft (pipe length between curbstop and customer meter or property boundary) Average operating pressure:? psi? COST DATA Total annual cost of operating water system:? 9 $43,369,283 $/Year Customer retail unit cost (applied to Apparent Losses):? 10 $2.00 $/100 cubic feet (ccf) Variable production cost (applied to Real Losses):? 5 $ $/acre-ft/yr PERFORMANCE INDICATORS Financial Indicators Non-revenue water as percent by volume of Water Supplied: 6.4% Non-revenue water as percent by cost of operating system: 4.5% Annual cost of Apparent Losses: $1,834,194 Annual cost of Real Losses: $89,362 Operational Efficiency Indicators Apparent Losses per service connection per day: gallons/connection/day Real Losses per service connection per day*: 5.01 gallons/connection/day Real Losses per length of main per day*: N/A Real Losses per service connection per day per psi pressure: 0.06 gallons/connection/day/psi? Unavoidable Annual Real Losses (UARL): million gallons/year From Above, Real Losses = Current Annual Real Losses (CARL):? Infrastructure Leakage Index (ILI) [CARL/UARL]: * only the most applicable of these two indicators will be calculated million gallons/year 0.24 WATER AUDIT DATA VALIDITY SCORE: *** YOUR SCORE IS: 80 out of 100 *** A weighted scale for the components of consumption and water loss is included in the calculation of the Water Audit Data Validity Score PRIORITY AREAS FOR ATTENTION: Based on the information provided, audit accuracy can be improved by addressing the following components: 1: Variable production cost (applied to Real Losses) 2: Customer metering inaccuracies For more information, click here to see the Grading Matrix worksheet 3: Water imported AWWA Water Loss Control Committee Reporting Worksheet 1
94 AWWA WLCC Free Water Audit Software: Water Balance Copyright 2010, American Water Works Association. All Rights Reserved. WAS v4.1 Los Water Angeles Audit County Report Waterworks For: Report Yr: District No Own Sources (Adjusted for known errors) Water Exported Billed Authorized Consumption Billed Metered Consumption (inc. water exported) Revenue Water 35, Authorized Consumption 35, Billed Unmetered Consumption 35, , Unbilled Metered Consumption Unbilled Authorized Consumption , Unbilled Unmetered Consumption Water Supplied Unauthorized Consumption 2, Apparent Losses , , Customer Metering Inaccuracies 2, Systematic Data Handling Errors Water Losses Leakage on Transmission and/or Water Imported 2, Distribution Mains Real Losses 20, Billed Water Exported Not broken down Leakage and Overflows at Utility's Storage Tanks Not broken down Leakage on Service Connections Not broken down Non-Revenue Water (NRW) AWWA Water Loss Control Committee Water Balance 2
95 AWWA WLCC Free Water Audit Software: Grading Matrix Copyright 2010, American Water Works Association. All Rights Reserved. WASv 4.1 Back to Instructions In the Reporting Worksheet, grades were assigned to each component of the audit to describe the confidence and accuracy of the input data. The grading assigned to each audit component and the corresponding recommended improvements and actions are highlighted in yellow. Audit accuracy is likely to be improved by prioritizing those items shown in red Grading n/a Volume from own sources: Select this grading only if the water utility purchases/imports all of its water resources (i.e. has no sources of its own) Less than 25% of water production sources are metered, remaining sources are estimated. No regular meter accuracy testing. 25% - 50% of treated water production sources are metered; other sources estimated. No regular meter accuracy testing. Conditions between 2 and 4 50% - 75% of treated water production sources are metered, other sources estimated. Occasional meter accuracy testing Conditions between 4 and 6 At least 75% of treated water production sources are metered, or at least 90% of the source flow is derived from metered sources. Meter accuracy testing and/or electronic calibration conducted annually. Less than 25% of tested meters are found outside of +/- 6% accuracy. Conditions between 6 and 8 100% of treated water production sources are metered, meter accuracy testing and electronic calibration conducted annually, less than 10% of meters are found outside of +/- 6% accuracy Conditions between 8 and % of treated water production sources are metered, meter accuracy testing and electronic calibration conducted semiannually, with less than 10% found outside of +/- 3% accuracy. Improvements to attain higher data grading for "Volume from own Sources" component: to qualify for 2: Organize efforts to begin to collect data for determining volume from own sources to qualify for 4: Locate all water production sources on maps and in field, launch meter accuracy testing for existing meters, begin to install meters on unmetered water production sources and replace any obsolete/defective meters to qualify for 6: Formalize annual meter accuracy testing for all source meters. Complete installation of meters on unmetered water production sources and complete replacement of all obsolete/defective meters. to qualify for 8: Conduct annual meter accuracy testing on all meters. Complete project to install new, or replace defective existing, meters so that entire production meter population is metered. Repair or replace meters outside of +/- 6% accuracy. to qualify for 10: Maintain annual meter accuracy testing for all meters. Repair or replace meters outside of +/- 6% accuracy. Investigate new meter technology; pilot one or more replacements with innovative meters in attempt to improve meter accuracy. to maintain 10: Standardize meter accuracy test frequency to semi-annual, or more frequent, for all meters. Repair or replace meters outside of +/- 3% accuracy. Continually investigate/pilot improving metering technology. Master meter error adjustment: Select n/a only if the water utility fails to have meters on its sources of supply, either its own source, and/or imported (purchased) water sources Inventory information on meters and paper records of measured volumes in crude condition; data error cannot be determined No automatic datalogging of production volumes; daily readings are scribed on paper records. Tank/storage elevation changes are not employed in calculating "Volume from own sources" component. Data is adjusted only when grossly evident data error occurs. Conditions between 2 and 4 Production meter data is logged automatically in electronic format and reviewed at least on a monthly basis. "Volume from own sources" tabulations include estimate of daily changes in tanks/storage facilities. Meter data is adjusted when gross data errors occur, or occasional meter testing deems this necessary. Conditions between 4 and 6 Hourly production meter data logged automatically & reviewed on at least a weekly basis. Data adjusted to correct gross error from equipment malfunction and error confirmed by meter accuracy testing. Tank/storage facility elevation changes are automatically used in calculating a balanced "Volume from own sources" component. Conditions between 6 and 8 Continuous production meter data logged automatically & reviewed daily. Data adjusted to correct gross error from equipment malfunction & results of meter accuracy testing. Tank/storage facility elevation changes are automatically used in "Volume from own sources" tabulations. Conditions between 8 and 10 Computerized system (SCADA or similar) automatically balances flows from all sources and storages; results reviewed daily. Mass balance technique compares production meter data to raw (untreated) water and treatment volumes to detect anomalies. Regular calibrations between SCADA and sources meters ensures minimal data transfer error. Improvements to attain higher data grading for "Master meter error adjustment" component: to qualify for 2: Develop plan to restructure recordkeeping system to capture all flow data; set procedure to review data daily to detect input errors to qualify for 4: Install automatic datalogging equipment on production meters. Identify tanks/storage facilities and include estimated daily volume of water added to, or subtracted from, "Water Supplied" volume based upon changes in storage to qualify for 6: Review hourly production meter data for gross error on, at least, a weekly basis. Begin to install instrumentation on tanks/storage facilities to record elevation changes. Use daily net storage change to balance flows in calculating "Water Supplied" volume. to qualify for 8: Complete installation of elevation instrumentation on all tanks/storage facilities. Continue to use daily net storage change in calculating balanced "Volume from own sources" component. Adjust production meter data for gross error and inaccuracy confirmed by testing. to qualify for 10: Link all production and tank/storage facility elevation change data to a Supervisory Control & Data Acquisition (SCADA) System, or similar computerized monitoring/control system, and establish automatic flow balancing algorithm and regularly calibrate between SCADA and source meters. to maintain 10: Monitor meter innovations for development of more accurate and less expensive flowmeters. Continue to replace or repair meters as they perform outside of desired accuracy limits. Water Imported: Select n/a if the water utility's supply is exclusively from its own water resources (no bulk purchased/ imported water) Less than 25% of imported water sources are metered, remaining sources are estimated. No regular meter accuracy testing. 25% - 50% of imported water sources are metered; other sources estimated. No regular meter accuracy testing. Conditions between 2 and 4 50% - 75% of imported water sources are metered, other sources estimated. Occasional meter accuracy testing Conditions between 4 and 6 At least 75% of imported water sources are metered, meter accuracy testing and/or electronic calibration conducted annually. Less than 25% of tested meters are found outside of +/- 6% accuracy. Conditions between 6 and 8 100% of imported water sources are metered, meter accuracy testing and/or electronic calibration conducted annually, less than 10% of meters are found outside of +/- 6% accuracy Conditions between 8 and % of imported water sources are metered, meter accuracy testing and/or electronic calibration conducted semiannually, with less than 10% found outside of +/- 3% accuracy. Improvements to attain higher data grading for "Water Imported Volume" component: to qualify for 2: Review bulk water purchase agreements with partner suppliers; confirm requirements for use and maintenance of accurate metering. Identify needs for new or replacement meters with goal to meter all imported water sources. To qualify for 4: Locate all imported water sources on maps and in field, launch meter accuracy testing for existing meters, begin to install meters on unmetered imported water interconnections and replace obsolete/defective meters to qualify for 6: Formalize annual meter accuracy testing for all imported water meters. Continue installation of meters on unmetered exported water interconnections and replacement of obsolete/defective meters. to qualify for 8: Complete project to install new, or replace defective, meters on all imported water interconnections. Maintain annual meter accuracy testing for all imported water meters. Repair or replace meters outside of +/- 6% accuracy. to qualify for 10: Maintain annual meter accuracy testing for all meters. Repair or replace meters outside of +/- 6% accuracy. Investigate new meter technology; pilot one or more replacements with innovative meters in attempt to improve meter accuracy. to maintain 10: Standardize meter accuracy test frequency to semi-annual, or more frequent, for all meters. Repair or replace meters outside of +/- 3% accuracy. Continually investigate/pilot improving metering technology. AWWA Water Loss Control Committee Grading Matrix 3
96 Grading n/a Water Exported: Select n/a if the water utility sells no bulk water to neighboring water utilities (no exported water sales) Less than 25% of exported water sources are metered, remaining sources are estimated. No regular meter accuracy testing. 25% - 50% of exported water sources are metered; other sources estimated. No regular meter accuracy testing. Conditions between 2 and 4 50% - 75% of exported water sources are metered, other sources estimated. Occasional meter accuracy testing Conditions between 4 and 6 At least 75% of exported water sources are metered, meter accuracy testing and/or electronic calibration conducted annually. Less than 25% of tested meters are found outside of +/- 6% accuracy. Conditions between 6 and 8 100% of exported water sources are metered, meter accuracy testing and/or electronic calibration conducted annually, less than 10% of meters are found outside of +/- 6% accuracy Conditions between 8 and % of exported water sources are metered, meter accuracy testing and/or electronic calibration conducted semiannually, with less than 10% found outside of +/- 3% accuracy. Improvements to attain higher data grading for "Water Exported Volume" component: to qualify for 2: Review bulk water sales agreements with partner suppliers; confirm requirements for use & upkeep of accurate metering. Identify needs to install new, or replace defective meters as needed. To qualify for 4: Locate all exported water sources on maps and in field, launch meter accuracy testing for existing meters, begin to install meters on unmetered exported water interconnections and replace obsolete/defective meters to qualify for 6: Formalize annual meter accuracy testing for all exported water meters. Continue installation of meters on unmetered exported water interconnections and replacement of obsolete/defective meters. to qualify for 8: Complete project to install new, or replace defective, meters on all exported water interconnections. Maintain annual meter accuracy testing for all imported water meters. Repair or replace meters outside of +/- 6% accuracy. to qualify for 10: Maintain annual meter accuracy testing for all meters. Repair or replace meters outside of +/- 6% accuracy. Investigate new meter technology; pilot one or more replacements with innovative meters in attempt to improve meter accuracy. to maintain 10: Standardize meter accuracy test frequency to semi-annual, or more frequent, for all meters. Repair or replace meters outside of +/- 3% accuracy. Continually investigate/pilot improving metering technology. AUTHORIZED CONSUMPTION Billed metered: n/a (not applicable). Select n/a only if the entire customer population is not metered and is billed for water service on a flat or fixed rate basis. In such a case the volume entered must be zero. Less than 50% of customers with volume-based billings from meter readings; flat or fixed rate billed for the majority of the customer population At least 50% of customers with volume-based billing from meter reads; flat rate billed for others. Manual meter reading, under 50% read success rate, remainder estimated. Limited meter records, no regular meter testing or replacement. Billing data maintained on paper records, with no auditing. Conditions between 2 and 4 At least 75% of customers with volume-based billing from meter reads; flat or fixed rate billed for remainder. Manual meter reading used, at least 50% meter read success rate, failed reads are estimated. Purchase records verify age of customer meters; only very limited meter accuracy testing is conducted. Customer meters replaced only upon complete failure. Computerized billing records, but only periodic internal auditing conducted. Conditions between 4 and 6 At least 90% of customers with volume-based billing from meter reads; remaining accounts are estimated. Manual customer meter reading gives at least 80% customer meter reading success rate, failed reads are estimated. Good customer meter records, limited meter accuracy testing, regular replacement of oldest meters. Computerized billing records with routine auditing of global statistics. Conditions between 6 and 8 At least 97% of customers with volume-based billing from meter reads. At least 90% customer meter read success rate; or minimum 80% read success rate with planning and budgeting for trials of Automatic Metering Reading (AMR) in one or more pilot areas. Good customer meter records. Regular meter accuracy testing guides replacement of statistically significant number of meters each year. Routine auditing of computerized billing records for global and detailed statistics; verified periodically by third party. Conditions between 8 and 10 At least 99% of customers with volume-based billing from meter reads. At least 95% customer meter reading success rate; or minimum 80% meter reading success rate, with Automatic Meter Reading (AMR) trials underway. Statistically significant customer meter testing and replacement program in place. Computerized billing with routine, detailed auditing, including field investigation of representative sample of accounts. Annual audit verification by third party. Improvements to attain higher data grading for "Billed Metered Consumption" component: If n/a is selected because the customer meter population is unmetered, consider establishing a new policy to meter the customer population and employ water rates based upon metered volumes. to qualify for 2: Conduct investigations or trials of customer meters to select appropriate meter models. Budget funding for meter installations. Investigate volume based water rate structures. to qualify for 4: Purchase and install meters on unmetered accounts. Implement policies to improve meter reading success. Catalog meter information during meter read visits to identify age/model of existing meters. Test a minimal number of meters for accuracy. Install computerized billing system. to qualify for 6: Purchase and install meters on unmetered accounts. Eliminate flat fee billing and establish appropriate water rate structure based upon measured consumption. Continue to achieve verifiable success in removing manual meter reading barriers. Expand meter accuracy testing. Launch regular meter replacement program. Conduct routine audit of global statistics. to qualify for 8: Purchase and install meters on unmetered accounts. Assess cost-effectiveness of Automatic Meter Reading (AMR) system for portion or entire system; or achieve ongoing improvements in manual meter reading success rate. Refine meter accuracy testing program. Set meter replacement goals based upon accuracy test results. Refine routine auditing procedures based upon third party guidance. to qualify for 10: Purchase and install meters on unmetered accounts. Launch Automatic Meter Reading (AMR) system trials if manual meter reading success rate of at least 95% is not achieved within a five-year program. Continue meter accuracy testing program. Conduct planning and budgeting for large scale meter replacement based upon meter life cycle analysis using cumulative flow target. Continue routine auditing and require annual third party review. to maintain 10: Regular internal and third party auditing, and meter accuracy testing ensures that accurate customer meter readings are obtained and entered as the basis for volume based billing. Stay abreast of improvements in Advanced Metering Infrastructure (AMI) and information management. Plan and budget for justified upgrades in metering, meter reading and billing data management. Billed unmetered: Select n/a if it is the policy of the water utility to meter all customer connections and it has been confirmed by detailed auditing that all customers do indeed have a water meter; i.e. no unmetered accounts exist Water utility policy does not require customer metering; flat or fixed fee billed. No data collected on customer consumption. Only estimates available are derived from data estimation methods using average fixture count multiplied by number of connections, or similar approach. Water utility policy does not require customer metering; flat or fixed fee billed. Some metered accounts exist in parts of the system (pilot areas or District Metered Areas) with consumption recorded on portable dataloggers. Data from these sample meters are used to infer consumption for the total customer population. Site specific estimation methods are used for unusual buildings/water uses. Conditions between 2 and 4 Water utility policy does require metering and volume based billing but lacks written procedures and employs casual oversight, resulting in up to 20% of billed accounts believed to be unmetered. A rough estimate of the annual consumption for all unmetered accounts is included in the annual water audit, with no inspection of individual unmetered accounts. Conditions between 4 and 6 Water utility policy does require metering and volume based billing but exemption exist for a portion of accounts such as municipal buildings. As many as 15% of billed accounts are unmetered due to this exemption or meter installation difficulties. Only a group estimate of annual consumption for all unmetered accounts is included in the annual water audit, with no inspection of individual unmetered accounts. Conditions between 6 and 8 Water utility policy requires metering and volume based billing for all customer accounts. However, less than 5% of billed accounts remain unmetered because because installation is hindered by unusual circumstances. The goal is to minimize the number of unmetered accounts. Reliable estimates of consumption are obtained for unmetered accounts via site specific estimation methods. Conditions between 8 and 10 Water utility policy requires metering and volume based billing for all customer accounts. Less than 2% of billed accounts are unmetered and exist because meter installation is hindered by unusual circumstances. The goal exists to minimize the number of unmetered accounts to the extent that is economical. Reliable estimates of consumption are obtained at these accounts via site specific estimation methods. AWWA Water Loss Control Committee Grading Matrix 4
97 Grading n/a Improvements to attain higher data grading for "Billed Unmetered Consumption" component: to qualify for 2: Investigate a new water utility policy to require metering of the customer population, and a reduction of unmetered accounts. Conduct pilot metering project by installing water meters in small sample of customer accounts and datalogging the water consumption. to qualify for 4: Implement a new water utility policy requiring customer metering. Expand pilot metering study to include several different meter types, which will provide data for economic assessment of full scale metering options. Assess sites with access difficulties to devise means to obtain water consumption volumes. to qualify for 6: Budget for staff resources to review billing records to identify unmetered properties. Specify metering needs and funding requirements to install sufficient meters to significant reduce the number of unmetered accounts to qualify for 8: Install customer meters on a full scale basis. Refine metering policy and procedures to ensure that all accounts, including municipal properties, are designated for meters. Implement procedures to obtain reliable consumption estimate for unmetered accounts awaiting meter installation. to qualify for 10: Continue customer meter installation throughout the service area, with a goal to minimize unmetered accounts. Sustain the effort to investigate accounts with access difficulties to devise means to install water meters or otherwise measure water consumption. to maintain 10: Continue to refine estimation methods for unmetered consumption and explore means to establish metering, for as many billed unmetered accounts as is economically feasible. Unbilled metered: select n/a if all billing-exempt consumption is unmetered. Billing practices exempt certain accounts, such as municipal buildings, but written policies do not exist; and a reliable count of unbilled metered accounts is unavailable. Meter upkeep and meter reading on these accounts is rare and not considered a priority. Due to poor recordkeeping and lack of auditing, water consumption for all such accounts is purely guesstimated. Billing practices exempt certain accounts, such as municipal buildings, but only scattered, dated written directives exist to justify this practice. A reliable count of unbilled metered accounts is unavailable. Sporadic meter replacement and meter reading occurs on an as-needed basis. The total annual water consumption for all unbilled, metered accounts is estimated based upon approximating the number of accounts and assigning consumption from actively billed accounts of same meter size. Conditions between 2 and 4 Dated written procedures permit billing exemption for specific accounts, such as municipal properties, but are unclear regarding certain other types of accounts. Meter reading is given low priority and is sporadic. Consumption is quantified from meter readings where available. The total number of unbilled, unmetered accounts must be estimated along with consumption volumes. Conditions between 4 and 6 Written policies regarding billing exemptions exist but adherence in practice is questionable. Metering and meter reading for municipal buildings is reliable but sporadic for other unbilled metered accounts. Periodic auditing of such accounts is conducted. Water consumption is quantified directly from meter readings where available, but the majority of the consumption is estimated. Conditions between 6 and 8 Written policy identifies the types of accounts granted a billing exemption. Customer meter management and meter reading are considered secondary priorities, but meter reading is conducted at least annually to obtain consumption volumes for the annual water audit. High level auditing of billing records ensures that a reliable census of such accounts exists. Conditions between 8 and 10 Clearly written policy identifies the types of accounts given a billing exemption, with emphasis on keeping such accounts to a minimum. Customer meter management and meter reading for these accounts is given proper priority and is reliably conducted. Regular auditing confirms this. Total water consumption for these accounts is taken from reliable readings from accurate meters. Improvements to attain higher data grading for "Unbilled metered Consumption" component: to qualify for 2: Reassess the water utility's policy allowing certain accounts to be granted a billing exemption. Draft an outline of a new written policy for billing exemptions, with clear justification as to why any accounts should be exempt from billing, and with the intention to keep the number of such accounts to a minimum. to qualify for 4: Review historic written directives and policy documents allowing certain accounts to be billing-exempt. Draft an outline of a written policy for billing exemptions, identify criteria that grants an exemption, with a goal of keeping this number of accounts to a minimum. to qualify for 6: Draft a new written policy regarding billing exemptions based upon consensus criteria allowing this occurrence. Assign resources to audit meter records and billing records to obtain census of unbilled metered accounts. to qualify for 8: Communicate billing exemption policy throughout the organization and implement procedures that ensure proper account management. Conduct inspections of accounts confirmed in unbilled metered status and verify that accurate meters exist and are scheduled for routine meter readings. to qualify for 10: Ensure that meter management (meter accuracy testing, meter replacement) and meter reading activities are accorded the same priority as billed accounts. Establish ongoing annual auditing process to ensure that water consumption is reliably collected and provided to the annual water audit process. to maintain 10: Reassess philosophy in allowing any water uses to go "unbilled". It is possible to meter and bill all accounts, even if the fee charged for water consumption is discounted or waived. Metering and billing all accounts ensures that water consumption is tracked and water waste from plumbing leaks is detected and minimized. Unbilled unmetered: Extent of unbilled, unmetered consumption is unknown due to unclear policies and poor recordkeeping. Total consumption is quantified based upon a purely subjective estimate. Clear extent of unbilled, unmetered consumption is unknown, but a number of events are randomly documented each year, confirming existence of such consumption, but without sufficient documentation to quantify an accurate estimate of the annual volume consumed. Conditions between 2 and 4 Extent of unbilled, unmetered consumption is partially known, and procedures exist to document certain events such as miscellaneous fire hydrant uses. Formulae is used to quantify the consumption from such events (time running x typical flowrate x number of events). Default value of 1.25% of system input volume is employed Coherent policies exist for some forms of unbilled, unmetered consumption but others await closer evaluation. Reasonable recordkeeping for the managed uses exists and allows for annual volumes to be quantified by inference, but unsupervised uses are guesstimated. Conditions between 6 and 8 Clear policies and good recordkeeping exist for some uses (ex: unmetered fire connections registering consumption), but other uses (ex: miscellaneous uses of fire hydrants) have limited oversight. Total consumption is a mix of well quantified use such as from formulae (time x typical flow) or temporary meters, and relatively subjective estimates of less regulated use. Conditions between 8 and 10 Clear policies exist to identify permitted use of water in unbilled, unmetered fashion, with the intention of minimizing this type of consumption. Good records document each occurrence and consumption is quantified via formulae (time x typical flow) or use of temporary meters. Improvements to attain higher data grading for "Unbilled Unmetered Consumption" component: to qualify for 5: Utilize accepted default value of 1.25% of system input volume as an expedient means to gain a reasonable quantification of this use. to qualify for 2: Establish a policy regarding what water uses should be allowed as unbilled and unmetered. Consider tracking a small sample of one such use (ex: fire hydrant flushings). to qualify for 5: Utilize accepted default value of 1.25% of system input volume as an expedient means to gain a reasonable quantification of this use. to qualify for 4: Evaluate the documentation of events that have been observed. Meet with user groups (ex: for fire hydrants - fire departments, contractors to ascertain their need for water from fire hydrants). to qualify for 5: Utilize accepted default value of 1.25% of system input volume as expedient means to gain a reasonable quantification of all such use. This is particularly appropriate for water utilities who are in the early stages of the water auditing process. to qualify for 6 or greater: Finalize policy and do field checks. Proceed if top-down audit exists and/or a great volume of such use is suspected. to qualify for 8: Assess water utility policy and procedures to ensure that fire hydrant permits are issued for use by persons outside of the utility. Create written procedures for use and documentation of fire hydrants by water utility personnel. to qualify for 10: Refine written procedures to ensure that all uses of unbilled, unmetered water are overseen by a structured permitting process managed by water utility personnel. Reassess policy to determine if some of these uses have value in being converted to billed and/or metered status. to maintain 10: Continue to refine policy and procedures with intention of reducing the number of allowable uses of water in unbilled and unmetered fashion. Any uses that can feasibly become billed and metered should be converted eventually. APPARENT LOSSES AWWA Water Loss Control Committee Grading Matrix 5
98 Grading n/a Unauthorized consumption: Extent of unauthorized consumption is unknown due to unclear policies and poor recordkeeping. Total unauthorized consumption is guesstimated. Unauthorized consumption is a known occurrence, but its extent is a mystery. There are no requirements to document observed events, but periodic field reports capture some of these occurrences. Total unauthorized consumption is approximated from this limited data. conditions between 2 and 4 Procedures exist to document some unauthorized consumption such as observed unauthorized fire hydrant openings. Use formulae to quantify this consumption (time running x typical flowrate x number of events). Default value of 0.25% of system input volume is employed Coherent policies exist for some forms of unauthorized consumption but others await closer evaluation. Reasonable surveillance and recordkeeping exist for occurrences that fall under the policy. Volumes quantified by inference from these records. Unsupervised uses are guesstimated. Conditions between 6 and 8 Clear policies and good recordkeeping exist for certain events (ex: tampering with water meters); other occurrences have limited oversight. Total consumption is a combination of volumes from formulae (time x typical flow) and subjective estimates of unconfirmed consumption. Conditions between 8 and 10 Clear policies exist to identify all known unauthorized uses of water. Staff and procedures exist to provide enforcement of policies and detect violations. Each occurrence is quantified via formulae (time x typical flow) or similar methods. Improvements to attain higher data grading for "Unauthorized Consumption" component: to qualify for 5: Use accepted default of 0.25% of system input volume. to qualify for 2: Review utility policy regarding what water uses are considered unauthorized, and consider tracking a small sample of one such occurrence (ex: unauthorized fire hydrant openings) to qualify for 5: Use accepted default of 0.25% of system input volume to qualify for 4: Review utility policy regarding what water uses are considered unauthorized, and consider tracking a small sample of one such occurrence (ex: unauthorized fire hydrant openings) to qualify for 5: Utilize accepted default value of 0.25% of system input volume as expedient means to gain a reasonable quantification of all such use. This is particularly appropriate for water utilities who are in the early stages of the water auditing process. to qualify for 6 or greater: Finalize policy and do field checks. Proceed if top-down audit exists and/or a great volume of such use is suspected. to quality for 8: Assess water utility policies to ensure that all known occurrences of unauthorized consumption are outlawed, and that appropriate penalties are prescribed. Create written procedures for use and documentation of various occurrences of unauthorized consumption as they are uncovered. to qualify for 10: Refine written procedures and assign staff to seek out likely occurrences of unauthorized consumption. Explore new locking devices, monitors and other technologies designed to detect and thwart unauthorized consumption. to maintain 10: Continue to refine policy and procedures to eliminate any loopholes that allow or tacitly encourage unauthorized consumption. Continue to be vigilant in documentation and enforcement efforts. Customer metering inaccuracies: Improvements to attain higher data grading for "Customer meter inaccuracy volume" component: Systematic Data Handling Error: select n/a only if the entire customer population is unmetered. In such a case the volume entered must be zero. If n/a is selected because the customer meter population is unmetered, consider establishing a new policy to meter the customer population and employ water rates based upon metered volumes. Note: all water utilities incur some amount of this error. Even in water utilities with unmetered customer populations and fixed rate billing, errors occur in annual billing tabulations. Enter a positive value for the volume and select a grading. Customer meters exist, but with unorganized paper records on meters; no meter accuracy testing or meter replacement program. Workflow is driven chaotically by customer complaints with no proactive management. Loss volume due to aggregate meter inaccuracy is guesstimated. to qualify for 2: Gather available meter purchase records. Conduct testing on a small number of meters believed to be the most inaccurate. Review staffing needs of metering group and budget for necessary resources to better organize meter management. Vague policy for permitting (creating new customer accounts) and billing. Billing data maintained on paper records which are in disarray. No audits conducted to confirm billing data handling efficiency. Unknown number of customers escape routine billing due to lack of billing process oversight. Poor recordkeeping and meter oversight is recognized by water utility management who has allotted staff and funding resources to organize improved recordkeeping and start meter accuracy testing. Existing paper records gathered and organized to provide cursory disposition of meter population. Conditions between 2 and 4 to qualify for 4: Implement a reliable record keeping system for customer meter histories, preferably using electronic methods typically linked to, or part of, the Customer Billing System or Customer Information System. Expand meter accuracy testing to a larger group of meters. Policy for permitting and billing exists but needs refinement. Billing data maintained on paper records or insufficiently capable electronic database. Only periodic unstructured auditing work conducted to confirm billing data handling efficiency. Volume of unbilled water due to billing lapses is a guess. Conditions between 2 and 4 Reliable recordkeeping exists; meter information is improving as meters are replaced. Meter accuracy testing is conducted annually for a small number of meters. Limited number of oldest meters replaced each year. Inaccuracy volume is largely an estimate, but refined based upon limited testing data. Conditions between 4 and 6 to qualify for 6: Standardize procedures for meter recordkeeping with the electronic information system. Accelerate meter accuracy testing and meter replacements guided by testing results. Policy and procedures for permitting and billing exist but needs refinement. Computerized billing system exists, but is dated or lacks needed functionality. Periodic, limited internal audits conducted and confirm with approximate accuracy the consumption volumes lost to billing lapses. Conditions between 4 and 6 A reliable electronic recordkeeping system for meters exists. Population includes a mix of new high performing meters and dated meters with suspect accuracy. Routine, but limited, meter accuracy testing and meter replacement occur. Inaccuracy volume is quantified using a mix of reliable and less certain data. Policy for permitting and billing is adequate and reviewed periodically. Computerized billing system in use with basic reporting available. Any effect of billing adjustments on measured consumption volumes is well understood. Internal checks of billing data error conducted annually. Reasonably accurate quantification of consumption volume lost to billing lapses is obtained. Conditions between 6 and 8 to qualify for 8: Expand annual meter accuracy testing to evaluate a statistically significant number of meter makes/models. Expand meter replacement program to replace statistically significant number of poor performing meters each year. Conditions between 6 and 8 Ongoing meter replacement and accuracy testing result in highly accurate customer meter population. Testing is conducted on samples of meters at varying lifespans to determine optimum replacement time for various types of meters. Permitting and billing policy reviewed at least biannually. Computerized billing system includes an array of reports to confirm billing data and system functionality. Annual internal checks conducted with periodic third party audit. Accountability checks flag billing lapses. Consumption lost to billing lapses is well quantified and reducing year-by-year. Conditions between 8 and 10 to qualify for 10: Continue efforts to manage meter population with reliable recordkeeping, meter testing and replacement. Evaluate new meter types and install one or more types in 5-10 customer accounts each year in order to pilot improving metering technology. Conditions between 8 and 10 Good records of number, type and size of customer meters; ongoing meter replacement occurs. Regular meter accuracy testing gives reliable measure of composite inaccuracy volume for the system. New metering technology is embraced to keep overall accuracy improving. to maintain 10: Increase the number of meters tested and replaced as justified by meter accuracy test data. Continually monitor development of new technology in Advanced Metering Infrastructure (AMI) to grasp opportunities for greater accuracy in metering and customer consumption data. Sound policy exists for permitting of all customer billing accounts. Robust computerized billing system gives high functionality and reporting capabilities. Assessment of policy and data handling errors conducted internally and audited by third party annually, ensuring consumption lost to billing lapses is minimized and detected as it occurs. Improvements to attain higher data grading for "Systematic Data Handling Error volume" component: to qualify for 2: Draft written policy for permitting and billing. Investigate and budget for computerized customer billing system. Conduct initial audit of billing records by flow-charting the basic business processes of the customer account/billing function. to qualify for 4: Finalize written policy for permitting and billing. Implement a computerized customer billing system. Conduct initial audit of billing records as part of this process. to qualify for 6: Refine permitting and billing procedures and ensure consistency with the utility policy regarding billing, and minimize opportunity for missed billings. Upgrade or replace customer billing system for needed functionality - ensure that billing adjustments don't corrupt the value of consumption volumes. Procedurize internal annual audit process. to qualify for 8: Formalize regular review of permitting and billing practices. Enhance reporting capability of computerized billing system. Formalize regular auditing process to reveal scope of data handling error. to qualify for 10: Close policy/procedure loopholes that allow some customer accounts to go unbilled, or data handling errors to exist. Ensure that internal and third party audits are conducted annually. to maintain 10: Stay abreast of customer information management developments and innovations. Monitor developments of Advanced Metering Infrastructure (AMI) and integrate technology to ensure that customer endpoint information is well-monitored and errors/lapses are at an economic minimum. AWWA Water Loss Control Committee Grading Matrix 6
99 Grading n/a SYSTEM DATA Length of mains: Poorly assembled and maintained paper as-built records of existing water main installations makes accurate determination of system pipe length impossible. Length of mains is guesstimated. Paper records in poor condition (no annual tracking of installations & abandonments). Poor procedures to ensure that new water mains installed by developers are accurately documented. Conditions between 2 and 4 Sound policy and procedures for permitting and documenting new water main installations, but gaps in management result in a uncertain degree of error in tabulation of mains length. Conditions between 4 and 6 Sound policy and procedures exist for permitting and commissioning new water mains. Highly accurate paper records with regular field validation; or electronic records and asset management system in good condition. Includes system backup. Conditions between 6 and 8 Sound policy and procedures exist for permitting and commissioning new water mains. Electronic recordkeeping and asset management system are used to store and manage data. Conditions between 8 and 10 Sound policy exists for managing water mains extensions and replacements. Geographic Information System (GIS) data and asset management database agree and random field validation proves truth of databases. Improvements to attain higher data grading for "Length of Water Mains" component: Number of active AND inactive service connections: Improvements to attain higher data grading for "Number of Active and Inactive customer service connections" component: to qualify for 2: Assign personnel to inventory current as-built records and compare with customer billing system records and highway plans. Assemble policy documents regarding permitting and documentation of water main installations by the utility and building developers; identify gaps in procedure that result in poor documentation. Vague permitting (of new service connections) policy and poor paper recordkeeping of customer connections/billings result in suspect determination of the number of service connections, which may be 10-15% in error from actual count. to qualify for 2: Draft new policy and procedures for permitting and billing. Research and collect paper records of installations & abandonments for several years prior to audit year. to qualify for 4: Complete inventory of paper records of water main installations & abandonments for a number of years prior to audit year. Review policy and procedures for commissioning and documenting new water main installation and abandonments. General permitting policy exists but paper records, procedural gaps, and weak oversight result in questionable total for number of connections, which may vary 5-10% of actual count. Conditions between 2 and 4 to qualify for 4: Refine policy and procedures for permitting and billing. Research computerized recordkeeping system (Customer Information System or Customer Billing System) to improve documentation format for service connections. to qualify for 6: Finalize updates/improvements to policy and procedures for permitting/commissioning new main installations. Confirm inventory of records for five years prior to audit year; correct any errors or omissions. Permitting policy and procedures exist, but with some gaps in performance and oversight. Computerized information management system is being brought online to replace dated paper recordkeeping system. Reasonably accurate tracking of service connection installations & abandonments; but count can be up to 5% in error from actual total. Conditions between 4 and 6 to qualify for 6: Refine procedures to ensure consistency with permitting policy to establish new service connections or decommission existing connections. Improve process to include all totals for at least five years prior to audit year. to qualify for 8: Launch random field checks of limited number of locations. Convert to electronic databases with backup as justified. Permitting policy and procedures are adequate and reviewed periodically. Computerized information management system is in use with annual installations & abandonments totaled. Very limited field verifications and audits. Error in count of number of service connections is believed to be no more that 3%. Conditions between 6 and 8 to qualify for 8: Formalize regular review of permitting policy and procedures. Launch random field checks of limited number of locations. Develop reports and auditing mechanisms for computerized information management system. to qualify for 10: Link Geographic Information System (GIS) and asset management databases, conduct field verification of data. Permitting policy and procedures reviewed at least biannually. Wellmanaged computerized information management system and routine, periodic field checks and internal system audits allows counts of connections that is no more than 2% in error. Conditions between 8 and 10 to qualify for 10: Close any procedural loopholes that allow installations to go undocumented. Link computerized information management system with Geographic Information System (GIS) and formalize field inspection and information system auditing processes. Documentation of new or decommissioned service connections encounters several levels of checks and balances. to maintain 10: Continue with standardization and random field validation to improve knowledge of system. Sound permitting policy and well managed and audited procedures ensure reliable management of service connection population. Computerized information management system and Geographic Information System (GIS) information agree; field validation proves truth of databases. Count of connections believed to be in error by less than 1%. to maintain 10: Continue with standardization and random field validation to improve knowledge of system. Average length of customer service line: Note: if customer water meters are located outside of the customer building next to the curbstop or boundary separating utility/customer responsibility, follow the grading description for 10(a). Also see the Service Connection Diagram worksheet. Gradings 1-9 apply if customer properties are unmetered, if customer meters exist and are located inside the customer building premises, or if the water utility owns and is responsible for the entire service connection piping from the water main to the customer building. In any of these cases the average distance between the curbstop or boundary separating utility/customer responsibility for service connection piping, and the typical first point of use (ex: faucet) or the customer meter must be quantified. Gradings of 1-9 are used to grade the validity of the means to quantify this value. (See the "Service Connection Diagram" worksheet) Vague policy exists to define the delineation of water utility ownership and customer ownership of the service connection piping. Curbstops are perceived as the breakpoint but these have not been well-maintained or documented. Most are buried or obscured. Their location varies widely from site-to-site, and estimating this distance is arbitrary due to the unknown location of many curbstops. Policy requires that the curbstop serves as the delineation point between water utility ownership and customer ownership of the service connection piping. The piping from the water main to the curbstop is the property of the water utility; and the piping from the curbstop to the customer building is owned by the customer. Curbstop locations are not well documented and the average distance is based upon a limited number of locations measured in the field. Conditions between 2 and 4 Good policy requires that the curbstop serves as the delineation point between water utility ownership and customer ownership of the service connection piping. Curbstops are generally installed as needed and are reasonably documented. Their location varies widely from site-to-site, and an estimate of this distance is hindered by the availability of paper records. Conditions between 4 and 6 Clear policy exists to define utility/customer responsibility for service connection piping. Accurate, well-maintained paper or basic electronic recordkeeping system exists. Periodic field checks confirm piping lengths for a sample of customer properties. Conditions between 6 and 8 Clearly worded policy standardizes the location of curbstops and meters, which are inspected upon installation. Accurate and well maintained electronic records exist with periodic field checks to confirm locations of service lines, curbstops and customer meter pits. An accurate number of customer properties from the customer billing system allows for reliable averaging of this length. Conditions between 8 and 10 Either of two conditions can be met to obtain a grading of 10: a) The customer water meter is located outside of the customer building adjacent to the curbstop or boundary separating utility/customer responsibility for the service connection piping. In this case enter a value of zero in the Reporting Worksheet with a grading of 10. b). Customer water meters are located inside customer buildings, or the properties are unmetered. In either case the distance is highly reliable since data is drawn from a Geographic Information System (GIS) and confirmed by routine field checks. AWWA Water Loss Control Committee Grading Matrix 7
100 Grading n/a Improvements to attain higher data grading for "Average Length of Customer Service Line" component: to qualify for 2: Research and collect paper records of service line installations. Inspect several sites in the field using pipe locators to locate curbstops. Obtain the length of this small sample of connections in this manner. to qualify for 4: Formalize and communicate policy delineating utility/customer responsibilities for service connection piping. Assess accuracy of paper records by field inspection of a small sample of service connections using pipe locators as needed. Research the potential migration to a computerized information management system to store service connection data. to qualify for 6: Establish coherent procedures to ensure that policy for curbstop, meter installation and documentation is followed. Gain consensus within the water utility for the establishment of a computerized information management system. to qualify for 8: Implement an electronic means of recordkeeping, typically via a customer information system or customer billing system. Standardize the process to conduct field checks of limited number of locations. to qualify for 10: Link customer information management system and Geographic Information System (GIS), standardize process for field verification of data. to maintain 10: Continue with standardization and random field validation to improve knowledge of system. Average operating pressure: Available records are poorly assembled and maintained paper records of supply pump characteristics and water distribution system operating conditions. Average pressure is guesstimated based upon this information and ground elevations from crude topographical maps. Widely varying distribution system pressures due to undulating terrain, high system head loss and weak/erratic pressure controls further compromise the validity of the average pressure calculation. Limited telemetry monitoring of scattered sites provides some static pressure data, which is recorded in handwritten logbooks. Pressure data is gathered at individual sites only when low pressure complaints arise. Average pressure is determined by averaging relatively crude data, and is affected by significant variation in ground elevations, system head loss and gaps in pressure controls in the distribution system. Conditions between 2 and 4 Effective pressure controls separate different pressure zones; moderate pressure variation across the system, occasional open boundary valves are discovered that breech pressure zones. Basic telemetry monitoring of the distribution system logs pressure data electronically. Pressure data gathered by gauges or dataloggers at fire hydrants or buildings when low pressure complaints arise, and during fire flow tests and system flushing. Reliable topographical data exists. Average pressure is calculated using this mix of data. Conditions between 4 and 6 Reliable pressure controls separate distinct pressure zones; only very occasional open boundary valves are encountered that breech pressure zones. Wellcovered telemetry monitoring of the distribution system logs extensive pressure data electronically. Pressure gathered by gauges/dataloggers at fire hydrants and buildings when low pressure complaints arise, and during fire flow tests and system flushing. Average pressure is determined by using this mix of reliable data. Conditions between 6 and 8 Well-managed, discrete pressure zones exist with generally predictable pressure fluctuations. A current full-scale SCADA System exists to monitor the water distribution system and collect data, including real time pressure readings at representative sites across the system. The average system pressure is determined from reliable SCADA System data. Conditions between 8 and 10 Well-managed pressure districts/zones, SCADA System and hydraulic model exist to give very precise pressure data across the water distribution system. Average system pressure is reliably calculated from extensive, reliable, and cross-checked data. Improvements to attain higher data grading for "Average Operating Pressure" component: to qualify for 2: Employ pressure gauging and/or datalogging equipment to obtain pressure measurements from fire hydrants. Locate accurate topographical maps of service area in order to confirm ground elevations. Research pump data sheets to find pump pressure/flow characteristics to qualify for 4: Formalize a procedure to use pressure gauging/datalogging equipment to gather pressure data during various system events such as low pressure complaints, or operational testing. Gather pump pressure and flow data at different flow regimes. Identify faulty pressure controls (pressure reducing valves, altitude valves, partially open boundary valves) and plan to properly configure pressure zones. Make all pressure data from these efforts available to generate system-wide average pressure. to qualify for 6: Expand the use of pressure gauging/datalogging equipment to gather scattered pressure data at a representative set of sites, based upon pressure zones or areas. Utilize pump pressure and flow data to determine supply head entering each pressure zone or district. Correct any faulty pressure controls (pressure reducing valves, altitude valves, partially open boundary valves) to ensure properly configured pressure zones. Use expanded pressure dataset from these activities to generate system-wide average pressure. to qualify for 8: Install a Supervisory Control and Data Acquisition (SCADA) System to monitor system parameters and control operations. Set regular calibration schedule for instrumentation to insure data accuracy. Obtain accurate topographical data and utilize pressure data gathered from field surveys to provide extensive, reliable data for pressure averaging. to qualify for 10: Obtain average pressure data from hydraulic model of the distribution system that has been calibrated via field measurements in the water distribution system and confirmed in comparisons with SCADA System data. to maintain 10: Continue to refine the hydraulic model of the distribution system and consider linking it with SCADA System for real-time pressure data calibration, and averaging. AWWA Water Loss Control Committee Grading Matrix 8
101 Total annual cost of operating water system: Improvements to attain higher data grading for "Total Annual Cost of Operating the Water System" component: Customer retail unit cost (applied to Apparent Losses): Improvements to attain higher data grading for "Customer Retail Unit Cost" component: Variable production cost (applied to Real Losses): Grading n/a COST DATA Note: if the water utility purchases/imports its entire water supply, then enter the unit purchase cost of the bulk water supply in the Reporting Worksheet with a grading of 10 Incomplete paper records and lack of documentation on many operating functions making calculation of water system operating costs a pure guesstimate to qualify for 2: Gather available records, institute new procedures to regularly collect and audit basic cost data of most important operations functions. Antiquated, cumbersome water rate structure is use, with periodic historic amendments that were poorly documented and implemented; resulting in classes of customers being billed inconsistent charges. The actual composite billing rate likely differs significantly from the published water rate structure, but a lack of auditing leaves the degree of error indeterminate. to qualify for 2: Formalize the process to implement water rates, including a secure documentation procedure. Create a current, formal water rate document and gain approval from all stakeholders. Incomplete paper records and lack of documentation on primary operating functions (electric power and treatment costs most importantly) makes calculation of variable production costs a pure guesstimate Reasonably maintained, but incomplete, paper or electronic accounting provides data to estimate the major portion of water system operating costs. Dated, cumbersome water rate structure, not always employed consistently in actual billing operations. The actual composite billing rate is known to differ from the published water rate structure, and a reasonably accurate estimate of the degree of error is determined, allowing a composite billing rate to be quantified. Conditions between 2 and 4 to qualify for 4: Implement an electronic cost accounting system, structured according to accounting standards for water utilities Conditions between 2 and 4 to qualify for 4: Review the water rate structure and update/formalize as needed. Assess billing operations to ensure that actual billing operations incorporate the established water rate structure. Reasonably maintained, but incomplete, paper or electronic accounting provides data to roughly estimate the basic operations costs (pumping power costs and treatment costs) and calculate a unit variable production cost. Conditions between 2 and 4 Electronic, industry-standard cost accounting system in place. Gaps in data known to exist, periodic internal reviews conducted but not a structured audit. Straight-forward water rate structure in use, but not updated in several years. Billing operations reliably employ the rate structure. The composite billing rate is derived from a single customer class such as residential customer accounts, neglecting the effect of different rates from varying customer classes. Conditions between 4 and 6 to qualify for 6: Establish process for periodic internal audit of water system operating costs; identify cost data gaps and institute procedures for tracking these outstanding costs. to qualify for 6: Evaluate volume of water used in each usage block by residential users. Multiply volumes by full rate structure. Electronic, industry-standard cost accounting system in place. Electric power and treatment costs are reliably tracked and allow accurate calculation of unit variable production costs based on these two inputs only. All costs are audited internally on a periodic basis. Customer population unmetered. Fixed fee charged; single composite number derived from multiple customer classes. Meter customers and charge rates based upon water volumes Conditions between 4 and 6 Reliable electronic, industrystandard cost accounting system in place, with all pertinent water system operating costs tracked. Data audited periodically by utility personnel, not a Certified Public Accountant (CPA). Clearly written, up-to-date water rate structure is in force and is applied reliably in billing operations. Composite customer rate is determined using a weighted average residential rate using volumes of water in each rate block. Conditions between 6 and 8 to qualify for 8: Standardize the process to conduct routine financial audit on an annual basis. Conditions between 6 and 8 to qualify for 8: Evaluate volume of water used in each usage block by all classifications of users. Multiply volumes by full rate structure. Reliable electronic, industrystandard cost accounting system in place, with all pertinent water system operating costs tracked. Pertinent additional costs beyond power and treatment (ex: liability, residuals management, etc.) are included in the unit variable production cost. Data audited at least annually by utility personnel. Conditions between 6 and 8 Reliable electronic, industrystandard cost accounting system in place, with all pertinent water system operating costs tracked. Data audited at least annually by utility personnel, and periodically by third-party CPA. Effective water rate structure is in force and is applied reliably in billing operations. Composite customer rate is determined using a weighted average composite consumption rate, including residential, commercial, industrial and any other customer classes within the water rate structure. Reliable electronic, industrystandard cost accounting system in place, with all pertinent variable production costs tracked. Data audited at least annually by utility personnel, and periodically by third-party. Conditions between 8 and 10 to qualify for 10: Standardize the process to conduct a thirdparty financial audit by a CPA on an annual basis. Conditions between 8 and 10 to qualify for 10: Conduct a periodic third-party audit of water used in each usage block by all classifications of users. Multiply volumes by full rate structure. Conditions between 8 and 10 Reliable electronic, industrystandard cost accounting system in place, with all pertinent water system operating costs tracked. Data audited annually by utility personnel and by third-party CPA. to maintain 10: Maintain program, stay abreast of expenses subject to erratic cost changes and budget/track costs proactively Third party reviewed weighted average composite consumption rate (includes residential, commercial, industrial, etc.) to maintain 10: Keep water rate structure current in addressing the water utility's revenue needs. Update the calculation of the customer unit rate as new rate components, customer classes, or other components are modified. Either of two conditions can be met to obtain a grading of 10: 1) Third party CPA audit of all primary and secondary cost components on an annual basis. or: 2) Water supply is entirely purchased as bulk imported water, and unit purchase cost serves as the variable production cost. Improvements to attain higher data grading for "Variable Production Cost" component: to qualify for 2: Gather available records, institute new procedures to regularly collect and audit basic cost data and most important operations functions. to qualify for 4: Implement an electronic cost accounting system, structured according to accounting standards for water utilities to qualify for 6: to qualify for 8: Formalize process for regular internal audits of Formalize the accounting process to include production costs. Assess whether additional primary cost components (power, treatment) as costs (liability, residuals management, etc.) well as secondary components (liability, should be included to calculate a more residuals management, etc.) Conduct periodic accurate variable production cost. third-party audits. to qualify for 10: Standardize the process to conduct a thirdparty financial audit by a CPA on an annual basis. to maintain 10: Maintain program, stay abreast of expenses subject to erratic cost changes and budget/track costs proactively AWWA Water Loss Control Committee Grading Matrix 9
102 This page intentionally left blank
103 2015 Urban Water Management Plan Appendix F: SB X7-7 gpcd Verification Form F-1 LAC WW- D40AV 2015 UWMP Final_02_07_2017.docx
104
105 SB X7-7 Table 0: Units of Measure Used in UWMP* (select one from the drop down list) Acre Feet *The unit of measure must be consistent with Table 2-3 NOTES:
106 SB X7-7 Table-1: Baseline Period Ranges Baseline 10- to 15-year baseline period 5-year baseline period Parameter Value Units 2008 total water deliveries 54,102 Acre Feet 2008 total volume of delivered recycled water Acre Feet 2008 recycled water as a percent of total deliveries 0.00% Percent Number of years in baseline period 1 10 Years Year beginning baseline period range 1996 Year ending baseline period range Number of years in baseline period 5 Years Year beginning baseline period range 2003 Year ending baseline period range If the 2008 recycled water percent is less than 10 percent, then the first baseline period is a continuous 10-year period. If the amount of recycled water delivered in 2008 is 10 percent or greater, the first baseline period is a continuous 10- to 15-year period. 2 The ending year must be between December 31, 2004 and December 31, The ending year must be between December 31, 2007 and December 31, NOTES:
107 SB X7-7 Table 2: Method for Population Estimates Method Used to Determine Population (may check more than one) 1. Department of Finance (DOF) DOF Table E-8 ( ) and ( ) and DOF Table E-5 ( ) when available 2. Persons-per-Connection Method 3. DWR Population Tool NOTES: 4. Other DWR recommends pre-review
108 SB X7-7 Table 3: Service Area Population Year Population 10 to 15 Year Baseline Population Year ,355 Year ,479 Year ,048 Year ,915 Year ,788 Year ,117 Year ,182 Year ,991 Year ,259 Year ,374 Year 11 Year 12 Year 13 Year 14 Year 15 5 Year Baseline Population Year ,991 Year ,259 Year ,374 Year ,249 Year , Compliance Year Population ,068 NOTES:
109 SB X7-7 Table 4: Annual Gross Water Use * Deductions Baseline Year Fm SB X7-7 Table 3 Volume Into Distribution System Fm SB X7-7 Table(s) 4-A Exported Water Change in Dist. System Storage (+/-) Indirect Recycled Water Fm SB X7-7 Table 4-B Water Delivered for Agricultural Use Process Water Fm SB X7-7 Table(s) 4-D Annual Gross Water Use 10 to 15 Year Baseline - Gross Water Use Year ,417 Year ,733 Year ,265 Year ,234 Year ,074 Year ,701 Year ,636 Year ,279 Year ,579 Year ,490 Year Year Year Year Year year baseline average gross water use 34,161 5 Year Baseline - Gross Water Use Year , ,279 Year , ,579 Year , ,490 Year , ,184 Year , ,670 5 year baseline average gross water use 57, Compliance Year - Gross Water Use , ,410 * NOTE that the units of measure must remain consistent throughout the UWMP, as reported in Table 2-3 NOTES:
110 SB X7-7 Table 4-A: Volume Entering the Distribution System(s) Complete one table for each source. Name of Source Source 1 This water source is: The supplier's own water source A purchased or imported source Baseline Year Fm SB X7-7 Table 3 Volume Entering Distribution System Meter Error Adjustment* Optional (+/-) Corrected Volume Entering Distribution System 10 to 15 Year Baseline - Water into Distribution System Year ,417 Year ,733 Year ,265 Year ,234 Year ,074 Year ,701 Year ,636 Year ,279 Year ,579 Year ,490 Year Year Year Year Year Year Baseline - Water into Distribution System Year ,279 Year ,579 Year ,490 Year ,184 Year , Compliance Year - Water into Distribution System ,410 * Meter Error Adjustment - See guidance in Methodology 1, Step 3 of Methodologies Document NOTES:
111 SB X7-7 Table 5: Gallons Per Capita Per Day (GPCD) Baseline Year Fm SB X7-7 Table 3 Service Area Population Fm SB X7-7 Table 3 Annual Gross Water Use Fm SB X7-7 Table 4 Daily Per Capita Water Use (GPCD) 10 to 15 Year Baseline GPCD Year ,355 46, Year ,479 47, Year ,048 42, Year ,915 49, Year ,788 52, Year ,117 52, Year ,182 54, Year ,991 54, Year ,259 57, Year ,374 55, Year Year Year Year Year Year Average Baseline GPCD Year Baseline GPCD Baseline Year Fm SB X7-7 Table 3 Service Area Population Fm SB X7-7 Table 3 Gross Water Use Fm SB X7-7 Table 4 Daily Per Capita Water Use Year ,991 54, Year ,259 57, Year ,374 55, Year ,249 59, Year ,511 59, Year Average Baseline GPCD Compliance Year GPCD ,068 38, NOTES:
112 SB X7-7 Table 6: Gallons per Capita per Day Summary From Table SB X7-7 Table Year Baseline GPCD Year Baseline GPCD Compliance Year GPCD 165 NOTES:
113 SB X7-7 Table 7: 2020 Target Method Select Only One NOTES: Target Method Method 1 Method 2 Supporting Documentation SB X7-7 Table 7A SB X7-7 Tables 7B, 7C, and 7D Contact DWR for these tables Method 3 SB X7-7 Table 7-E Method 4 Method 4 Calculator
114 SB X7-7 Table 7-A: Target Method 1 20% Reduction Year Baseline GPCD 2020 Target GPCD NOTES:
115 SB X7-7 Table 7-F: Confirm Minimum Reduction for 2020 Target 5 Year Baseline GPCD From SB X7-7 Table 5 Maximum 2020 Target* Calculated 2020 Target Fm Appropriate Target Table Confirmed 2020 Target * Maximum 2020 Target is 95% of the 5 Year Baseline GPCD NOTES:
116 SB X7-7 Table 8: 2015 Interim Target GPCD Confirmed 2020 Target Fm SB X7-7 Table 7-F NOTES: year Baseline GPCD Fm SB X7-7 Table Interim Target GPCD
117 SB X7-7 Table 9: 2015 Compliance Actual 2015 GPCD 2015 Interim Target GPCD Extraordinary Events Optional Adjustments (in GPCD) Weather Normalization Economic Adjustment TOTAL Adjustments Adjusted 2015 GPCD 2015 GPCD (Adjusted if applicable) Did Supplier Achieve Targeted Reduction for 2015? From Methodology 8 (Optional) From Methodology 8 (Optional) From Methodology 8 (Optional) YES NOTES:
118 This page intentionally left blank
119 2015 Urban Water Management Plan Appendix G: Groundwater Basin Judgment/Adjudication G-1 LAC WW- D40AV 2015 UWMP Final_02_07_2017.docx
120
121 Antelope Valley Groundwater Small Pumper Class Action Antelope Valley Groundwater Small Pumper Class Action Website Home Page Superior Court of California Website Wood Class / Small Pumper 2015 JUDGMENT Map of Antelope Valley Adjudication Area FAQs Important Dates 2015 Judgment 2015 Class Notice 2013 Class Notice Judgment Exhibit A to Judgment Exhibit B to Judgment Exhibit C to Judgment Exhibit D to Judgment Judgment Approving Small Pumper Class Settlement 2009 Class Notice Wood Class Opt In Form If you have additional questions pumperinfo@avgroundwater.com Wood Class - Small Pumper Website Home Page Superior Court of California Website FAQs Important Dates pumperinfo@avgroundwater.com 9:49:08 AM]
122
123

124

125


126
127 2015 Urban Water Management Plan Appendix H: Phased Water Conservation Plan H-1 LAC WW- D40AV 2015 UWMP Final_02_07_2017.docx
128
129 PART 5 - PHASED WATER CONSERVATION PLAN SECTION A - STATEMENT OF POLICY DECLARATION OF PURPOSE, AND GENERAL PROHIBITION 5-A-1 STATEMENT OF POLICY AND DECLARATION OF PURPOSE: Because of the water supply conditions prevailing in any or all of the County Waterworks Districts and/or in the area from which any or all of the Districts obtain all or a portion of their supply, the general welfare requires that the water resources available to any or all of the Districts be put to the maximum beneficial use to the extent to which they are capable, and that the unreasonable use, or unreasonable method of use of water be discouraged and that the conservation of such water be practiced with a view to the reasonable and beneficial use thereof in the interest of the people of any or all of the Districts and for the public welfare. The purpose of this Phased Water Conservation Plan is to minimize the effect of a shortage of water supplies on the customers of any or all of the Districts during a water shortage emergency. 5-A-2 5-A-2a 5-A-2b GENERAL PROHIBITION No customer of the District or Districts shall make, cause, use, or permit the use of water from the District or Districts in a manner contrary to any provision of this ordinance. In the area of District No. 40, Antelope Valley; Region 34, Desert View Highlands, known as Ritter Ranch, as defined in Agreement No as amended between the District and Ritter Park Associates, the water use limitations contained in Agreement No as amended shall be implemented in addition to those required by this Part of these rules. SECTION B PHASE I SHORTAGE 5-B-1 PHASE I SHORTAGE DESCRETIONARY RESTRICTIONS BY THE DISTRICT ENGINEER If the Engineer determines that over consumption of water, loss of pressure in a system, breakdown, drought conditions or any similar occurrence, requires emergency restrictions upon the use of water from any system, he shall order such restrictions, including, but not limited to, any or all of the restrictions contained in Sections 5-B-1a through 5-B-1f. Part 5 Added 5/23/91 Ordinance No M Added 5-A-2, 5-A-2a & 5-A-2b 10/14 5-A-1 Rev 7/25/91, 10/14 5-B-1 Rev. 7/25/91, Rev. 10/14 500
130 PART 5 - PHASED WATER CONSERVATION PLAN (CONTINUED) SECTION B PHASE I SHORTAGE (CONTINUED) Any such order shall be communicated by the Engineer, either in writing or orally to water consumers served by the affected system. Water supply to any premises where use of water is being made in violation of an order of the Engineer may be shut off. When the engineer determines that the emergency no longer exists, he shall issue an order relieving the restrictions of prohibitions previously ordered under this Section. Such order shall be communicated to affected water consumers in the same manner in which the order instituting the restrictions or prohibitions was communicated. 5-B-1a 5-B-1b 5-B-1c 5-B-1d 5-B-1e 5-B-1f The use of water for watering of lawn, landscape or other turf area with water supplied by the District may be limited to specified days or hours of a day or altogether prohibited, except that the use of water for drinking, cooking, and sanitary purposes. The watering of lawn, landscape or other turf area with water supplied by the District shall be limited to not more than every other day and shall be prohibited between the hours of 10:00 a.m. and 5:00 p.m. New meters to provide construction water service shall not be issued Water Service ( Will Serve ) letters will be issued but such letters will be issued with the condition that permanent metered service to any newly created lot will be prohibited until the Board of Directors determines that the provisions of the Phased Water Conservation Plan are no longer in effect or that the severity of the water supply condition may be reduced to a Phase I or Phase II shortage. Existing meters providing construction water service shall be removed. No new permanent meters shall be installed. Any restrictions placed on the District by State of California 5-B-1a Rev. 10/14 5-B-1b Rev. 10/14 5-B-1c Rev. 10/14 5-B-1d Rev. 10/14 5-B-1e Rev. 10/14 5-B-1f Rev. 10/14 501
131 PART 5 - PHASED WATER CONSERVATION PLAN (CONTINUED) SECTION C AUTHORIZATION TO IMPLEMENT WATER CONSERVATION FOR PHASE II SHORTAGES THROUGH PHASE X SHORTAGES 5-C-1 5-C-1a 5-C-1b 5-C-1c AUTHORIZATION TO IMPLEMENT WATER CONSERVATION The Board of Directors of the Waterworks Districts may implement the applicable provisions of this conservation plan, following the public hearing required by Rule 5-C-1b, upon its determination that such implementation is necessary to protect the public welfare and safety. The Board of Directors of the Waterworks Districts shall hold a public hearing for the purpose of determining whether a shortage exists in any or all of the Districts and which measures provided by this ordinance should be implemented. Notice of the time and place of the public hearing shall be published not less than ten (10) days before the hearing in a newspaper of general circulation within the affected District or Districts. The Board of Directors shall issue its determination of shortage and corrective measures by resolution published in a daily newspaper of general circulation within the affected District or Districts. Conservation surcharges assessed per Rule 5-O-1 shall become effective on or after the date of such publication. SECTION D PHASE III SHORTAGE 5-D-1 5-D-1a 5-D-1b 5-D-1c PHASE II SHORTAGE: A Phase II Shortage shall be declared whenever the Board of Directors determines that it is likely that the District will suffer a ten percent (10%) shortage in its water supplies. A customer with a meter size of one and one-half (1-1/2) inches or larger shall be billed at his or her normal established water rate for all water used up to a target quantity of ninety percent (90%) of the base quantity. All water used in excess of the target quantity shall be subject to a conservation surcharge per Rule 5-O-1. The base quantity shall be determined by the amount of water used on the customer's premises during the corresponding billing period of a base period to be defined by the Board of Directors. For meter sizes of one (1) inch or less, a base quantity shall be the average of the water usage for all similar sized meters during the corresponding billing period of a base period to be defined by the BOARD. 5-C-1 Rev.10/14 5-C-1b Rev.10/14 5-C-1c Rev. 10/14, 6/2/15 5-D-1 Rev. 7/24/91, Rev. 1/09, Rev. 10/14 502
132 PART 5 - PHASED WATER CONSERVATION PLAN (CONTINUED) SECTION D PHASE II SHORTAGE (CONTINUED) A customer with a meter size of one (1) inch or less shall be billed at his or her normal established water rate for all water used up to a target quantity of ninety percent (90%) of the base quantity. All water used in excess of the target quantity shall be subject to a conservation surcharge per Rule 5-O-1. SECTION E - PHASE III SHORTAGE 5-E-1 5-E-1a 5-E-1b 5-E-1c PHASE III SHORTAGE: A Phase III Shortage shall be declared whenever the Board of Directors determines that it is likely that the District will suffer a shortage of between ten percent (10%) and fifteen percent (15%) in its water supplies. A customer with a meter size of one and one-half (1 1/2) inches or larger shall be billed at his or her normal established water rate for all water used up to a target quantity of eighty-five percent (85%) of the base quantity. All water used in excess of the target quantity shall be subject to a conservation surcharge per Rule 5-O-1. The base quantity shall be determined by the amount of water used on the customer's premises during the corresponding billing period of a base period to be defined by the Board of Directors. For meter sizes of one (1) inch or less, a base quantity shall be the average of the water usage for all similar sized meters during the corresponding billing period of a base period to be defined by the BOARD. A customer with a meter size of one (1) inch or less shall be billed at his or her normal established water rate for all water used up to a target quantity of eighty-five percent (85%) of the base quantity. All water used in excess of the target quantity shall be subject to a conservation surcharge per Rule 5- O-1. 5-E-1 Rev.10/14 5-E-1c Rev. 7/24/91 503
133 PART 5 - PHASED WATER CONSERVATION PLAN (CONTINUED) SECTION F PHASE IV SHORTAGE 5-F-1 5-F-1a 5-F-1b 5-F-1c PHASE IV SHORTAGE: A Phase IV Shortage shall be declared whenever the Board of Directors determines that it is likely that the District will suffer a shortage of between fifteen percent (15%) and twenty percent (20%) in its water supplies. A customer with a meter size of one and one-half (1-1/2) inches or larger shall be billed at his or her normal established water rate for all water used up to a target quantity of eighty percent (80%) of the base quantity. All water used in excess of the target quantity shall be subject to a conservation surcharge per Rule 5-O-1. The base quantity shall be determined by the amount of water used on the customer's premises during the corresponding billing period of a base period to be defined by the Board of Directors. For meter sizes of one (1) inch or less, a base quantity shall be the average of the water usage for all similar sized meters during the corresponding billing period of a base period to be defined by the BOARD. A customer with a meter size of one (1) inch or less shall be billed at his or her normal established water rate for all water used up to a target quantity of eighty percent (80%) of the base quantity. All water used in excess of the target quantity shall be subject to a surcharge per Rule 5-O-1. SECTION G - PHASE V SHORTAGE 5-G-1 5-G-1a 5-G-1b PHASE V SHORTAGE: A Phase V Shortage shall be declared whenever the Board of Directors determines that it is likely that the District will suffer a shortage of between twenty percent (20%) and twenty-five percent (25%) in its water supplies A customer with a meter size of one and one-half (1-1/2) inches or larger shall be billed at his or her normal established water rate for all water used up to a target quantity of seventy-five percent (75%) of the base quantity. All water used in excess of the target quantity shall be subject to a conservation surcharge per Rule 5-O-1. The base quantity shall be determined by the amount of water used on the customer's premises during the corresponding billing period of a base period to be defined by the Board of Directors. 5-F-1 Rev.10/14 5-F-1c Rev. 7/91, Rev. 1/09 5-F-1d Deleted.10/14 5-F-1e Deleted.10/14 5-G-1 Rev.10/14 504
134 PART 5 - PHASED WATER CONSERVATION PLAN (CONTINUED) SECTION G - PHASE V SHORTAGE (CONTINUED) 5-G-1c For meter sizes of one (1) inch or less, a base quantity shall be the average of the water usage for all similar sized meters during the corresponding billing period of a base period to be defined by the BOARD. A customer with a meter size of one (1) inch or less shall be billed at his or her normal established water rate for all water used up to a target quantity of seventy-five percent (75%) of the base quantity. All water used in excess of the target quantity shall be subject to a conservation surcharge per Rule 5- O-1. 5-G-1d The watering of lawn, landscape or other turf area with water supplied by the District shall be limited to not more than every other day and shall be prohibited between the hours of 10:00 a.m. and 5:00 p.m. SECTION H - PHASE VI SHORTAGE 5-H-1 5-H-1a 5-H-1b 5-H-1c PHASE VI SHORTAGE: A Phase VI Shortage shall be declared whenever the Board of Directors determines that it is likely that the District will suffer a shortage of between twenty-five (25%) and thirty percent (30%) in its water supplies. A customer with a meter size of one and one-half (1-1/2) inches or larger shall be billed at his or her normal established water rate for all water used up to a target quantity of seventy percent (70%) of the base quantity. All water used in excess of the target quantity shall be subject to a conservation surcharge per Rule 5-O-1. The base quantity shall be determined by the amount of water used on the customer's premises during the corresponding billing period of a base period to be defined by the Board of Supervisors. For meter sizes of one (1) inch or less, a base quantity shall be the average of the water usage for all similar sized meters during the corresponding billing period of a base period to be defined by the BOARD. A customer with a meter size of one (1) inch or less shall be billed at his or her normal established water rate for all water used up to a target quantity of seventy percent (70%) of the base quantity. All water used in excess of the target quantity shall be subject to a conservation surcharge per Rule 5-O-1. 5-G-1c Rev. 7/91, Rev. 1/09 5-G-1e Deleted.10/14 5-G-1f Deleted.10/14 5-H-1 Rev.10/14 5-H0-1c Rev. 7/91, Rev. 1/09 5-H-1d Deleted.10/14 5-H-1e Deleted.10/14 5-H-1f Deleted.10/14 505
135 PART 5 - PHASED WATER CONSERVATION PLAN (CONTINUED) SECTION I - PHASE VII SHORTAGE 5-I-1 5-I-1a 5-I-1b 5-I-1c PHASE VII SHORTAGE: A Phase VII Shortage shall be declared whenever the Board of Directors determines that it is likely that the District will suffer a shortage of between thirty (30%) and thirty-five percent (35%) in its water supplies. A customer with a meter size of one and one-half (1-1/2) inches or larger shall be billed at his or her normal established water rate for all water used up to a target quantity of sixty-five percent (65%) of the base quantity. All water used in excess of the target quantity shall be subject to a conservation surcharge per Rule 5-O-1. The base quantity shall be determined by the amount of water used on the customer's premises during the corresponding billing period of a base period to be defined by the Board of Directors. For meter sizes of one (1) inch or less, a base quantity shall be the average of the water usage for all similar sized meters during the corresponding billing period of a base period to be defined by the BOARD. A customer with a meter size of one (1) inch or less shall be billed at his or her normal established water rate for all water used up to a target quantity of sixty-five percent (65%) of the base quantity. All water used in excess of the target quantity shall be subject to a conservation surcharge per Rule 5-O-1. SECTION J - PHASE VIII SHORTAGE 5-J-1 5-J-1a 5-J-1b 5-I-1 5-I-1d 5-I-1e 5-I-1f 5-J-1 PHASE VIII SHORTAGE: A Phase VIII Shortage shall be declared whenever the Board of Directors determined that it is likely that the District will suffer a shortage of between thirty-five (35%) and forty percent (40%) in its water supplies. A customer with a meter size of one and one-half (1-1/2) inches or larger shall be billed at his or her normal established water rate for all water used up to a target quantity of sixty percent (60%) of the base quantity. All water used in excess of the target quantity shall be subject to a conservation surcharge per Rule 5-O-1. The base quantity shall be determined by the amount of water used on the customer's premises during the corresponding billing period of a base period to be defined by the Board of Directors. Rev.10/14 Deleted.10/14 Deleted.10/14 Deleted.10/14 Rev.10/14 506
136 PART 5 - PHASED WATER CONSERVATION PLAN (CONTINUED) SECTION J - PHASE VIII SHORTAGE (CONTINUED) 5-J-1c For meter sizes of one (1) inch or less, a base quantity shall be computed by averaging the water usage for all similar sized meters during the corresponding billing period of a base period to be defined by the Board of Directors. A customer with a meter size of one (1) inch or less shall be billed at his or her normal established water rate for all water used up to a target quantity of sixty percent (60%) of the base quantity. All water used in excess of the target quantity shall be subject to a surcharge per Rule 5-O-1. SECTION K - PHASE IX SHORTAGE 5-K-1 5-K-1a 5-K-1b 5-K-1c PHASE IX SHORTAGE A Phase IX Shortage shall be declared whenever the Board of Directors determines that it is likely that the District will suffer a shortage of between forty percent (40%) and forty-five percent (45%) in its water supplies. A customer with a meter size of one and one-half (1-1/2) inches or larger shall be billed at his or her normal established water rate for all water used up to a target quantity of fifty-five percent (55%) of the base quantity. All water used in excess of the target quantity shall be subject to a conservation surcharge per Rule 5-O-1. The base quantity shall be determined by the amount of water used on the customer's premises during the corresponding billing period of a base period to be defined by the Board of Directors. For meter sizes of one (1) inch or less, a base quantity shall be computed by averaging the water usage for all similar sized meters during the corresponding billing period of a base period to be defined by the Board of Directors. A customer with a meter size of one (1) inch or less shall be billed at his or her normal established water rate for all water used up to fifty-five percent (55%) of the base quantity. All water used in excess of the target quantity shall be subject to a conservation surcharge per Rule 5-O-1. 5-J-1 5-J-1d 5-J-1e 5-J-1f 5-K-1 5-K-1d 5-K-1e 5-K-1f 5-K-1g Rev.10/14 Deleted.10/14 Deleted.10/14 Deleted.10/14 Rev.10/14 Deleted.10/14 Deleted.10/14 Deleted.10/14 Deleted.10/14 507
137 PART 5 - PHASED WATER CONSERVATION PLAN (CONTINUED) SECTION L - PHASE X SHORTAGE 5-L-1 5-L-1a 5-L-1b 5-L-1c PHASE X SHORTAGE A Phase X Shortage shall be declared whenever the Board of Directors determines that it is likely that the District will suffer a shortage of between forty-five (45%) and fifty percent (50%) in its water supplies. A customer with a meter size of one and one-half (1-1/2) inches or larger shall be billed at his or her normal established water rate for all water used up to a target quantity of fifty percent (50%) of the base quantity. All water used in excess of the target quantity shall be subject to a conservation surcharge per Rule 5-O-1. The base quantity shall be determined by the amount of water used on the customer's premises during the corresponding billing period of a base period to be defined by the Board of Directors. For meter sizes of one (1) inch or less, a base quantity shall be computed by averaging the water usage for all similar sized meters during the corresponding billing period of a base period to be defined by the Board of Directors. A customer with a meter size of one (1) inch or less shall be billed at his or her normal established water rate for all water used up to a target quantity of fifty percent (50%) of the base quantity. All water used in excess of the target quantity shall be subject to a conservation surcharge per Rule 5-O-1. SECTION M - RELIEF FROM COMPLIANCE 5-M-1 5-M-1a 5-M-1b 5-L-1 5-L-1d 5-L-1e 5-L-1f 5-L-1g RELIEF FROM COMPLIANCE: A customer may file an application for relief from any provisions of this ordinance. The Director of Public Works shall develop such procedures as he or she considers necessary to resolve such applications and shall, upon the filling by a customer of an application for relief, take such steps as he or she deems reasonable to resolve the application for relief. The decision of the Director of Public Works shall be final. The Director of Public Works may delegate his or her duties and responsibilities under this Rule as appropriate. The application for relief may include a request that the customer be relieved, in whole or in part, from the conservation surcharge provisions of Rules 5-D-1b, 5-D-1c, 5-E-1b, 5-E-1c, 5-F-1b, 5-F-1c, 5-G-1b, 5-G-1c, 5-H- 1b, 5-H-1c, 5-I-1b, 5-I-1c, 5-J-1b, 5-J-1c, 5-K-1b, 5-K-1c, 5-L-1b, and 5-L-1c. Rev.10/14 Deleted.10/14 Deleted.10/14 Deleted.10/14 Deleted.10/14 508
138 PART 5 - PHASED WATER CONSERVATION PLAN (CONTINUED) SECTION M - RELIEF FROM COMPLIANCE (CONTINUED) 5-M-1c In determining whether to grant relief, and the nature of any relief, the Director of Public Works shall take into consideration all relevant factors including, but not limited to: 1. Whether any additional reduction in water consumption will result in unemployment; 2. Whether additional members have been added to the household; 3. Whether any additional landscaped property has been added to the property since the corresponding billing period of the base year; 4. Changes in vacancy factors in multi-family housing; 5. Increased number of employees in commercial, industrial, and governmental offices; 6. Increased production requiring increased process water; 7. Water uses during new construction; 8. Adjustments to water use caused by emergency health or safety hazards; 9. First filling of a permit-constructed swimming pool; and 10. Water use necessary for reasons related to family illness or health. 11. Whether the basic period for billing should be adjusted due to the unique circumstances of the type of facility, such as a boat, which results in irregular, intermittent periods of consumption. 5-M-1d In order to be considered, an application for relief must be filed with the District within twenty (20) days from the date the provision from which relief is sought becomes applicable to the applicant. No relief shall be granted unless the customer shows that he or she has achieved the maximum practical reduction in water consumption other than in the specific areas in which relief is being sought. No relief shall be granted to any customer who, when requested by the Director of Public Works or designee, fails to provide any information necessary for resolution of the customer's application for relief. The decision shall be issued within twenty (20) days and provided to the customer. Part 5 Added 5/23/91 Ordinance No M 509
139 PART 5 - PHASED WATER CONSERVATION PLAN (CONTINUED) SECTION N - NOTIFICATION OF CUSTOMERS 5-N-1 5-N-1a NOTIFICATION OF CUSTOMERS: Each customer will be notified on his or her bill as to what the target quantity and the base quantity will be for the applicable billing period. SECTION O - CONSERVATION SURCHARGES 5-O-1 5-O-1a : CONSERVATION SURCHARGES: Water use up to the target quantities specified in Rules 5-D-1b, 5-D-1c, 5-E-1b, 5-E-1c, 5-F-1b, 5-F-1c, 5-G-1b, 5-G-1c, 5-H-1b, 5-H-1c, 5-I-1b, 5-I- 1c, 5-J-1b, 5-J-1c, 5-K-1b, 5-K-1c, 5-L-1b, and 5-L-1c shall be billed at the established QUANTITY CHARGE or NORMAL USE CHARGE. Water use in excess of the aforementioned target quantities shall be subject to the following conservation surcharges in addition to the established QUANTITY CHARGE or NORMAL USE CHARGE 1. For all customers within Los Angeles County Waterworks Districts and Marina Del Rey Water System, an additional conservation surcharge of 0.5 times the established QUANTITY CHARGE or NORMAL USE CHARGE will be assessed for water use in excess of the target quantity, up to 115 percent of the target quantity. 2. For all customers within Los Angeles County Waterworks Districts and Marina Del Rey Water System, an additional conservation surcharge of 1.0 times the established QUALITY CHARGE or NORMAL USE CHARGE will be assessed for water use in excess of 115 percent of the target quantity. 3. If cost of purchased water obtained from the water wholesalers that sell water to the Los Angeles County Waterworks Districts increases beyond the amounts that can be offset and collected through the rates set in 1 and 2 of this provision, then the District Engineer is hereby authorized to revise the rates set in 1 and 2 of this provision in amounts necessary to offset the cost to purchase the water. The foregoing amendments to Rule 5-O-1a, as enacted on June 2, 2015, shall expire on June 1, 2016, on which date Rule 5-O-1a shall revert to the provisions of Rule 5-O-1a as enacted on May 22, 1991, by Ordinance No M. Part 5 Added 5/23/91 Ordinance No M 5-O-1a Rev 6/2/15 510
140 PART 5 - PHASED WATER CONSERVATION PLAN (CONTINUED) SECTION O - CONSERVATION SURCHARGES (CONTINUED) 5-O-1b Violation by any customer of the water use prohibitions of Rules 5-B-1a, 5-B-1b, 5-B-1c, 5-B-1d, 5-B-1e, and 5-B-1f shall be penalized as follows: 1. First violation. The Director of Public Works or designee shall issue a written notice of the fact of a first violation to the customer. 2. Second violation. For a second violation during any one water shortage emergency, the Director of Public Works or designee shall issue a written notice of the fact of a second violation to the customer. 3. Third and subsequent violations. For a third and each subsequent violation during any one water shortage emergency, the Director of Public Works or designee may install a flow-restricting device or the service of the customer at the premises at which the violation occurred for installing and for removing the flow-restricting devices and for restoration of normal service. The charge shall be paid before normal service can be restored. 5-O-1c 5-O-1d All monies collected by a District pursuant to this ordinance shall be deposited in that District's General Fund as reimbursement for the District's costs and expenses of administering this conservation plan. The District shall give notice to customer of water conservation surcharges or of water usage violations as follows: a. Notice of water conservation surcharges or of first and second violations of the water use prohibitions of Rules 5-B-1a, 5-B-1b, 5-B-1c, 5-B-1d, 5-B- 1e, and 5-B-1f shall be given to the customer in person or by regular mail. b. If the customer is absent from or unavailable at the premises at which the violation occurred, by leaving a copy with some person of suitable age and discretion at the premises and sending a copy through the regular mail to the address at which the customer is normally billed; or c. If a person of suitable age or discretion cannot be found, then by affixing a copy in a conspicuous place at the premises at which the violation occurred and also sending a copy through the regular mail to the address at which the customer is normally billed. 5-O-1b 5-O-1d Rev.10/14 Rev.10/14 511
141 PART 5 - PHASED WATER CONSERVATION PLAN (CONTINUED) SECTION O - CONSERVATION SURCHARGES (CONTINUED) 5-O-1e 5-O-1f The notice of a violation of the water use prohibitions of Rules 5-B-1a, 5-B- 1b, 5-B-1c, 5-B-1d, 5-B-1e, and 5-B-1f shall contain a description of the facts of the violation, a statement of the possible penalties for each violation and a statement informing the customer of his right to a hearing on the merits of the violation pursuant to Rule 5-P-1. Nothing in these regulations shall prohibit any customer from either installing sub-meters or from pro-rating and collecting from the ultimate users any conservation surcharges assessed when the customer's master meter measures consumption of water for multiple tenancy facilities. However, unless the sub-meters are subsequently billed directly by the District, the customer responsible for the master meter shall continue to be responsible directly to the District for all payments including conservation surcharges. SECTION P - HEARING REGARDING VIOLATIONS 5-P-1 5-P-1a HEARING REGARDING VIOLATIONS: Any customer receiving notice of a third or subsequent violations of the water use prohibitions of Rules 5-B-1a, 5-B-1b, 5-B-1c, 5-B-1d, 5-B-1e and 5-B-1f shall have a right to a hearing by the Director of Public Works or his designee within fifteen (15) days of a mailing or other delivery of the notice of violation. 5-P-1b The customer's written request for a hearing must be received within ten (10) days of the issuance of the notice of violation. This request shall stay installation of a flow-restricting device on the customer's premises and the assessment of any surcharge until the Director of Public Works or designee renders his or her decision. The decision shall be issued within ten (10) days of the hearing, a copy of which shall be provided to the customer. 5-P-1c The decision of the Director of Public Works shall be final except for judicial review. 5-O-1e 5-P-1a Rev.10/14 Rev.10/14 512
142 PART 5 - PHASED WATER CONSERVATION PLAN (CONTINUED) SECTION Q - ADDITIONAL WATER SHORTAGE MEASURES 5-Q-1 ADDITIONAL WATER SHORTAGE MEASURES: The Board of Directors may order implementation of water conservation measures in addition to those set forth in Rules 5-B-1, 5-D-1, 5-E-1, 5-F-1, 5- G-1, 5-H-1, 5-I-1, 5-J-1, 5-K-1, and 5-L-1. Such additional water conservation measures shall be implemented in the manner provided in Rule 5-C-1. SECTION R - PUBLIC HEALTH AND SAFETY NOT TO BE AFFECTED 5-R-1 PUBLIC HEALTH AND SAFETY NOT TO BE AFFECTED: Nothing in this ordinance shall be construed to require the District to curtail the supply of water to any customer when such water is required by that customer to maintain an adequate level of public health and safety. SECTION S - SEVERABILITY 5-S-1 SEVERABILITY: If any part of this ordinance or the application thereof to any person or circumstances is for any reason held invalid or unconstitutional by a decision of any court of competent jurisdiction, the validity of the remainder of the ordinance or the application of such provision to other persons or circumstances shall not be affected. The Board of Directors of the District or Districts declares that it would have adopted this ordinance and all provisions hereof irrespective of the fact that any one or more of the provisions be declared invalid or unconstitutional. 5-Q-1 Rev.10/14 513
143 2015 Urban Water Management Plan Appendix I: CUWCC Online Reports I-1 LAC WW- D40AV 2015 UWMP Final_02_07_2017.docx
144
145 CUWCC BMP Retail Coverage Report 2013 Foundational Best Managemant Practices for Urban Water Efficiency 5029 BMP 1.1 Operation Practices Los Angeles County Waterworks District 40 - Antelope Valley ON TRACK 1. Conservation Coordinator provided with necessary resources to implement BMPs? Name: Title: Iwen Tseng Water Conservation Coordinator itseng@dpw.lacounty.gov 2. Water Waste Prevention Documents WW Document Name WWP File Name WW Prevention URL WW Prevention Ordinance Terms Description Option A Describe the ordinances or terms of service adopted by your agency to meet the water waste prevention requirements of this BMP. Copy_of_LA_County_Wate r_conservation_ordinance _ U.pdf supdocs/41412.pdf Water Conservation Requirements for the Unincorporated Los Angeles County Area Title 11- Health and Safety of the Los Angeles County Code, Ordinance No U Option B Describe any water waste prevention ordinances or requirements adopted by your local jurisdiction or regulatory agencies within your service area. Option C Describe any documentation of support for legislation or regulations that prohibit water waste. Option D Describe your agency efforts to cooperate with other entities in the adoption or enforcement of local requirements consistent with this BMP. Option E Describe your agency support positions with respect to adoption of legislation or regulations that are consistent with this BMP. Option F Describe your agency efforts to support local ordinances that establish permits requirements for water efficient design in new development. CityofLancaster Urgency Ordinance No 905 prohibiting waste of water.pdf LACWaterworksRulesAnd RegulationsPart5.pdf a.org/home/showdocumen t?id= wd/web/documents/part5. pdf City of Lancaster Municipal Code Title 8 Chapter 8.48 Waste of Water Los Angeles County Waterworks Districts Rules and Regulations Part 5: Phased Water Conservation Plan At Least As effective As No
146 CUWCC BMP Retail Coverage Report 2013 Foundational Best Managemant Practices for Urban Water Efficiency BMP 1.1 Operation Practices ON TRACK Exemption Comments: No
147 CUWCC BMP Coverage Report 2013 Foundational Best Management Practices For Urban Water Efficiency BMP 1.2 Water Loss Control ON TRACK Los Angeles County Waterworks District 40 - Antelope 5029 Valley Completed Standard Water Audit Using AWWA Software? AWWA File provided to CUWCC? Yes Yes District xls AWWA Water Audit Validity Score? 80 Complete Training in AWWA Audit Method Complete Training in Component Analysis Process? Component Analysis? Repaired all leaks and breaks to the extent cost effective? Locate and Repar unreported leaks to the extent cost effective? Yes Yes Yes Yes Yes Maintain a record keeping system for the repair of reported leaks, including time of report, leak location, type of leaking pipe segment or fitting, and leak running time from report to repair. Yes Provided 7 Types of Water Loss Control Info Leaks Repairs Value Real Losses Value Apparent Losses Miles Surveyed Press Reduction Cost Of Interventions Water Saved (AF) False At Least As effective As No Exemption Comments: No NOTE: Change cost of repair answer to Yes. Program bug prohibiting change at this time.
148 CUWCC BMP Coverage Report 2013 Foundational Best Management Practices For Urban Water Efficiency BMP 1.3 Metering With Commodity ON TRACK 5029 Los Angeles County Waterworks District 40 - Antelope Valley Numbered Unmetered Accounts Metered Accounts billed by volume of use Number of CII Accounts with Mixed Use Meters No Yes 0 Conducted a feasibility study to assess merits of a program to provide incentives to switch mixed-use accounts to dedicated landscape meters? Yes Feasibility Study provided to CUWCC? Yes Date: 1/1/0001 Uploaded file name: Completed a written plan, policy or program to test, repair and replace meters Yes At Least As effective As No NA Exemption No Comments: NA
149 CUWCC BMP Coverage Report 2013 Foundational Best Management Practices For Urban Water Efficiency BMP 1.4 Retail Conservation Pricing On Track 5029 Los Angeles County Waterworks District 40 - Antelope Valley Implementation (Water Rate Structure) Customer Class Water Rate Type Conserving Rate? (V) Total Revenue Comodity Charges (M) Total Revenue Fixed Carges 1 Single-Family Increasing Block Seasonal Yes Multi-Family 4 Uniform Yes Commercial Uniform Yes Industrial Uniform Yes Institutional Uniform Yes Other Uniform Yes Calculate: V / (V + M) 59 % Implementation Option: Use Annual Revenue As Reported Use 3 years average instead of most recent year Canadian Water and Wastewater Association Upload file: Agency Provide Sewer Service: At Least As effective As No No NA Exemption No Comments: Option 3 used
150 CUWCC BMP Coverage Report 2013 Foundational Best Management Practices For Urban Water Efficiency BMP 2.1 Public Outreach ON TRACK 5029 Los Angeles County Waterworks District 40 - Antelope Valley Retail Does your agency perform Public Outreach programs? The list of wholesale agencies performing public outreach which can be counted to help the agency comply with the BMP Antelope Valley East Kern Water Agency Yes The name of agency, contact name and address if not CUWCC Group 1 members Did at least one contact take place during each quater of the reporting year? No p Public Outreach Program List Number Website 4 Flyers and/or brochures (total copies), bill stuffers, messages printed on bill, information packets Landscape water conservation media campaigns 9 General water conservation information 4 6 Total 23 Did at least one contact take place during each quater of the reporting year? Yes Number Media Contacts Number Television contacts 4 Radio contacts 4 Newspaper contacts 5 Online Advertisings 3 Total 16 Did at least one website update take place during each quater of the reporting year? Yes Public Information Program Annual Budget Description of all other Public Outreach programs Smart Landscape Workshops Comments: At Least As effective As No Exemption No 0
151 CUWCC BMP Coverage Report 2013 Foundational Best Management Practices For Urban Water Efficiency BMP 2.2 School Education Programs ON TRACK 5029 Los Angeles County Waterworks District 40 - Antelope Valley Retail Does your agency implement School Education programs? Yes The list of wholesale agencies performing public outreach which can be counted to help the agency comply with the BMP Antelope Valley East Kern Water Agency Materials meet state education framework requirements? Each assembly covered a wide array of California Science Standards and district-specific curriculum developed by the public relations consultant that included conservation tips and information about local water sources. Materials distributed to K-6? Yes The 50-minute game show format assemblies included information about water changing phases, proportions of water on the Earth, local drinking water sources, and easy ways to conserve. Each assembly covered a wide array of California Science Standards Yes Materials distributed to 7-12 students? No (Info Only) Annual budget for school education program: Description of all other water supplier education programs Comments: At Least As effective As No Exemption No 0
152 This page intentionally left blank.
153 CUWCC BMP Retail Coverage Report 2014 Foundational Best Managemant Practices for Urban Water Efficiency BMP 1.1 Operation Practices ON TRACK 5029 Los Angeles County Waterworks District 40 - Antelope Valley 1. Conservation Coordinator provided with necessary resources to implement BMPs? Name: Title: Kirk Allen Water Conservation Coordinator kallen@dpw.lacounty.gov 2. Water Waste Prevention Documents WW Document Name WWP File Name WW Prevention URL WW Prevention Ordinance Terms Description Option A Describe the ordinances or terms of service adopted by your agency to meet the water waste prevention requirements of this BMP. supdocs/91787.pdf Water Conservation Requirements for the Unincorporated Los Angeles County Area Title 11- Health and Safety of the Los Angeles County Code, Ordinance No Option B Describe any water waste prevention ordinances or requirements adopted by your local jurisdiction or regulatory agencies within your service area. Option C Describe any documentation of support for legislation or regulations that prohibit water waste. Option D Describe your agency efforts to cooperate with other entities in the adoption or enforcement of local requirements consistent with this BMP. Option E Describe your agency support positions with respect to adoption of legislation or regulations that are consistent with this BMP. Option F Describe your agency efforts to support local ordinances that establish permits requirements for water efficient design in new development. a.org/home/showdocumen t?id= wd/web/documents/part5. pdf City of Lancaster Municipal Code Title 8 Chapter 8.48 Waste of Water Los Angeles County Waterworks Districts Rules and Regulations Part 5: Phased Water Conservation Plan At Least As effective As No
154 CUWCC BMP Retail Coverage Report 2014 Foundational Best Managemant Practices for Urban Water Efficiency BMP 1.1 Operation Practices ON TRACK Exemption Comments: No
155 CUWCC BMP Coverage Report 2014 Foundational Best Management Practices For Urban Water Efficiency BMP 1.2 Water Loss Control ON TRACK Los Angeles County Waterworks District 40 - Antelope 5029 Valley Completed Standard Water Audit Using AWWA Software? AWWA File provided to CUWCC? Yes Yes District xls AWWA Water Audit Validity Score? 80 Complete Training in AWWA Audit Method Complete Training in Component Analysis Process? Component Analysis? Repaired all leaks and breaks to the extent cost effective? Locate and Repar unreported leaks to the extent cost effective? Yes Yes Yes Yes Yes Maintain a record keeping system for the repair of reported leaks, including time of report, leak location, type of leaking pipe segment or fitting, and leak running time from report to repair. Yes Provided 7 Types of Water Loss Control Info Leaks Repairs Value Real Losses Value Apparent Losses Miles Surveyed Press Reduction Cost Of Interventions Water Saved (AF) False At Least As effective As No Exemption Comments: No NOTE: Change cost of repair answer to Yes. Program bug prohibiting change at this time. Agency on-track.
156 CUWCC BMP Coverage Report 2014 Foundational Best Management Practices For Urban Water Efficiency BMP 1.3 Metering With Commodity ON TRACK 5029 Los Angeles County Waterworks District 40 - Antelope Valley Numbered Unmetered Accounts Metered Accounts billed by volume of use Number of CII Accounts with Mixed Use Meters No Yes 0 Conducted a feasibility study to assess merits of a program to provide incentives to switch mixed-use accounts to dedicated landscape meters? Yes Feasibility Study provided to CUWCC? Yes Date: 1/1/0001 Uploaded file name: Completed a written plan, policy or program to test, repair and replace meters Yes At Least As effective As No Exemption No Comments:
157 ON TRACK CUWCC BMP Coverage Report 2014 Foundational Best Management Practices For Urban Water Efficiency BMP 1.4 Retail Conservation Pricing 5029 Los Angeles County Waterworks District 40 - Antelope Valley Implementation (Water Rate Structure) Customer Class Water Rate Type Conserving Rate? (V) Total Revenue Comodity Charges (M) Total Revenue Fixed Carges 1 Single-Family Increasing Block Seasonal Yes Multi-Family 0 Uniform Yes Commercial Uniform Yes Industrial Uniform Yes Institutional Uniform Yes Other Uniform Yes Calculate: V / (V + M) 57 % Implementation Option: Use Canadian Water Wastewater Association Rate Design Model Use 3 years average instead of most recent year Canadian Water and Wastewater Association Upload file: Agency Provide Sewer Service: At Least As effective As No No Exemption No Comments: Option 3 used
158 CUWCC BMP Coverage Report 2014 Foundational Best Management Practices For Urban Water Efficiency BMP 2.1 Public Outreach ON TRACK 5029 Los Angeles County Waterworks District 40 - Antelope Valley Retail Does your agency perform Public Outreach programs? The list of wholesale agencies performing public outreach which can be counted to help the agency comply with the BMP Antelope Valley East Kern Water Agency Yes The name of agency, contact name and address if not CUWCC Group 1 members Did at least one contact take place during each quater of the reporting year? No p Public Outreach Program List Number Website 4 Flyers and/or brochures (total copies), bill stuffers, messages printed on bill, information packets Landscape water conservation media campaigns 9 General water conservation information 4 6 Total 23 Did at least one contact take place during each quater of the reporting year? Yes Number Media Contacts Number Television contacts 4 Radio contacts 4 Newspaper contacts 5 Online Advertisings 3 Total 16 Did at least one website update take place during each quater of the reporting year? Yes Public Information Program Annual Budget Description of all other Public Outreach programs Smart Landscape Workshops Comments: At Least As effective As No Exemption No 0
159 CUWCC BMP Coverage Report 2014 Foundational Best Management Practices For Urban Water Efficiency BMP 2.2 School Education Programs ON TRACK 5029 Los Angeles County Waterworks District 40 - Antelope Valley Retail Does your agency implement School Education programs? Yes The list of wholesale agencies performing public outreach which can be counted to help the agency comply with the BMP Antelope Valley East Kern Water Agency Materials meet state education framework requirements? Each assembly covered a wide array of California Science Standards and district-specific curriculum developed by the public relations consultant that included conservation tips and information about local water sources. Materials distributed to K-6? Yes The 50-minute game show format assemblies included information about water changing phases, proportions of water on the Earth, local drinking water sources, and easy ways to conserve. Each assembly covered a wide array of California Science Standards Yes Materials distributed to 7-12 students? No (Info Only) Annual budget for school education program: Description of all other water supplier education programs Comments: At Least As effective As No Exemption No 0
160 CUWCC BMP Coverage Report Los Angeles County Waterworks District 40 - Antelope Valley Baseline GPCD: GPCD in 2014 GPCD Target for 2018: Biennial GPCD Compliance Table ON TRACK Target Highest Acceptable Bound Year Report % Base GPCD % Base GPCD % % % % % % % % % %
161 Errata Sheet for Minor Corrections to Los Angeles County Waterworks District No. 40 Antelope Valley 2015 Urban Water Management Plan (UWMP) This errata sheet logs minor content errors that were identified after final adoption of the Brown and Caldwell 2015 UWMP. DWR has determined that these corrections are minor and do not require the UWMP to be amended. These data errors have been corrected in the Department of Water Resources (DWR) UWMP database at This errata sheet has been filed with the UWMP in all locations where it is made publicly available, including the California State Library. Errata may be submitted to State Library via to Name and agency of the person filing errata sheet: Nathalie Romero, Brown and Caldwell # Description of Correction Location Rationale Date Error Corrected 1 SBX7-7 Table 4: The year baseline average gross water use was changed from 34,161 to 51,241 Appendix F, SBX7-7 Table year baseline average gross water use was incorrectly reported. 4/4/ Table 6-3: Data was removed and box in top row was checked 3 Table 6-6: Future recycled water use description was added DWR Table 6-3 Lancaster WRP and Palmdale WRP are not located within the District UWMP area. DWR Table 6-6 Table 6-6 was not populated 4/4/2018 4/4/2018
162 SB X7-7 Table 4: Annual Gross Water Use * Deductions Baseline Year Fm SB X7-7 Table 3 Volume Into Distribution System Fm SB X7-7 Table(s) 4-A Exported Water Change in Dist. System Storage (+/-) Indirect Recycled Water Fm SB X7-7 Table 4-B Water Delivered for Agricultural Use Process Water Fm SB X7-7 Table(s) 4-D Annual Gross Water Use 10 to 15 Year Baseline - Gross Water Use Year ,417 Year ,733 Year ,265 Year ,234 Year ,074 Year ,701 Year ,636 Year ,279 Year ,579 Year ,490 Year Year Year Year Year year baseline average gross water use 51,241 5 Year Baseline - Gross Water Use Year , ,279 Year , ,579 Year , ,490 Year , ,184 Year , ,670 5 year baseline average gross water use 57, Compliance Year - Gross Water Use , ,410 * NOTE that the units of measure must remain consistent throughout the UWMP, as reported in Table 2-3 NOTES:
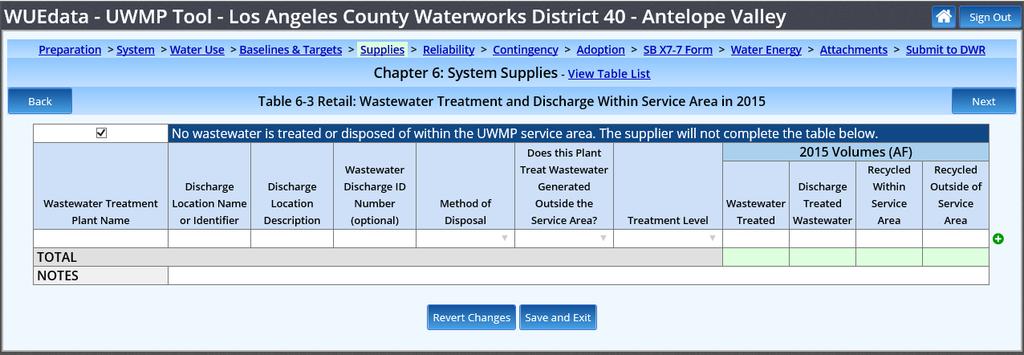
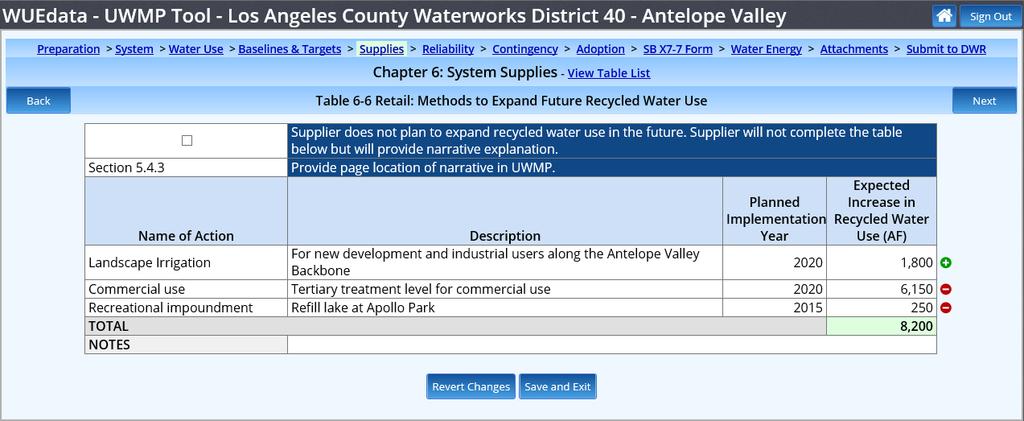
163