NATS 101 Section 13: Lecture 34. Global Warming Part I
|
|
|
- Phebe Malone
- 5 years ago
- Views:
Transcription
1 NATS 101 Section 13: Lecture 34 Global Warming Part I
2 Outline of three part global warming presentation What is the problem? How has the Earth s climate changed in recent years? Are these changes attributable to human activity? What are the future projections and uncertainties? What are the potential fixes to the problem?
3 What data I will be showing Most of the data will be from the 2007 Intergovernmental Panel on Climate Change (IPCC) Summary for Policymakers. Though this document does not necessarily speak for all climate scientists, it the best attempt by the scientific community to create a consensus opinion on the issue. Other data will be either from peer reviewed literature and/or presentations at professional conferences.
4 What is the problem?

5 The Importance of the Greenhouse Effect The presence of the gases in our atmosphere that absorb and emit infrared radiation help maintain the Earth s average temperature at about 59 F. What would happen to Earth without these gases?

6 Since the industrial revolution, a LOT more of the greenhouse gases have been added to the atmosphere in a relatively short amount of time.

7 Atmospheric carbon dioxide over the past 10,000 years (IPCC 2007 SPM) TODAY AT HIGHEST LEVEL IN 650,000 YEARS OTHER GREENHOUSE GASES SHOW SIMILAR TRENDS

8 MOST OF THIS ARISES FROM FOSSIL FUEL COMBUSTION AND LAND USE PRACTICES, LIKE AGRICULTURE AND DEFORESTATION.
9 Adding more greenhouse gases to the atmosphere makes the atmosphere more opaque to infrared radiation This increases the net amount of infrared radiation received at the Earth s surface, so the surface temperature increases.
10 Taken alone, a doubling of atmospheric carbon dioxide from pre-industrial levels would increase the global mean temperature by 2 C. But the climate system is VERY complex, with numerous interrelated components.

11 Complexity of the Climate System The presence of interrelated components means there are feedbacks. Feedback: An initial change in atmospheric process will tend to Reinforce it: positive feedback Weaken it: negative feedback
12 Examples of feedbacks in the climate system with global warming Positive feedback = Enhances the warming Negative feedback = Mitigates the warming IF YOU HAVE THE FOLLOWING: MORE WATER VAPOR: Positive feedback because it s a greenhouse gas. LESS SEA ICE: Positive feedback because more solar radiation is absorbed instead of reflected. MORE CLOUDS: Feedback can be positive or negative depending on the type of clouds. THIS IS STILL A BIG UNKNOWN HiGH CLOUDS: Positive feedback LOW CLOUDS: Negative feedback MORE AEROSOLS: Negative feedback because more solar radiation is reflected.

13 Greenhouse gases and Earth s temperature history In the paleoclimate record, global temperatures vary closely with greenhouse gases. Does the temperature lead or lag carbon dioxide?
14 The United States is currently the country that is the second largest contributor to greenhouse gas emissions, with about 25% of the total. Which country is the largest?
15 So what has happened to Earth s climate over the past hundred years or so, coinciding with the rapid increase in greenhouse gases?

16 Global Mean Surface Temperature (Difference from average) (IPCC 2007 SPM) Observed global mean surface temperature has increased by a little less than 1 C. Greatest rate of increase is about after Eleven of the twelve warmest years since 1850 have occurred since These results ARE FAIRLY CONSISTENT with upper-air and satellite observations, though the warming trend is not as dramatic in these data.

17 Pattern of warming is NOT spatially uniform Where is the greatest warming occurring?
")
18 Global Mean Sea Level and NH Snowcover (Difference from average) Sea level has increased by approximately cm. NH Snow cover has decreased (IPCC 2007 SPM)
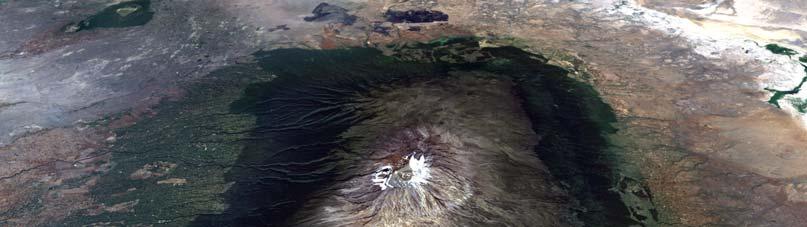
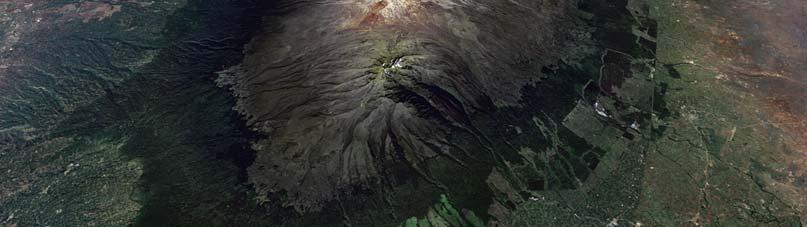
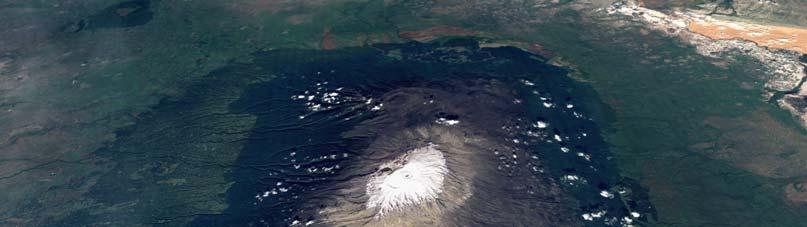
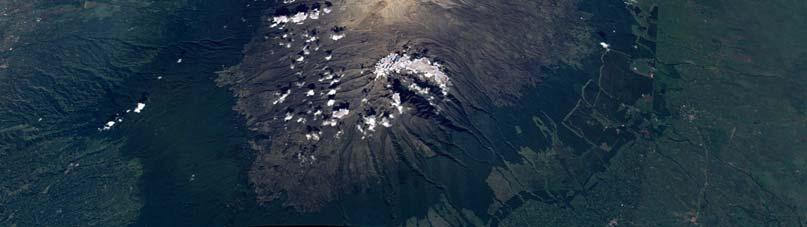
19 Kilimanjaro Snow Melt

20 Qori Kalis Glacier, Quelccaya Ice Cap, Peru between 1978 and Courtesy of L. Thompson, Byrd Polar Research Center

21 Glacier National Park 1911 and 2000

22 An ice free Arctic? City Lights from Space (From NASA)

23 Increasing Melt Area on Greenland 2002 all-time record melt area Melting up to elevation of 2000 m 16% increase from 1979 to meters thinning in 5 years Satellite-era record melt of 2002 was exceeded in Source: Waleed Abdalati, Goddard Space Flight Center

24 Antarctic Temperature Trends (NASA) Western part is warming, but the eastern part is cooling.
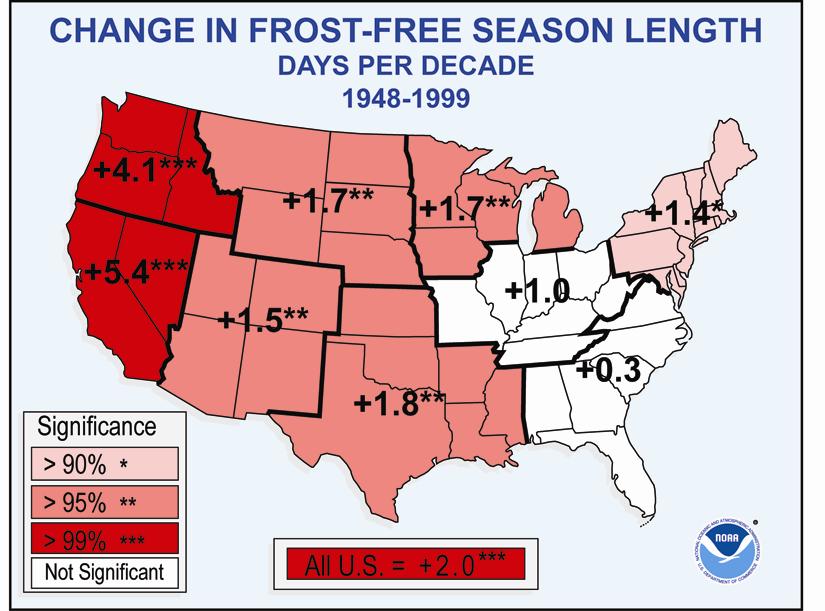
25 What about the United States? It s a good place to look because there s a lot of data there.
26 (National Climate Data Center)
27 (National Climate Data Center)

28 (National Climate Data Center)
29
30 Conclusion of 2007 IPCC It is very likely (90%) that anthropogenic activities have caused the observed warming over the past fifty years