A Survey of Drought Indices: Input, Output, and Available Data Sets
|
|
|
- Matilda Porter
- 5 years ago
- Views:
Transcription

1 A Survey of Drought Indices: Input, Output, and Available Data Sets Bisher Imam Center for Hydrometeorology and Remote Sensing, University of California, Irvine Countries: Planning and Management in Climate Change Scenarios ICTP, Trieste, Italy, April 27 through May 8, 2009


2 Aridity I I I a h m deficit = 100 demand surplus = 100 demand = I I h a AI = P PET
3 Aridity Indices: Examples Thonthwaite I I I a h m deficit = 100 demand surplus = 100 demand = I I h a for deficit months for surplus months Im Classification Im < Arid < Im < Semi-Arid < Im < 0.0 Dry Sub-humid 0.0 < Im < 20.0 Moist Sub-humid 20.0 < Im< Humid Im > Per-humid UNEP AI = P PET AI Classification Ai > 1.00 Humid 1.00 > Ai > 0.90 Moist sub-humid 0.90 > Ai > 0.65 Dry sub-humid 0.50 > Ai > 0.20 Semi-Arid 0.20 > Ai > 0.05 Arid A < 0.05 Hyperarid

4 Drought: An Early index of Drought The country has reason to make careful note of either extreme. When the water rises to only twelve cubits, it experiences the horrors of famine; when it attains thirteen, hunger is still the result; a rise of fourteen cubits is productive of gladness; a rise of fifteen sets all anxieties at rest; while an increase of sixteen is productive of unbounded transports of joy. The greatest increase known, up to the present time, is that of eighteen cubits, which took place in the time of the Emperor Claudius; the smallest rise was that of five, in the year of the battle of Pharsalia, the river by this prodigy testifying its horror Pliny the Elder, Naturalis Historia, Book V, First Century AD
")
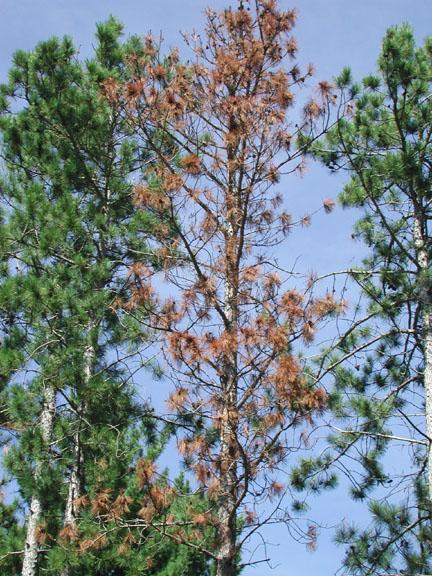
5 Some (Visible) Impacts


6 Some (Visible) Impacts 2006 apparently produced the lowest amount of rainfall in Riverside County since annual rainfall had been recorded, at just 1.93 inches. That beat out the previous low of 2.94 inches in 1883.

7 Recent Extreme Drought Conditions in the U.S. Southwest Normal Years Sever Multi-year Drought through 2004 Lake Powell, Colorado River, USA Source: J. Kane SRP 2004

8 Water Resources: (Hydrologic Drought)
9 Spatial Scale (km ) Water Resources Issues: Spatial & Temporal Scales Emissions Weather Forecasts Extended Weather Predictions Climate Outlooks SST Soil Moisture, ET Precipitation, Temperature, and Pressure Climate Variability LU/LC Change Climate Change Reservoir Reservoir Operation, Operation, Well-Field, Well-Field, Watershed Watershed Resources Resources day week month season year decade century 2 General Flood Flash Flood Sustainable Development Drought, Drought, Conjunctive Conjunctive Management, Management, Ecosystems Ecosystems Policy, Policy, and and Development Development Irrigation & Local Supplies Irrigation & Local Supplies Temporal Scale
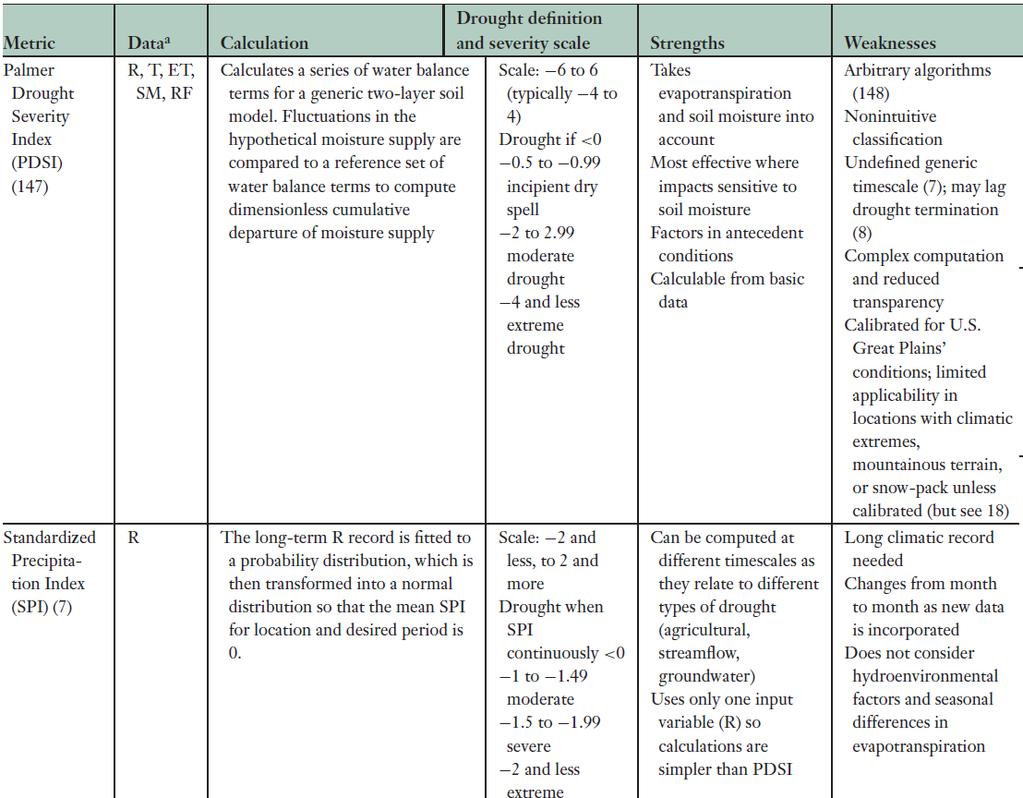
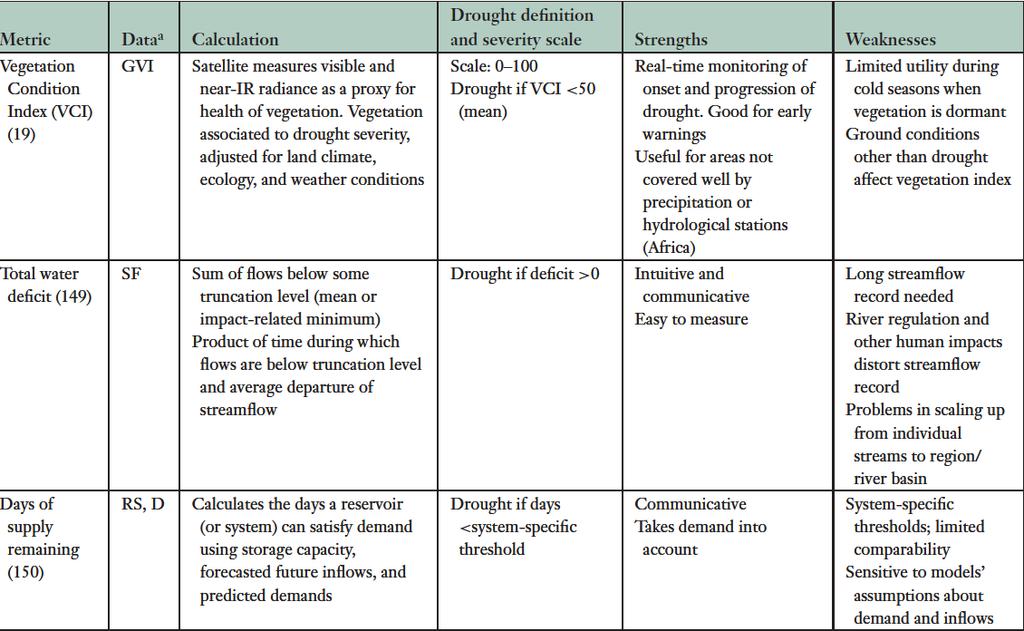
10 Drought: Definition Many Possible Definitions It is a normal and recurring feature of climate It occurs in all climatic zones Varies in characteristics from one region to another Drought originates from deficiency of precipitation over an extended period of time, usually a season or more resulting in water shortage for some activities Drought is a persistent and abnormal moisture deficiency having adverse impacts on vegetation, animals, or people Drought is a creeping disaster develops slowly and can last long difficult to quantify long lasting impacts Magnitude moisture deficit Duration Adverse Impacts


11 Drought: Temporal Scales Kurdufan, Sudan Months Seasons Years Decades Drought Index


12 Drought: Temporal Scales (Paleo-climate) Multi-decades Century?

13 Drought: Spatial Scale Regional Local Wide- Spread Sub-Regional Drought Wet Spell
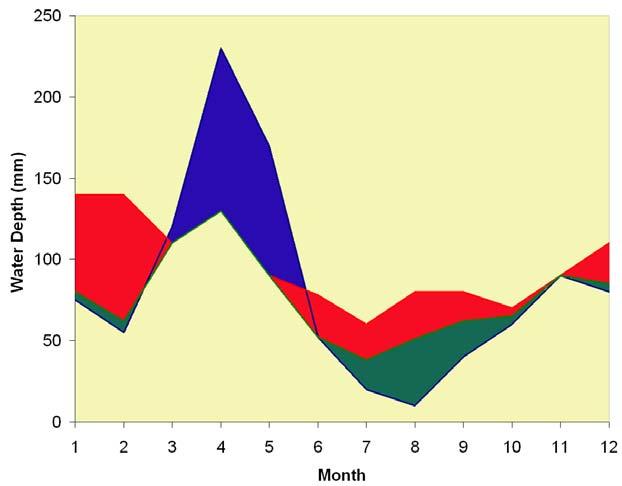
14 Monthly Water Balance P Water Depth (mm) Soil Moisture Recharge AET Moisture Deficit PET Soil Moisture Utilization 0 Oct Nov Dec Jan Feb Mar Apr May Jun Jul Aug Sep Month Changnon, 1987

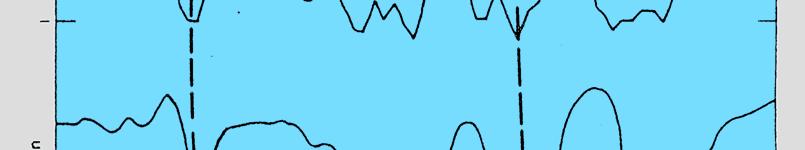
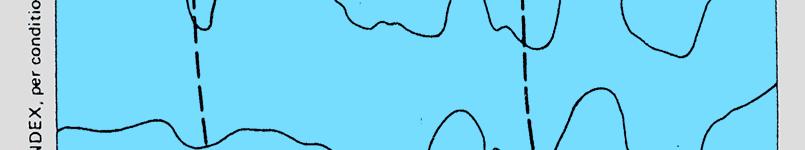


15 Precipitation Changnon, 1987 P Runoff Soil Moisture Recharge Moisture Deficit AET PET Streamflow Soil Moisture Utilization Soil Moisture Groundwater
16 Types of Droughts Natural Climate Variability Duration Precipitation deficiency (amount, intensity, timing) Reduced Infiltration, runoff, deep percolation, and ground water recharge Soil Water Deficiency High temp, wind, low relative humidity, greater sunshine, less cloud cover Increased evaporation and transpiration Plant water stress, reduced biomass and yield Meteorological Agricultural Reduced streamflow, inflow to reservoirs and lakes, shrinking wetlands, reduced wildlife habitat Hydrologic Economic Impacts Social Impacts Environmental Impacts

17 Desirable Characteristics of Drought Indices After, Redmond 1991, and 2002
18 Historical Evolution Statistical Rainy days Percent of normal Deciles Standardized Precipitation Index (SPI) In-situ data Precipitation Temperature Streamflow Reservoir Storage Deficit-based Palmer Drought Severity Index (PDSI) Crop Moisture Index (CMI) Soil Moisture Index (SMI) Models Simple Water Balance Land Surface Models (VIC) Data assimilation systems Satellite-based Composite Impact-based Vegetation Condition Index Normalized Difference Vegetation Index Maximum Snowpack Extent US-Drought Monitor Total Water Deficit Remote Sensing Snow Vegetation LS temperature Topography Reservoir Levels (Future) Impact Models

19 Comparison (Giorgos Kallis, 2008)
20 Statistical Indices: Standardized Precipitation Index (SPI) 1. Select data from Calibration Period 4. Identify N(0,1) associated with probability 3. Identify Probability value for P 2. Fit (Gamma or Weibul) to data T.B. McKee, N.J. Doesken, and J. Kleist (1992) For the selected accumulation period and duration Select data from the calibration period Fit Probability distribution (Gamma or Weibul) For the Entire Period Identify value of CDF corresponding to p Identify SPI as the N(0,1) deviate corresponding to CDF(P) 5. N(0,1) Deviate SPI for month P
21 DEMO
22 Characteristics of SPI Can be computed for any duration, generally (1,3,6,9,12,and 24) months Can account for long term precipitation deficit (9 months +) Requires long term precipitation data Best possible distribution is still subject of research Has high correlation with PDSI (at longer duration) Mean SPI for any location is 0 Applicable to station and gridded data (Satellite data)


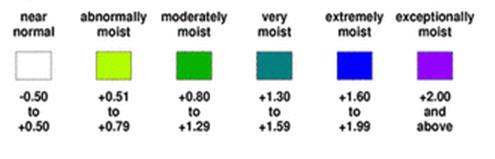
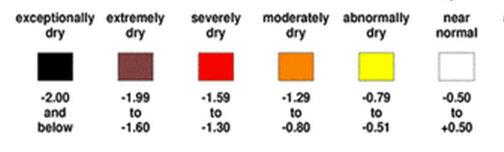
23 Available Global Monitoring of SPI SPI Values Category = 2.00 Extremely Wet 1.50 to 1.99 Severely Wet 1.00 to 1.49 Moderately Wet to 0.99 Near Normal to Moderately Dry to Severely Dry <= Extremely Dry 1, 3, 6, 9, and 12 Months Interactive tool to plot and visualize
24 Palmer Indices: brief procedure Compute monthly water budget using hydrologic accounting for a long series and Obtain coefficients Two bucket model Thornthwaite (PE) ET, Loss, Recharge, Run-Off Requires AWC in soil Determine the amount of moisture required for climatically appropriate for existing conditions (CAFEC: Normal) weather during each month. Compute the precipitation departure from CAFEC value Convert the departures to indices of moisture anomaly Palmer Z Index using K (climatic characteristic factor) Average Moisture Departure Calculate Palmer Drought Severity Index (PDSI) ant Its derivatives Duration factors
25 PDSI: Further Developments PDSI Scale Karl, 1986: PHDI (Palmer Hydrological Drought Index) Different treatment of the end of a dry spell to reflect water availability (soil moisture, runoff) as opposed to meteorological end based on weather. Heim 2005: Weakly basis calculation of PDSI Wells et. al. 2004, Self calibrating PDSI Allows for the calculation of climatic characteristic and duration factors using site specific data instead of Palmer s empirical estimates Dai, 2004: Global PDSI data set for 100+ years.
26
 Calculate Soil Moisture Index L-Moments Fit beta distribution Calculate Index L mean L CV L skew ( μ ) = λ s λ2 ( σ s /")
27 Model-Based Drought Monitoring: (E. Wood, 2006) 1) Retrospective Simulation After: E. Wood, 2006 Princeton University Forcings VIC LSM Retrospective Soil Moisture 2) Calculate Soil Moisture Index L-Moments Fit beta distribution Calculate Index L mean L CV L skew ( μ ) = λ s λ2 ( σ s / μ s ) = λ1 λ3 ( γ s ) = λ 3) Drought Analysis 2 1 Cumulative Probability Soil Moisture Historic soil moisture Realtime soil moisture Cumulative Probability Soil Moisture
 Princeton")
28 Focus on African Drought Example: VIC-based Soil Moisture Quantile (Aug, 1984) Princeton University
![Satellite Based Drought Monitoring NDVI = (NIR - VIS)/(NIR + VIS)] VHI](/docs-images/95/122577587/images/29-0.jpg "Vegetation Health Index: Estimates vegetation health (condition) based on")
 and temperature (Brightness Temperature, BT).")
/(NDVI max -NDVI min ) TCI = 100(T max - T)/(T max -T min )")

29 Satellite Based Drought Monitoring NDVI = (NIR - VIS)/(NIR + VIS)] VHI Vegetation Health Index: Estimates vegetation health (condition) based on combination of vegetation greenness (Normalized Difference Vegetation Index, NDVI) and temperature (Brightness Temperature, BT). VCI TCI - Vegetation & Temperature Condition Indices: VCI = 100(NDVI - NDVI min )/(NDVI max -NDVI min ) TCI = 100(T max - T)/(T max -T min ) Estimate moisture and thermal conditions, respectively, based on NDVI and BT. Fire Risk Index: Index showing if conditions of vegetation are suitable for fire development.
30 Example: VHI (Current)
31 Example: VCI (Current)

32 Composite Indices: US-Drought Monitor


33 Components Blend Source: Svoboda, et. al., BAMS, Aug 2002

34 Sectoral Impact Source: Svoboda, et. al., BAMS, Aug 2002
35


36 Drought Prediction and Outlook Source:
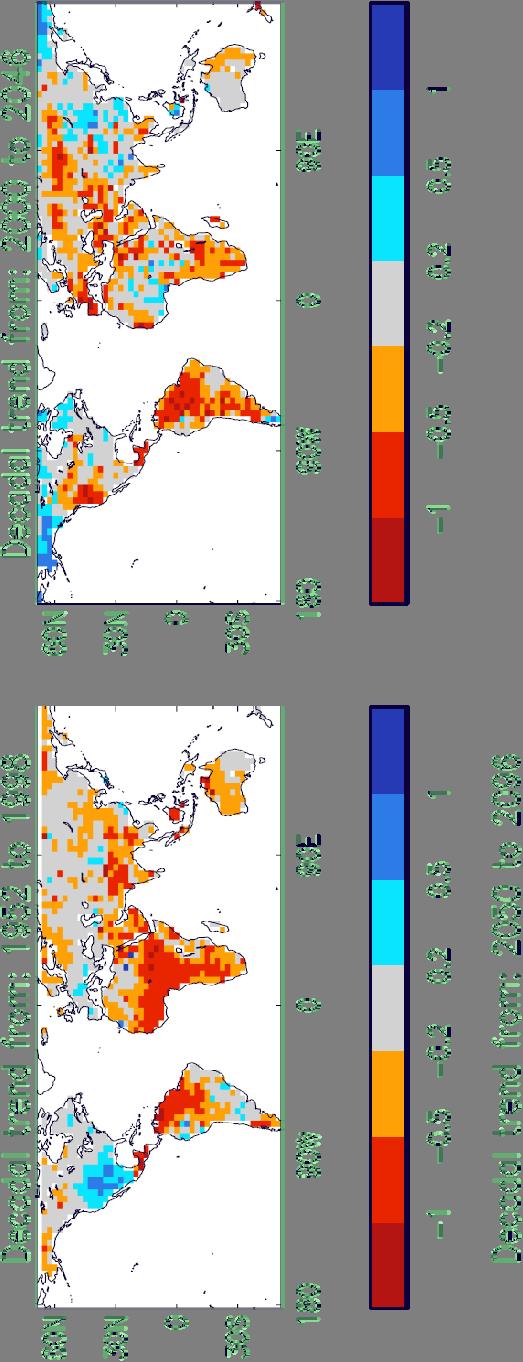
37 Climate Change and Drought GHG 0 Increased GHG Concentration leads to heating of the atmosphere Evaporation Residence Time Rain Intensity Drought Heating Water Holding Capacity Temperature Atmospheric Moisture Green House Effect Flood Higher temperature Leads to higher rates of evaporation from and evapotranspiration Leading to faster depletion of soil moisture (Drought conditions). Hotter atmosphere has a higher water holding capacity. More moisture remains in the atmosphere and the rate recycling through precipitation slows down. Increased evaporation rate leads to even higher amounts of atmospheric moisture, and water vapor, being a GHG can contribute to further heating. More vapor is available for precipitation, but at lesser frequency of events. Rainfall variability increases and the probability of extreme events may increase despite of little or no change in total annual precipitation. Water vapor is a GHG and its increase may exasperate the problem. On the earth s surface, more extreme events are likely. Snow seasons shortens and the intense precipitation causes flood. The lower frequency of rain days and increased evapotranspiration contribute to drought conditions.
 of the monthly Palmer Drought Severity Index (PDSI) for 1900 to 2002.")
38 20 th Century Spatial/Temporal Combination Wetter Than Average Drier Than Average Figure 13. The most important spatial pattern (top) of the monthly Palmer Drought Severity Index (PDSI) for 1900 to PDSI is the most commonly used drought index Red and orange areas are drier when the values in the lower panel are positive (red) and wetter during the time when the values in the lower panel are negative (red). Conversely, green and blue areas are wetter when the values in the lower panel are positive (red) and dryer when the values of the lower panel are negative (blue). Adapted from Dai et al. (2004) and IPCC 2007.
39 Potential Impacts P Water Depth (mm) Soil Moisture Recharge AET PET Moisture Deficit Soil Moisture Utilization 0 Oct Nov Dec Jan Feb Mar Apr May Jun Jul Aug Sep Month Changnon, 1987
40 Potential Impacts P Water Depth (mm) Soil Moisture Recharge AET PET Moisture Deficit Soil Moisture Utilization 0 Oct Nov Dec Jan Feb Mar Apr May Jun Jul Aug Sep Month Changnon, 1987
41

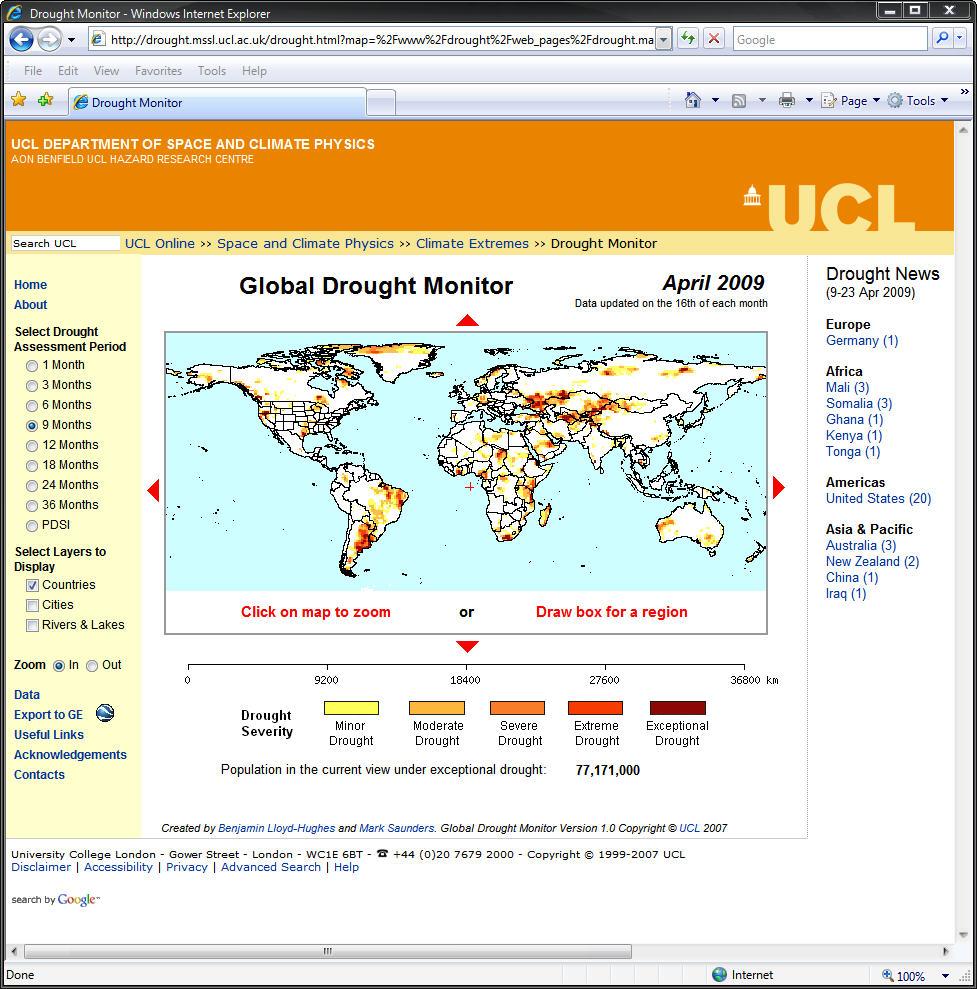
42 Global Drought Information


43 Information and Resources