Climate Change Negotiations: COP 21, Paris
|
|
|
- Reynold Simpson
- 5 years ago
- Views:
Transcription
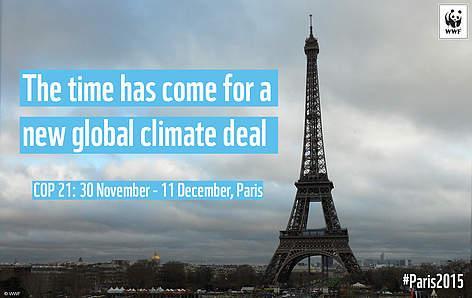
1 Climate Change Negotiations: COP 21, Paris enzo di giulio Università degli Studi di Bergamo, December 3, 2015
2 4 slides on climate change
3 CO2 concentration in the last 800,000 years
4 CO2 concentration in the last 800,000 years and to 2100 Source: IAASA

5 400 ppm: for having a similar level of concentration we must go back to Pliocene (3-5 million years ago)


6 Huge decline in the Arctic sea ice extent and tickness
7 First effects

8 Huge decline in the Arctic sea ice extent and tickness

9 Huge decline in the Arctic sea ice extent and tickness

10 Slow-Motion Collapse of West Antarctic Glaciers is Unstoppable, 2 New Studies Say (NASA, University of Washington)
11 How to reach the target?
12 How to reach the target without Flex-Mex? CO 2 = CO 2 /ENE * ENE/GDP * GDP/POP * POP, i.e.: CO 2 = CE * EG * GP * POP Which factors influence the Kaya identity coefficients? Coefficients Determinants Mitigation Policies CE = CO 2 /ENE energy mix renewables, nuclear and natural gas EG = ENE/GDP economy structure, technical effficiency, lifestyles services, dematerialisation efficient technologies, DSM energy saving, etc. GP = GDP/POP socio-economic factors GDP restraint POP culture, economy Population restraint
13 Areas of action Target: GHGs Mitigation Energy Mix: + Renewables + Nuclear + Natural Gas - Coal - Oil GDP Mitigation Energy Efficiency: + Technical efficiency + energy saving + dematerialisation Population Control Emissions Trading CDM, JI Reforestation Carbon Capture and Storage (CCS)
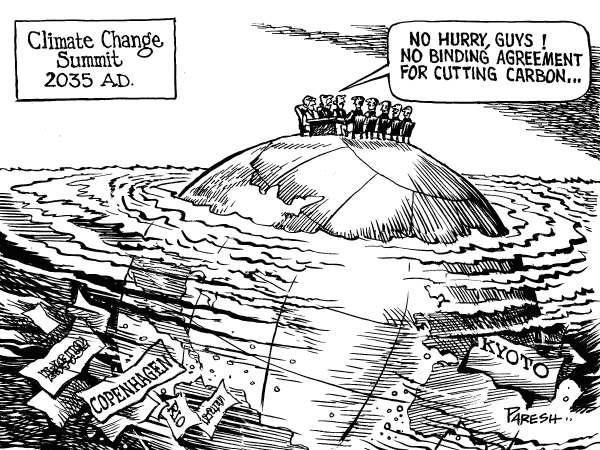
14 Are climate change negotiations working?
15 Climate and time: drawbacks Very slow negotiations Political dilemma: short run vs long run. Fighting against time Different times for different countries
16 Climate and time: progress From non legal (Rio) to legal constraint (Kyoto) Many Kyoto open issues issue resolved Progress in LULUCF and CDM New tools and markets arose
17 A key conference: Copenhagen, 2009

18 Copenhagen, COP 15: questions Which kind of agrement: Kyoto bis? Political agreement? Constraint just for DCs? USA bounded? And what about developing countries? What about compliance? How to define targets? By negotiation? Algorithms? Flat rate? Diiferentiated flat rates? Fixed or flexible targets? Absolute or relative targets? Per-capita or per-gdp Carbon? Targets to 2020 or 2050? AAUs Banking in post-2012 (8 mld t. CO2)? Souce : The Economist CDM reform: still bottom-up or sectoral approach? Which policy tools? Cap & trade or taxation? Money to developing countries? How much? The US-China link Still delay? Adaptation dominion?
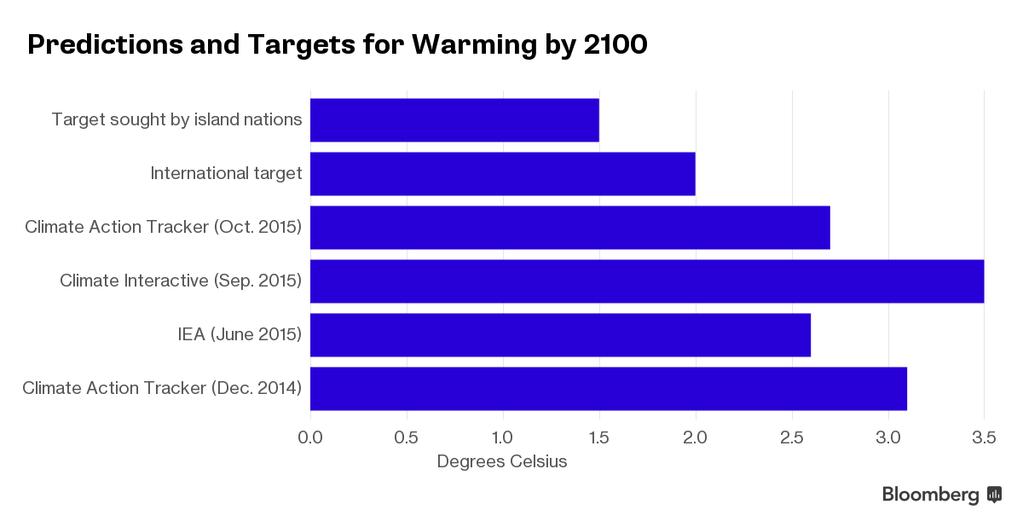
19 Copenhagen, COP 15: answers The COP plenary takes note of the agreement Temperature should be below 2 degrees Celsius Deep cuts in global emissions are required according to science Annex I: individual quantitative targets for 2020 to be submitted by 31/01/2010. Non Annex I: mitigation actions by 31/01/2010 Crucial role of REDD (reducing emission from deforestation and forest degradation) USD 30 billion for the period with balanced allocation between adaptation and mitigation. USD 100 billion dollars a year by 2020 to address the needs of developing countries.
20 Doha 2012, COP 18 Kyoto Protocol still lives since 2013 to 2020 but: within it just EU, Australia, Switzerland, Norway (15% world emissions) out Russia, Canada, Japan and New Zeland the two main emitters (USA e China) are still out (16 and 19% of world emissions) surplus of Russia, Ucraina, Polonia, Kazakstan (13 Gt CO2) tradable up to 2.5% target: at least -18% compared to by 2015, definition of strategies for cutting 8-13 Gt CO2.
21
22
23
24
25
26 Positive elements in COP 21
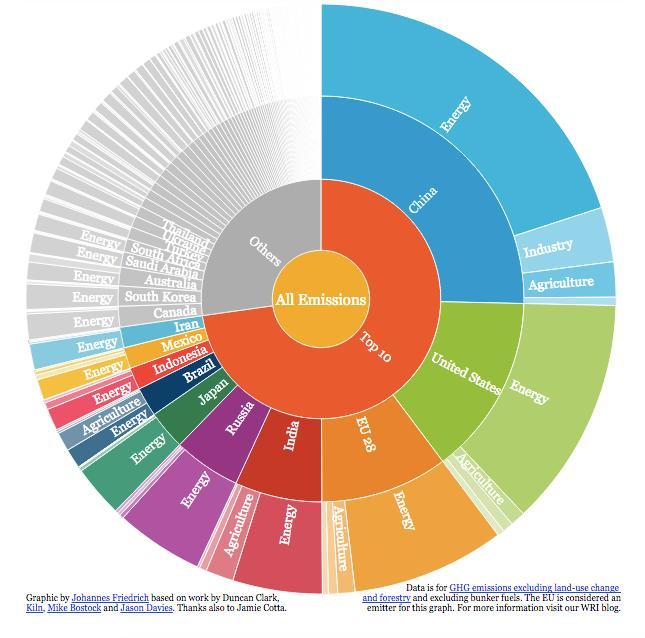
27 Positive elements in COP 21: NDICs
28 INDCs: Intended Nationally Determined Contributions Paese Target Target Year Reference China GDP carbon intensity: -60/-65% United States emissions: -26% -28% European Union emissions: almeno 40% India GDP carbon intensity: % Russia emissions: -25% -30% Japan emissions: -26% Brazil emissions: -37% oppure - 43% 2025 or Indonesia emissions: -29% 2030 Scenario BAU Mexico emissions: -22% -36% 2030 Scenario BAU Iran emissions: -4% - 12% 2030 Scenario BAU Canada emissions: - 30% South Corea emissions: - 30% 2030 Scenario BAU Australia emissions: -26% -28% Saudi Arabia emissions: Mt.CO2 year 2030 South Africa emissions: peak in , ten years plateau, then decreasing 28
29
30 30
31 Positive elements in COP 21: policies (EU)

32 European Union: Roadmap to 2050

33 European Union: 2020 and 2030 targets

34 European Union: ETS

35 European Union: Renewables

36 European Union: Energy Efficiency
37 1990 = 100% European Union: effects on decoupling GDP and GHG decoupling GDP GHG emissions
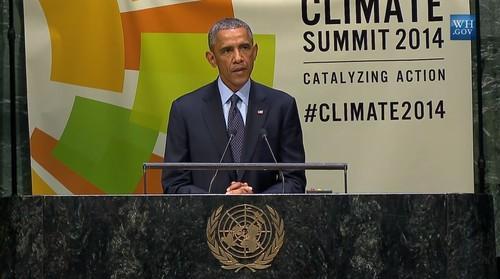
38 Positive elements in COP 21: policies (US & China)
 US-China agreement (November 11,")
 China: stop emissions increase by 2030 and renewables up")
39 USA and China Obama Climate Action Plan: -30% GHGs from power sector in 2030 (vs 2005) US-China agreement (November 11, 2014): US, -26%-28% GHGs in 2025 (vs 2005 it means -16.3% vs. 1990) China: stop emissions increase by 2030 and renewables up to 20%
40 Positive elements in COP 21: industry & society
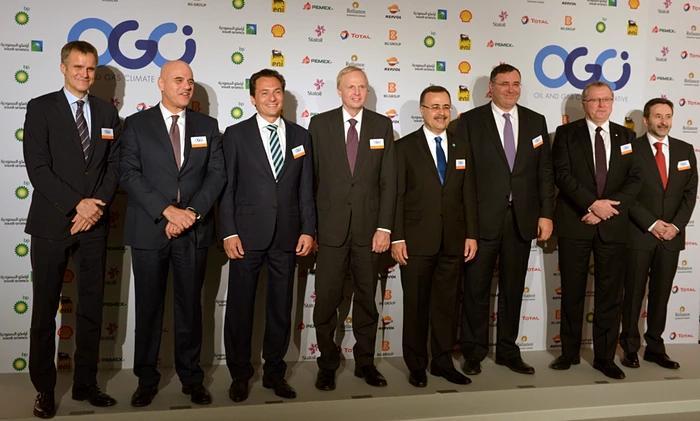

41
42 Positive elements in COP 21: policy tools

43 Positive evolution of Carbon Markets Source: WB, State and trends of carbon pricing
44 Positive evolution of Carbon Markets Source: WB, State and trends of carbon pricing
45 Positive evolution of Carbon Markets Source: WB, State and trends of carbon pricing
46 Basic negotiation in COP 21
47
48 Two triangles & two dilemmas Legally binding agreement United States Countries Participation Ambitious Targets European Union China 48
49 2 challenges for climate change
50 Challenge 1: CO2/GDP vs GDP
51 400 Mondo ( ): CO2/Pil vs Pil 350 Area OCSE ( ): CO2/Pil vs Pil co2 co2/pil pil co2 co2/pil pil We need economic growth-carbon emissions decoupling 600 Area Non-OCSE ( ): CO2/Pil vs Pil Cina ( ): CO2/Pil vs Pil co2 co2/pil pil co2 co2/pil pil
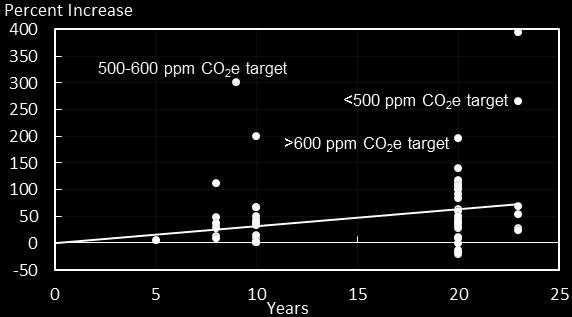
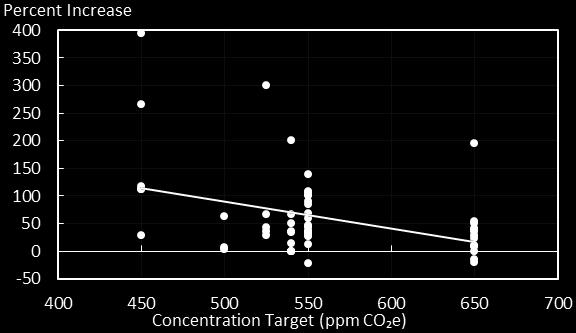
52 Obstacles to a strong agreement World Energy Outlook 2013, IEA
53 Challenge 2: rich vs emerging countries
54 Obstacles to a strong agreement World Energy Outlook 2012, IEA

55 Obstacles to a strong agreement World Energy Outlook 2013, IEA
56 Obstacles to a strong agreement World Energy Outlook 2009, IEA
57 Fighting against time

58 IEA, World Energy Outlook 2011
59 IEA, WEO 2012: GHGs required cuts

60 IEA, WEO 2012: GHGs cut options
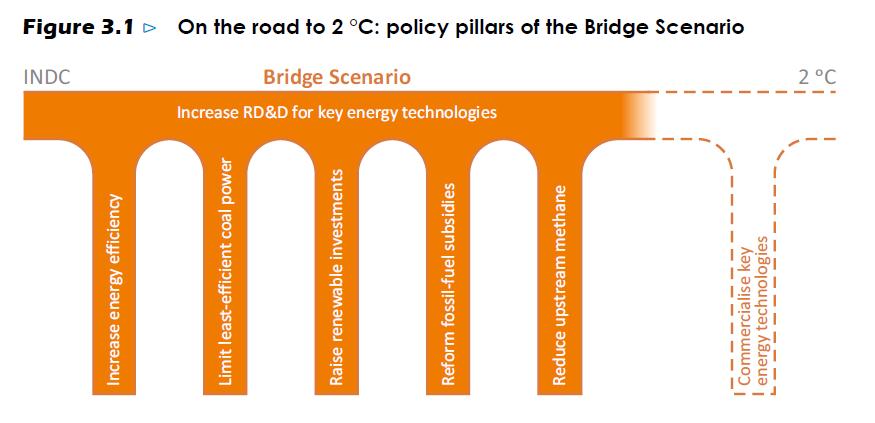
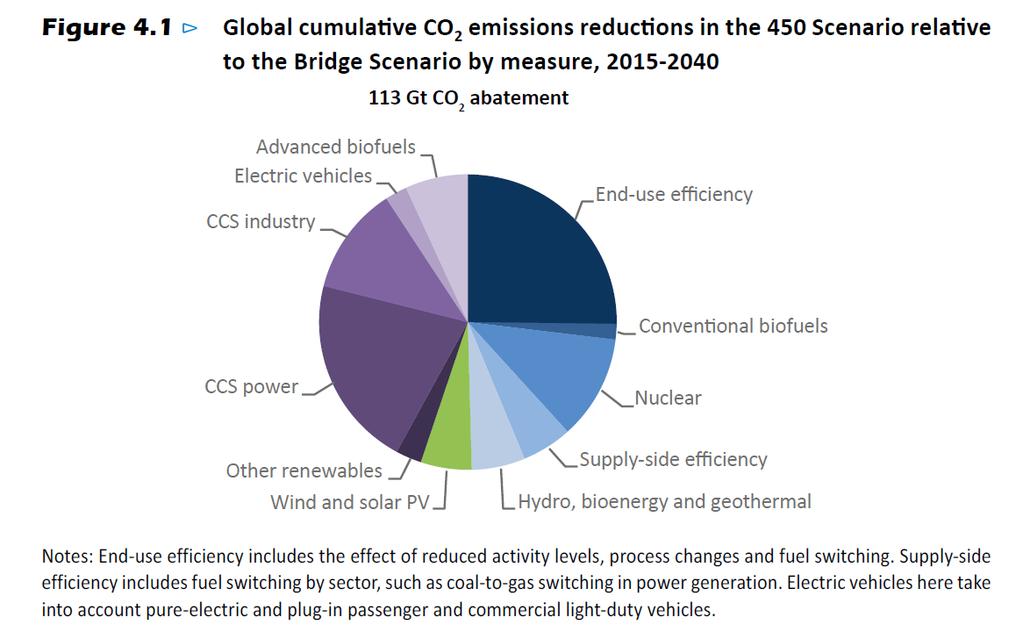
61 the bridge issue

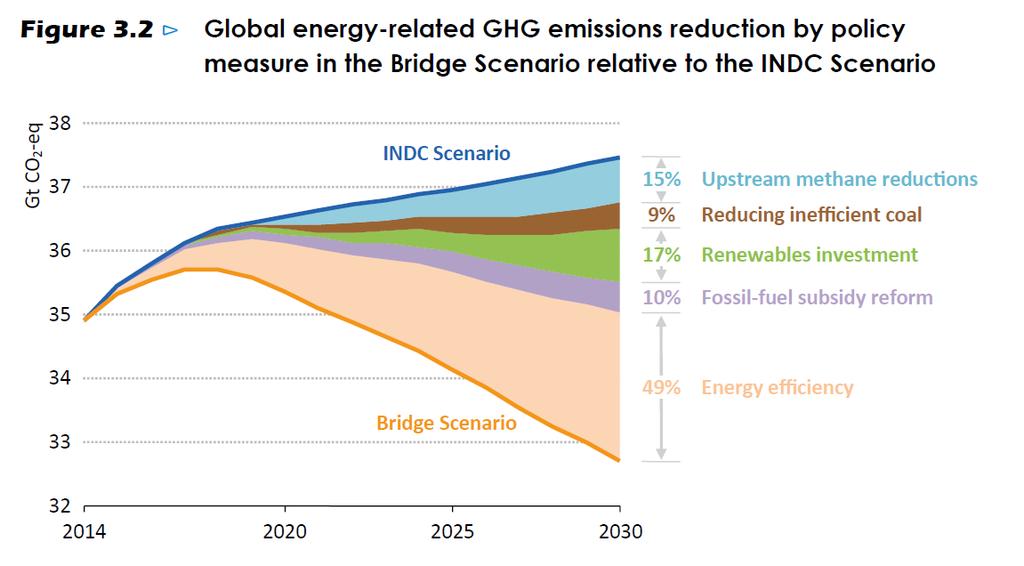
62 Energy and Climate Change, IEA
63 Energy and Climate Change, IEA
64 64
65 65

66 Energy and Climate Change, IEA

67 Energy and Climate Change, IEA
68 How much does carbon abatement cost?
69 The Stern Review 69
70 Global Abatement Cost Curve Source: McKinsey
 World Defense Expenditure: 2.")
71 IEA, WEO 2012: costs Gross Investment = 15 trillion $ (i.e. annually 0.8% World GDP since World GDP = 77 trillion $) World Defense Expenditure: 2.5% World GDP

72 Gross Investment = 38 trillion $ (i.e. annually 3,2% World GDP since World GDP = 77 trillion $) Energy and Climate Change, IEA
73 Abatement Costs in some models (Target: -40% and -80% in 2050) Source. EMF28 Median Value: 64 /t. CO2 Median Value: 521 /t. CO2
74 Abatement Costs in some models (Target: -40% and -80% in 2050) Source: EMF28 Median Value: 0.7% GDP Median Value: 3.7% GDP
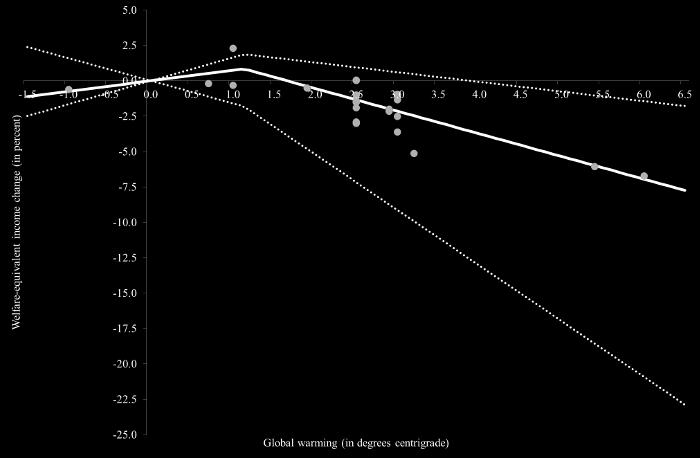
75 the discount issue


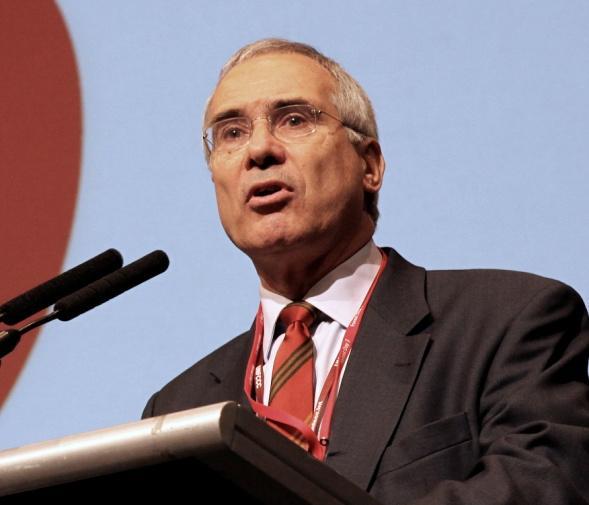
76 Vs Nicholas Stern William Nordhaus

77 STERN (1,4%) NORDHAUS (6%) Source: The ethics of climate change, by J. Broome, Scientific American, 2008

78 Logical sequence of the lesson How to cut emissions (Kaya) 4 slides on Climate Change The climate negotiations The cost issue Two challenges for climate changes The basic Negotiation in COP 21 The Copenhagen Conference Positive elements in COP 21, Paris (INDCs, Policies, Awareness)
79 background slide
80 80
81 81
82 82
83 83
84 84
85 IEA, WEO 2012: temperature increase Gross Investment = 15 trillion $ (i.e. annually 0.7% World GDP since World GDP = 84 trillion $,

86 Obstacles to a strong agreement
87 87
88 88
89 The unburnable issue

90 Source: Unburnable Carbon Are the world s financial markets carrying a carbon bubble?, carbontracker.org 90
91 91 Source: BETTER GROWTH, BETTER CLIMATE: THE NEW CLIMATE ECONOMY REPORT
92 92


93 Source: Unburnable Carbon 2013: Wasted capital and stranded assets, Carbontracker 93
94 94

95 Silicon PV module: decrease in price Layard et al 2015, The case for a Global Apollo Programme. Voxeu.org 95
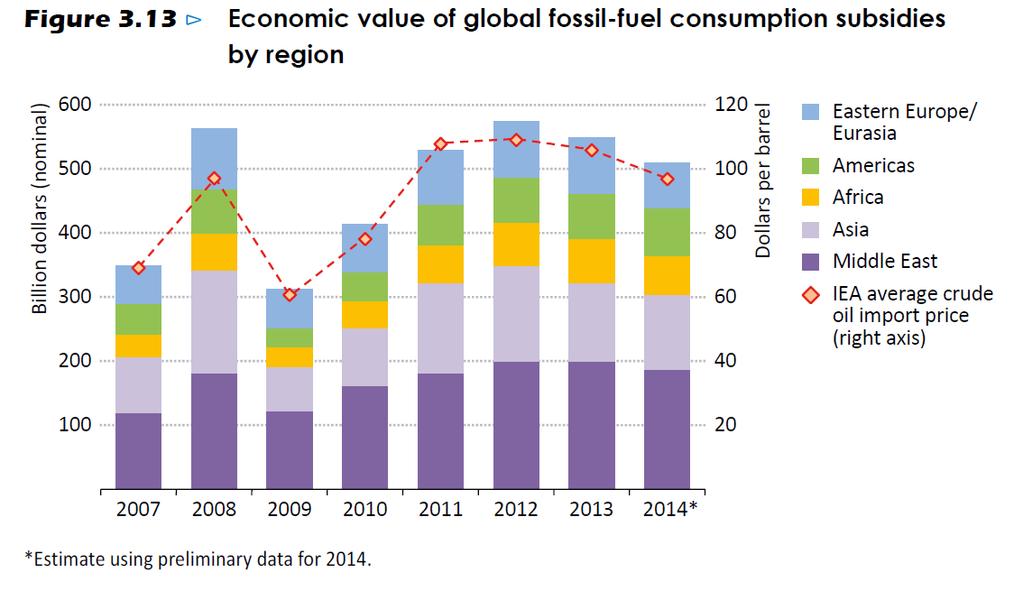
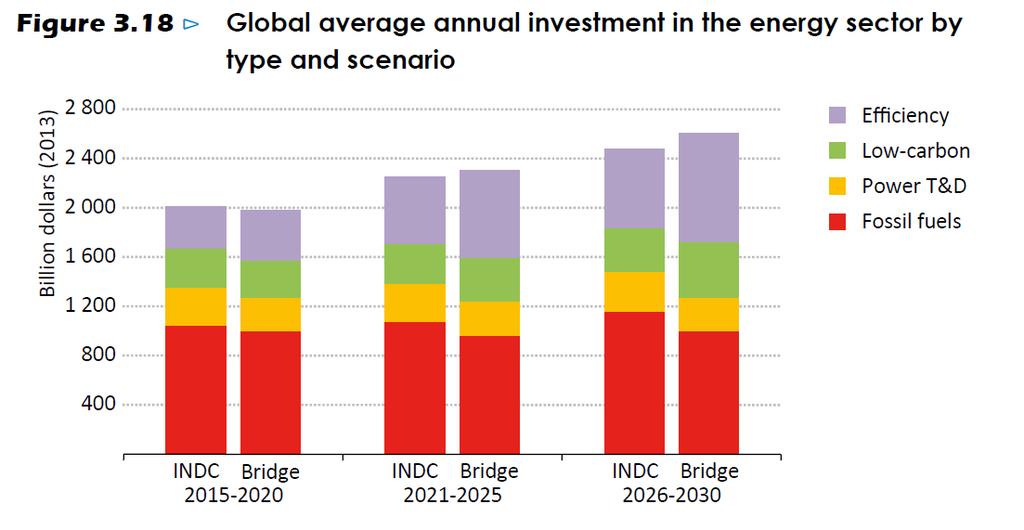
96 Energy and Climate Change, IEA
97 Energy and Climate Change, IEA