Biological Systems. primary productivity, dissolved oxygen, ecosystems and species diversity
|
|
|
- Georgia Woods
- 5 years ago
- Views:
Transcription
1 Biological Systems primary productivity, dissolved oxygen, ecosystems and species diversity

2 It is interesting to contemplate an entangled bank, clothed with many plants of many kinds, with birds singing on the bushes, with various insects flitting about, and with worms crawling through the damp earth, and to reflect that these elaborately constructed forms, so different from each other, and dependent on each other in so complex a manner, have all been produced by the laws acting around us. Charles Darwin, 1859, The Origin of Species
3 Charles Darwin is remembered mostly for his contributions to evolutionary theory, but this quote from The Origin of the Species shows that he was also a pioneering ecologist who understood the nature and complexity of the interactions among the species of organisms that live in a particular place. Purves, 2007 CH 55, pp1055


4 Ecology The study of the interaction of organisms with each other and their physical environment.
5 Ecology tries to answer 4 basic questions: How does the physical environment influence communities and ecosystems? What patterns exist in communities and ecosystems? What are the roles of history and current interactions in determining patterns? How does evolution acting on members of the community influence the species that live together?

6 abiotic factors physical aspects i.e. soil, water, weather (non-living) biotic factors the Organisms food supply vectors demographic events (living) A dynamic system of species that form a community TOGETHER WITH their physical environment.
7


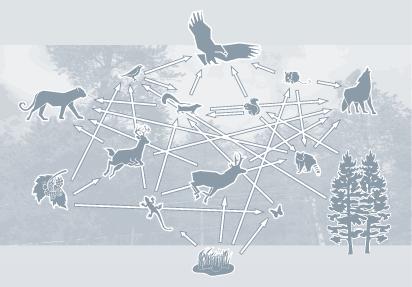
8 The Web of Life all organisms interact with the biosphere and each other

9 the Biosphere the global sum of all ecosystems The regions of the surface and atmosphere of the Earth where living organisms exist.
10 In an ecosystem, more biological energy is stored in the plants (producers) than in animals (consumers).
11 Energy transfer and transformation life on earth works because of the flow of energy and matter in communities

12 There are finite amounts of Energy and matter in every ecosystem

 on solar E")
13 Almost all ecological processes depend (directly or indirectly) on solar E input H 2 O supply

14 With few exceptions, the main Energy source for ecosystems is
15 O 2 O 2 Radient Energy Chemical Energy CO 2 HO 2 HO CO 2 2 Heat

 organic N 2 C 6 H 12 O 6")
16 Energy in a community Energy flows one way through a community heat evaporation H2 O 2 community (metabolism) organic N 2 C 6 H 12 O 6 Much is lost through HEAT
17 Energy must continually enter the community or the community will die O 2 O 2 Radient Energy 5% Chemical Energy CO 2 HO 2 HO CO 2 2 Heat all organisms depend on input of E (radiant or chemical), H 2 O & nutrients for metabolism and growth
18

19 E flow through a system secondary consumers primary consumers producers


20 map the flow of energy through a community food web who eats who


21 trophic levels 2 nd level -- herbivores (primary consumer) eat producers 1 st level -- producers
22 trophic levels 3 rd level -- carnivores (secondary consumers) eat other consumers 2 nd level -- herbivores (primary consumer)
")

23 trophic levels 4 th level -- carnivores (tertiary consumers) eat other carnivores 3 rd level -- carnivores (secondary consumers)
 2 nd level -- herbivores (primary consumer) 1 st level -- producers (including")
24 obtain E from organic wastes & dead bodies of any trophic level trophic levels 4 th level -- carnivores (tertiary consumers) 3 rd level -- carnivores (secondary consumers) 2 nd level -- herbivores (primary consumer) 1 st level -- producers (including decomposers)


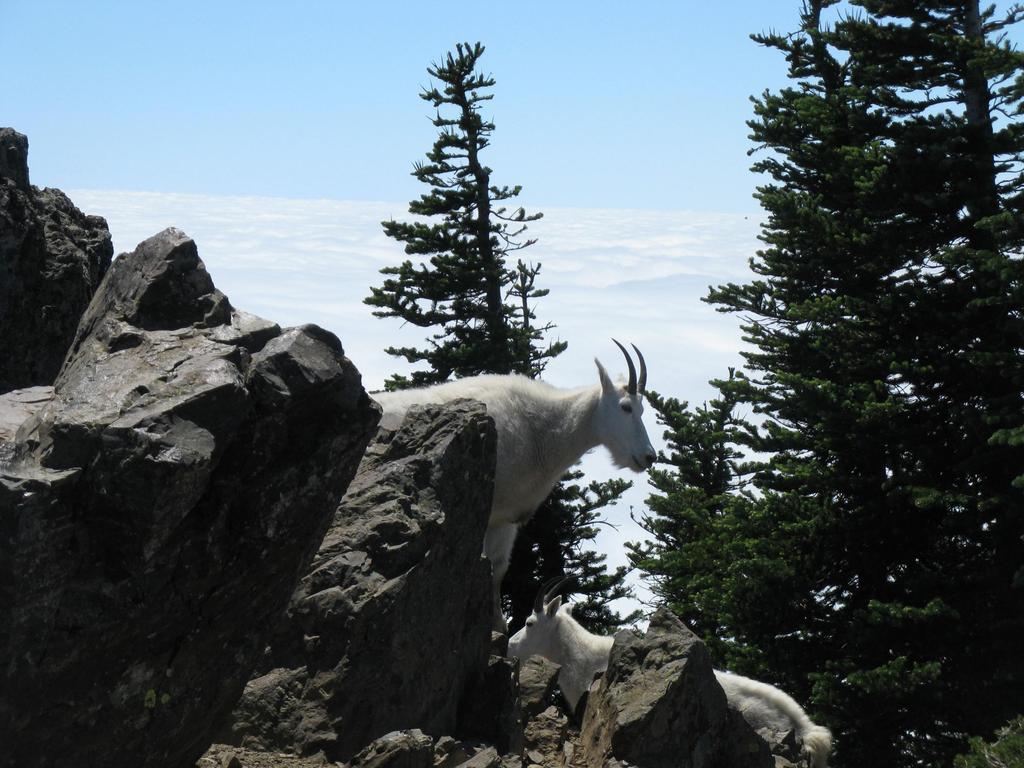
25 Food web = the food chains in a particular community/ecosystem Taiga: Boreal Forests
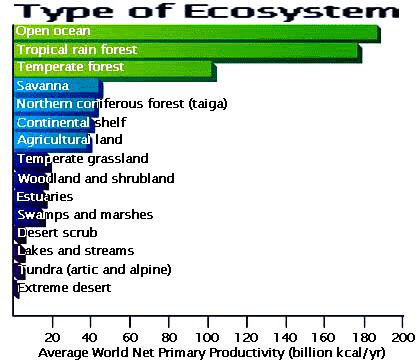
26 1 st Law of Thermodynamics: E cannot be created or destroyed only change form 2nd Law of Thermodynamics: E changes between forms is never 100% efficient Determines how many trophic levels a closed, ecological system can support.
27 pyramid of energy Every time there is a transfer of E in a trophic level, E is lost as heat.

28 The useful amount of E decreases as move up the food chain Each trophic level can only convert 10% of E consumed to available E for the next trophic level.
29

30 Gross Primary Productivity total E produced by photosynthesizing organisms E made available to consumers of the plants. Net Primary Production
31


")


32 Remember: Majority of E used by organisms on Earth originates from the sun We all rely on the autotrophs (primary producers) to manufacture complex organic molecules from simple inorganic compounds


33 Heterotrophic organisms (consumers) cannot produce their own photo-chemical Energy and need to consume the organic material in primary producers or other heterotrophic organisms to survive.


34 Gross Primary Productivity (GPP) Total amount of E that plants produce, without accounting for any losses. NPP
 CO 2 CO 2 Net Photosynthesis Whole")
 Heterotrophic Consumption Excretion Remaining Plant Biomass Assimilation NPP what is left")
35 Photosynthesis (generating GPP) is energetically expensive. heat water Gross Photosynthesis Sugars Oxygen Leaf Respiration (R) CO 2 CO 2 Net Photosynthesis Whole Plant Construction & Maintenance Respiration (R) CO 2 Net Primary Production (NPP) Dead Organic Matter (Litter) Heterotrophic Consumption Excretion Remaining Plant Biomass Assimilation NPP what is left from photosynthesis after respiratory losses.


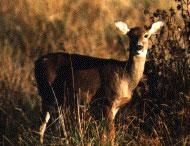
36 "All flesh is grass." - Isaiah Net primary productivity is influenced by: abiotic factors moisture & temperature Three hundred trout are needed to support one man for a year. The trout, in turn, must consume 90,000 frogs, that must consume 27 million grasshoppers that live off of 1,000 tons of grass. And therefore, influences: -- G. Tyler Miller, Jr., American Chemist (1971) Biotic factors food webs and species diversity

.")

37 The amount of NPP produced on Earth is strongly correlated with the amount of water available and temperature (very important). Tropical rain forest: 30 metric tons of NPP per hectare/year Desert: tons of NPP per hectare/year


38 net primary production is based on:
39
40 In an ecosystem, more energy is stored in plants (producers) than in animals (consumers).

41 Ecosystems with high biodiversity have greater productivity than species-poor ecosystem.

42 .. PRODUCTIVITY AND SPECIES RICHNESS ARE LINKED


43 influences species richness food web structure


44 Efficiency of E transfer in trophic levels. Energy is lost each trophic level: Heat Loss Biomass availability Indigestibility 10% energy transfer


45 Biomass supported in higher levels is limited by E available from lower levels In this way, trophic levels are limited This interdependence of the populations within a food chain helps to maintain the balance of plant and animal populations within a community.

46 10% efficiency of energy transfer
47 Rich biodiversity results in a more stable ecosystem able to better withstand disturbances.


48 What is the impact of biodiversity on a community food web?


49 The variety of different species in an area, and the variety of habitat types within a landscape.

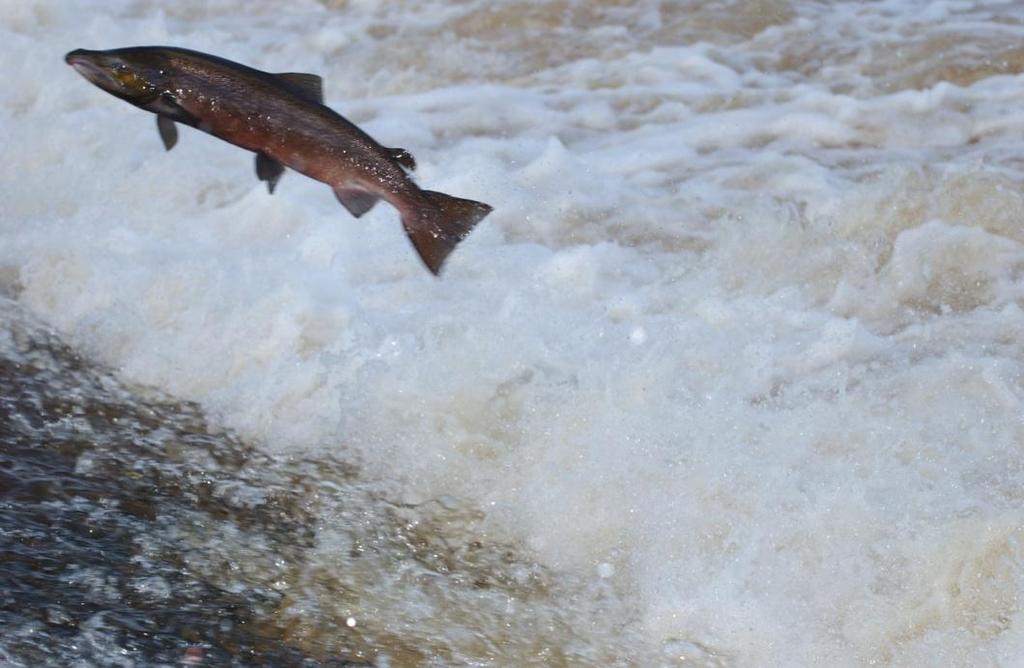


50 Grizzly bear Wild salmon Rich biodiversity results in a more stable ecosystem able to better withstand disturbances. Bald eagle White tailed deer Timber wolf


51 A change in the size of one population in a food chain will affect other populations. For example, when there are too many giraffes; there will be insufficient food for all of them to eat. Many giraffes will starve and die. Fewer giraffes means more time for the plants to grow to maturity and multiply. Fewer giraffes also means less food is available for the lions to eat and some lions will starve to death. When there are fewer lions, the giraffe population will increase.
52

53 A greater number of species results in more complete use of resources (partitioning of the resources)


54 The insurance hypothesis of biodiversity Resistance and resilience of ecosystems should increase with species richness. Some species could compensate for others under perturbations. Rich biodiversity buffers ecosystems against perturbations (stress) Example: drought in a grasslands some species would continue (increase) their productivity compensating for the loss of other niche species until recovery occurs.

55 Critters in the Water Determining water quality
56 1. How does the ecosystem s physical environment influence communities and ecosystems?
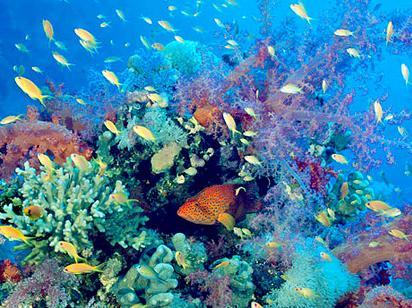


57 Primary Productivity, Diversity and the Ocean
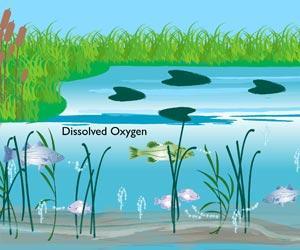
58 Availability of Oxygen
![A body of water s [DO] is critical](/docs-images/95/122592677/images/59-3.jpg "for supporting it s aquatic")
59 A body of water s [DO] is critical for supporting it s aquatic community.

 *B. Oram, Water Research Center, B.F.")
60 DO is used as an indicator of water quality. DO in streams can vary from 0-18 mg/l. (readings above 18 mg/l are physically impossible*) *B. Oram, Water Research Center, B.F. Environmental Consultants


61 DO and BOD (Biological Oxygen Demand) Biological Oxygen Demand refers to the amount of dissolved oxygen needed in a body of water by its living organisms for them to metabolize. The amount of DO needed varies by organism, life cycle, temp. of water and pollutants present.


62 5-10 mg/l necessary to support populations of fishes.

63 What factors might affect the DO level? Graph 3: This graph shows a change in the concentration of dissolved oxygen in the water of the wetlands as the temperature varies. The wetlands are an ideal place to measure because the water has had sufficient time to acclimate to the surrounding weather.

64 Provide an explanation for the results shown below. [DO] in Lake Crescent over 24 hour period. Hint: respiration DO concentration Hint: photosynthesis dawn dusk dawn

65 dissolved oxygen