Why Clean/Green Streets Could be a Game Changer in the Bay
|
|
|
- Monica Cross
- 5 years ago
- Views:
Transcription
1 Session Agenda 1. Why Clean/Green Streets Could be a Game Changer Joe Battiata, CWP 2. Prospects for Clean Streets Cecilia Lane CSN 3. Rolling On: Green Streets/Blue Streets a) Jason Papacosma, Arlington b) Charlotte Katzenmoyer, Lancaster c) Ashley Traut, Baltimore 4. Discussion: How do we move it forward?

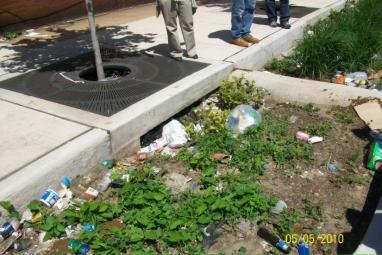
2 Why Clean/Green Streets Could be a Game Changer in the Bay

3 More miles of streets and highways than streams in Bay watershed Streets are directly connected IC and often pollutant hotspots Street and Right of Way owned and/or controlled by government States and locals maintain and rehabilitate them over time

4 Taking a Comprehensive View of Streets Which mix of strategies make the most sense to remove pollutants from our streets: Street Sweeping? Catch Basin Cleanouts? Green Street Retrofits Blue Alley Retrofits? Storm Drain Outfall Catchers?
5 Clean Streets What are the prospects for nutrient reduction by cleaning our street infrastructure? Cecilia Lane, Chesapeake Stormwater Network

6 The Dirt on Dirt Review of research on nutrient content of sediment and detritus at various locations in the urban landscape: Streets Catch basins Storm Drains BMPs Stream Floodplains


7
8 Average Nutrient Concentrations of Sediment Related to Common O & M Activities Practice Street Sweeping TP (ppm) Range TP TN (ppm) Range TN 1,000 2,500 ChesBay CBP, ,012 FL UF, 2011 Location Reference Notes 1, ,437 2,163* 648 5,145 MD DiBlasi, ,729 FL UF, 2011 Catch Basins , * 56 5,831 MD Law et al, 2008 Leaves only 637 2,769 MD MWCOG, 1993 Oil Grit ,932 3,480* ,539 MD Law et al, 2008 Sediment only BMP Sediments Outfall Net Filters ,863 2,931* ,200 Varies Schueler, ,648 FL UF, ,832 4,178 12,422 MD Law et al, ,050* FL Rushton, 2006 Leaves only ,907* 1,293 5,500 FL Rushton, 2006 Sediment only 220 1,460 MD Stack, 2012 Proposed Stream Bank Sediments MD Stack, MD MD SHA 550 1,650 PA Walters, 2012 Rural/Ag ,200 1,400-3,400 PA Land Studies, 2004 Rural/Ag , ,250 MD Stewart, 2008 AVERAGE *TKN Values
9 Key Findings Surprising consistency in nutrient content regardless of where sediments are sampled in urban landscape. Greater variability in nutrient content within individual studies Log-normal distribution: median preferred to means Vegetative detritus is also nutrient rich Most of the nutrients are organic and refractory (e.g, TKN). How much will be biologically available


10 Makes sense to STOP the sediments (& associated nutrients) from getting in there in the first place.


11 Strategies for Capturing Sediments Street Sweeping Catch Basin Cleanout Outfall Net Filters BMP Maintenance Stream Restoration

12 What Defines a Dirty Street? 2006 MS4 Survey by CWP found that street sweeping frequency is related to street land use or street type. Ex. Commercial >> Residential Aesthetics and Demand primary drivers behind sweeping i.e., streets located in highly visible areas are swept the most What other methods do we have to select the dirtiest streets?

13 Not all of our streets behave the same when it comes to traffic, runoff and pollutant loading

14 The Original Baltimore Street Sweeping Study was not able to detect a water quality difference in swept vs. un-swept streets due to monitoring design problems, but concluded that intensive sweeping could produce a modest nutrient reduction benefit CWP (2008) Catchment F Catchment O
15 Cleaning is Cost-Effective Annual cost to remove equivalent annual TN load is very cost-effective in comparison to other BMPs Practice Type of practice Equivalent Annual cost Source & Notes Street sweeping Non-structural $1,980 Berretta et al 2011 CSN is conducting new sweeping cost survey next month to get better estimates We need your help to get the best data!
 Can be grouped for specific times (i.e., Spring and Fall) Reductions based on sweeping technology: Mechanical << Regenerative/Vacuum")
16 Street Sweeping Expert Panel completed in March 2011 Existing CBP-approved credit Qualifying Conditions: Urban street with high average daily traffic volume located in commercial, industrial, central business, high intensity residential Minimum frequency of 26 times a year (every 2 weeks) Can be grouped for specific times (i.e., Spring and Fall) Reductions based on sweeping technology: Mechanical << Regenerative/Vacuum
17 Two Methods 1. Mass Loading Approach* ( ) Mass of street dirt collected is measured in tons at the point of disposal. Multiplied by factors to determine nutrient reduction credits. 2. Qualifying Street Lanes Method Localities report the number of qualifying lane miles they have swept. Determine the baseline nutrient load using the Simple Method. Multiplied by pick-up factors to determine nutrient load reduction. Better credit with Method 1??

18 Street Sweeping Example 1 The Mass Loading Approach MD Community wants to take credit for their street sweeping program. They have a regenerative street sweeper with a hopper capacity of 2 tons. On average they have collected a wet mass of 1.5 tons over the course of the year.
19 Street Sweeping Mass Loading Approach 1. Convert tons of wet mass into lbs and convert to dry weight: 1.5*2000 = 3000 lbs of street solids (wet) 3000*0.7 = 2100 lbs of street solids (dry) 2. Derive nutrient reductions: 2100* = 5.25 lbs of TN 2100 * = 2.1 lbs of TP 3. Compute TSS Reduction: 2100*0.3 = 630 lbs of TSS
20 Qualifying Street Lanes Method Convert qualifying lane miles into total impervious cover (acres): Miles swept feet swept multiplied by lane width (feet) divide by 43,560 = acres of street swept Multiply acres swept by pre-sweeping annual load (simple method): TP = 2.0 lbs/impervious acre/year TN = 15.4 lbs/impervious acre/year

21 Qualifying Street Lanes Method Multiple pre-sweep baseline load by pick-up factors: Multipliers to Reflect Effect of Street Sweeping on the Baseline Load 1 Technology TP TN Mechanical Regenerative/Vacuum CSN 2011
22 Street Sweeping Example Qualifying Street Lanes Method Over the past year, local MD community has swept the streets 26 times, with a regenerative street sweeper. The community swept 25 lane miles which included both sides of the street. This is converted to an area: Both sides of the street were swept, so an average width of 20 feet could be used. The lane miles were converted to feet and multiplied the 20 width, and then divided by 43,560 to get the total acres of street swept in the past year = acres.
23 Qualifying Street Lanes Example cont. Multiplying the impervious acreage swept (60.61 acres) by the pre-sweeping annual pollutant load, the community was able to determine their baseline load: Baseline Load Phosphorus (60.61 ac)(2.0 lbs/ac/yr) = lbs/yr Nitrogen (60.61 ac)(15.4 lbs/ac/yr) = lbs/yr
24 Qualifying Street Lanes Example cont. The MD Community then multiplied the baseline load by the Regenerative Technology factors to get load reductions based on their program: Pollutant Removal Loads TP lbs/yr*0.06 = 7.27 lbs/yr TN lbs/yr*0.05 = lbs/yr
25 Early Findings Most jurisdictions will get more nutrient reduction credit for Method 1 compared to Method 2 Some communities are reporting all their sweeping activity, and not just the sweeping that meets qualifying conditions Reporting and verification protocols were never recommended by expert panel


26 Implementation difficulties for localities Trouble getting to the curb On street parking What to do in inclement weather or winter months?
 Should credits be provided for streets that are swept less frequently?")
27 Key Street Cleaning Issues Sweeper technology continues to evolve and improve Need better tools to identify the dirtiest streets Need for better local reporting, tracking and verification protocols (USWG) Should credits be provided for streets that are swept less frequently? Locals are struggling to develop more water quality based street cleaning programs

28 Catch Basin Cleanout Programs? CWP study found that catch basins were rarely cleaned out to prevent flooding and/or in response to residential complaints. Has been mentioned at USWG as a potential future expert panel, although existing credit for quarterly cleanouts.


29 What s Next? CSN Street Sweeping Webcast in August 2012 Need to reconvene an expert panel to look at all of the street cleaning options (including catch basin cleanouts and net filters)?
30 Questions for Discussion What methods could we use to identify the dirtiest streets? Should we look at culvert clean-out credit? Would the sediments we pick up have really ever reached the Bay? What research or management improvements do we need to perfect the practice?
31
32 Green Streets and Blue Alleys INSERT the PANELISTS PREZ HERE
33 Clean Streets/Green Streets Arlington, VA May 24, 2012 Chesapeake Stormwater Retreat


34 Arlington Watershed Facts 2010 Census: 207,627 people Phase I jurisdiction 26 square miles 7,972 persons/square mile 41% impervious cover 334 miles of storm sewers 28.5 miles of perennial streams Potomac River watershed

35 Green streets challenges Utilities Utilities Parking Limited space Inflow energy Small drainage areas Plant establishment Community acceptance Patrick Henry Drive and 9 th Rd N

36 Green streets opportunities Plants will grow More than a filter: Stormwater volume Aesthetics Habitat Traffic calming Urban heat island Patrick Henry Drive and 9 th Rd N Visible reminder of our stormwater impacts Visible part of the solution

37 Create a plan think long term Contract with Center for Watershed Protection for retrofit inventory of all watersheds Screening and ranking criteria ~1,000 projects identified to date 2 built Many in design CIP funding for long-term implementation
38 Be opportunistic and create partnerships Master Transportation Plan Includes policy goal to reduce stormwater runoff from street network Green Streets facilities a key implementation tool to achieve this goal Neighborhood Conservation Program Local street/pedestrian improvement projects Major opportunity to partner Budget for long-term maintenance


39 Contact info: Phone: (703) Web: Residents Environment N Albemarle St Watershed Management


40 Piloting Blue Alleys in Baltimore Ashley Traut Blue Water Baltimore Nick Lindow, P.E. Biohabitats Greg Hoffmann, P.E. Center for Watershed Protection

41 Background Opportunity knocks 450 miles of alleys 75% impervious downtown Team approach Cooperation of the City Interest from funders Learning from others City DOT, DPW, Blue Water Baltimore, Center for Watershed Protection, and Biohabitats inspect a potential bumpout location in Butchers Hill
42 The Magic Bullet? Site BH-A-1 Practice Type Area (sf) Practice Area (sf) WQv (cf) WQv Treated (%) Permeable Pavement 41,818 3,600 2,997 42% BH-B-1 Bumpout 7, % BH-B-1 Enhanced Tree Pit 5, % BH-B-3 Bumpout 10, % BH-B-8 Bumpout 68, ,932 24% PP-A-1 Permeable Pavement 54,450 3,350 3,902 30% PP-A-3 Permeable Pavement 61,420 3,730 4,402 30% PP-B-2 Bumpout 11, % Combined, retrofits will treat 260k sq ft (6.0 acres): Annual runoff treated = 816k cf 6.5 lbs/yr TP and 32.2 lbs/yr TN
43 Reality Check Total project cost (budgeted): $1.2 million 4.6:1 ratio, potential to viable sites Consider slope, utilities, drainage area, closest inlet, private property conflicts, available space for BMP Learning curve Community push back


44 Lessons Learned (so far) 1. Avoid tunnel vision


45 Lessons Learned (so far) 2. The more partners the better sort of


46 Lessons Learned (so far) 3. Don t reinvent the wheel


47 Lessons Learned (so far) 4. Don t just inform; engage
 5.")
48 Lessons Learned (so far) 5. Prove it
49 Discussion What are some practical ideas/actions that we should take in the Bay in the next few years to get more pollutant reduction out of our existing and future street networks?