Funded by: European Eur Union 1
|
|
|
- Gregory Quinn
- 5 years ago
- Views:
Transcription
1 1
2 Enhancing Institutional Capacity for the Market Development of Decentralised Energy Systems in Thailand DE Best Practice Sridhar Samudrala Director ASIA World Alliance for Decentralized Energy (WADE) WADE DE Modelling Training Workshop 5 th March 2010 MA DU ZI Hotel, Team Room 2
3 Decentralised Energy: DE Best Practice What is Decentralized Energy in this context Drivers Successful countries in the DE Cases WADE Model sample: Nigeria, China 3
4 What is Decentralized Energy? Decentralized Energy is the high efficiency production of electricity y( (and heating/cooling gwhere possible) near the point of use and energy source(s), irrespective of size or technology. Fuels -- Gas, Wind, Solar, Biomass, Hydro and/or coal. 4
5 DE as a Share of Total National Power Generation World Average is 9% - Where is Thailand? Source: IEA, CHP: Evaluating the Benefits of Greater Global Investment (2008). 5
6 Drivers for DE Development 1. Plant Siting and Permitting 2. Policy needed 3. Interconnection Standards from Utilities 4. Electric Rates Feed in Tariffs 5. Utility Restructuring Gen/Trans/Dist?? 6. Market Design(s) Allowed to sell at market price?? 6
7 Why Cogeneration/Trigeneration Energy Cost Savings Security of Supply Environmental protection Flexibility of operations Energy costs can be a high proportion of the product cost tin many industries. ti Cogeneration/trigeneration /ti can reduce the energy costs by up to 40%. Cogeneration/trigeneration can increase the reliability of power supply. Production processes need to avoid unscheduled shutdown. The high overall thermal efficiency of cogeneration/ trigeneration minimizes the production of carbon dioxide. Other exhaust emissions can be controlled by the use of low emission combustion technology. Optimize your operation, dependent on fuel and electricity prices, factory power and heat load. 7


 Natural")


8 Trigeneration System Overall Plant Efficiency >80% Chilled Water for Process (15 C) Natural Gas Absorption Chiller Gas Turbine Steam 10 Tonnes/hr Heat Recovery Boiler Electricity for Captive use 3,500 kw Heat Exchanger Hot water for Process 8
9 What is Possible for a Country Source: Danish Energy Center 9
10 Denmark Policy PAST No legislation for energy security environment (hit by first/second oil crises: in 1973,imported 88.7% of the Energy) PAST 1976 Plan to promote DH/CHP. Put into practice as of 1979 PRESENT - DE/CHP and renewable energy to be given priority in dispatching PRESENT Full liberalisation of the Danish power industry Past -- customers of 10 GWh per year eligible to choose their electricity supplier in the free market. 2003, all consumers are eligible. PAST - All Utilities bundled -- PRESENT (generation, transmission and distribution unbundled) RESULT of Policies DE operators, CHP plants benefitted -- customers had obligation to buy local energy. Sent right signals - Gave confidence -- ensured long-term revenues, encouraged investment, energy sold at market rates Biomass/biogas CHP plants (those originally mainly generating only electricity) receive a premium which is paid by all consumers. Increased DE use and local power production and utilization by over 60 % - This meant more business to manufacturers, suppliers and service providers of DE equipment and the local l players. 10


11 Germany CHP/DHC Scorecard 4 Stars 11
12 Key Drivers German Policy Existing non-operational cogeneration plants can be brought back into use Funding for bio-fuels National policy introduced Incentives for municipal cogeneration and sub 2 MWe cogeneration Tax holidays and financial incentives for sale of power Guarantees minimum prices for feeding renewable energy into the grid over a 20- year period building code targets reduction of primary energy use Attractive feed in Tariff, particularly for biogas CHP, modernization of existing plants Exemption from Ecotax for NG and heating oil used for DE/CHP CHP/DHC is recognised in Renewable Heat Law Key Barriers The major generating companies have been consolidated and continue to hold considerable power, discouraging growth in cogeneration and DE Vertically integrated companies Low wholesale electricity prices over the last few years Perceived grid stabilization issues due to increasing DE grid-connection no standards and control mechanisms 12
13 WADE DE Model INPUT OUTPUT MODEL METHODOLOGY USED INPUT : Capacity Data collection & Generation Pollution level Cost Growth Properties OUTPUT : - Existing capacity & generation - Load factor - Pollution level (NOx, SOx, PM10, CO2) - Heat rate -Investment cost -O&M cost -Fuel cost - System growth properties Data input into WADE s economic model Scenario development Sensitivity analysis Model run - Capacity p y retirement Total capital cost - Future generation Retail cost Fuel used Emission level Comparison & analysis Recommendations 13
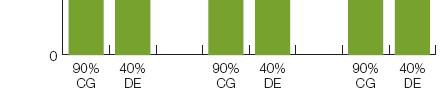
14 Applying the WADE Economic Model to Nigeria Scenario Development ALTERNATIVE ENERGY SCENARIOS Reference scenario Env concern scenario Security of Supply There is high The future technology Increase share of RE scenario distribution is based on (small hydro, biomass, Ensure penetration security of of supply. DE Nigerian power PV) and clean coal Increase system coal share to the and development plan technology enter the commissioning electricity of market nuclear 2020 framework power plant The variation mix of 90% CG/10 %DE CG Case, and 60% CG/40 %DE DE case was applied in all the different scenarios. 14
15 Sensitivity Analysis Scenario The following scenarios were compared to reference scenario Case A: Low electricity demand growth scenario Concerning a great need of a national program on Demand Side Management (DSM). lower demand growth of 2.5% was applied in Case A while 3.1% in reference scenario Case B: High natural gas price scenario Examines the sensitivity involved if the natural gas price in Nigeria is to be equal to the international gas price which is 4 US$/mscf. Substantial subsidy reduction from the government Case C: Low heat rate of fossil fuel-fired DE This scenario examines the heat rate of fossil fuel-fired fired DE applications and evaluates the impact on the output by assuming that a DE-fired plant could achieve high overall efficiency, translating to a heat rate of 6,000 kj/kwh 15


16 Model Output Electricity Supply in Nigeria by scenario Total power generation CG case : 82,436 GWh DE case : 64,023 GWh The DE case reduced total capacity of 3% by2020 and increased to 5%. The reduction in principal comes from high energy utilization through DE for example through the reduction of network losses. 16


17 Model Output (cont d) Capital cost 2028 Retail cost


18 Model Output (cont d) Fuel used 2028 Emission level
19 Summary of Main Findings Decentralized energy will deliver significant benefits to Nigeria s economic and environmental sectors. saving above US$2.7 billion, or a 19-20% reduction in capital costs by 2028, compared dto CG. Result ltfrom reduced dinvestment tin transmission i lines. Nevertheless, approximately US$1.43 billion must be invested in each DE case. Among the three scenarios, the Reference scenario -- lowest capital costs Security of Supply scenario -- highest capital costs s as a result of commissioning o a nuclear plant DE -- lower retail cost compared to the CG case (17-18% 18% reduction) -- Environmental Concern scenario - lowest retail cost - reduced fuel costs due to a high renewable energy share. 19
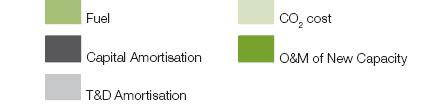
20 Example: Capital Costs in China 2,000 1,800 $ for New Capacity Billion US 1,600 1,400 1,200 1, % Central / 75% / 25% 50% / 50% 25% / 75% 0% Central / 0% DE % DE of Total Generation 100% DE Inv. In New Cent. Gen. Inv. in new DE Inv. In T&D 20
21 Example Sensitivity Analysis for China Model Run Billion US$ for New Capacit ty in Central DE Central DE Central DE Central DE Central DE Central DE Central DE Reference case 3% (low) demand growth high coal capacity high gas capacity T&D cost +1/3 High nuclear and renewables capacity Scenario 8% (high) demand growth Investment in new Central Generation Investment in new DE Investment in T&D 21

22 THANK YOU Director - ASIA World Alliance for Decentralized Energy (WADE) 22