Energy Audit Summary Report. Manufacture of cosmetics
|
|
|
- Isabella Goodwin
- 5 years ago
- Views:
Transcription
 / Barcelona (Spain) December 2011 With the collaboration of the Chamber of Commerce and Industry (CII) de la Drôme This energy audit has been carried out with cofunding of the")
1 Energy Audit Summary Report Audit No FR03 Manufacture of cosmetics energyxperts.net Berlin (Germany) / Barcelona (Spain) December 2011 With the collaboration of the Chamber of Commerce and Industry (CII) de la Drôme This energy audit has been carried out with cofunding of the European Commission (EACI) in the Framework of the EU funded project EINSTEIN-II (ProjectNo. IEE/09/702/SI ) 1
2 1. Contact data of the auditors Cristina Ricart, Hans Schweiger energyxperts.net, Barcelona (Spain) - Berlin (Germany) info@energyxperts.net 2
 2.1. General information of the company Sector Products Yearly production No.")
![of employees 75 Current final energy consumption [MWh] (*) Cosmetics Cosmetics 57,7 tons total for heating and cooling](/docs-images/95/122774286/images/3-3.jpg "- natural gas 151 151 - electricity 209 45 (*) fuel consumption in terms of MWh lower calorific value (LCV) (a) (b)")
3 2. Description of the company (status quo) Reference year of data/information: 2010 (Date of the visit on site: ) 2.1. General information of the company Sector Products Yearly production No. of employees 75 Current final energy consumption [MWh] (*) Cosmetics Cosmetics 57,7 tons total for heating and cooling - natural gas electricity (*) fuel consumption in terms of MWh lower calorific value (LCV) (a) (b) Figure 1. (a) Production (b) Storage 3
4 2.2. Description of the company a) Productive process The company receives the cosmetic components and processes them to produce the different cosmetic products. The products can be divided into different groups: emulsions (about 1/3 oil, 2/3 water), gels (2/3 oil, 1/3 water) and fats (3/3 oil). Water is pretreated in an osmosis tank. Different products are mixed according to the receipt. They are heated up to temperatures between 40 and 85ºC and they are maintained at particular temperatures during some time. At the end, the mixture is cooled down to ambient temperature. Furthermore, hot water is required for different activities: Water for sanitary uses (55ºC), water from osmosis to clean small materials and water from osmosis to clean the Dumek (an electrical reactor). The different areas of the building are heated in winter and cooled in summer. The target temperature is 22ºC the whole year. There is a small cold chamber at 4ºC to store some products. Material inputs Material outputs Oil Heating Fats Mix and heat Cooling Mixture Fats, gels, emulsions,... Water Water for cleaning Heating water Space heating Space cooling Cold chamber heating process cooling process Figure 2. Simplified production flow sheet The most heat consuming processes in the company are the production of hot water for sanitary uses and space heating. The most cold consuming process is space cooling for the atéliers. 4
5 b) Energy supply system Processes are heated up electrically in two reactors: dumek for water and mixtures and fondoirs for oil. Water to clean small materials is heated electrically in the Ballon. Water to clean the Dumek is generated in another electrical boiler. Water at 55ºC for domestic uses (kitchen, cleaning) etc. is generated in a natural gas fired hot water boiler. Hot water at 65ºC for space heating is generated in the same hot water boiler mentioned above. Cold water at 7ºC for space cooling is produced in an electrical chiller. The area Bureau récreation is heated and cooled by an electrically driven heat pump. The cold storage is cooled by a separated chiller. An additional small chiller is furthermore used to cool the processes with a water-glycol circuit at 7ºC. 5


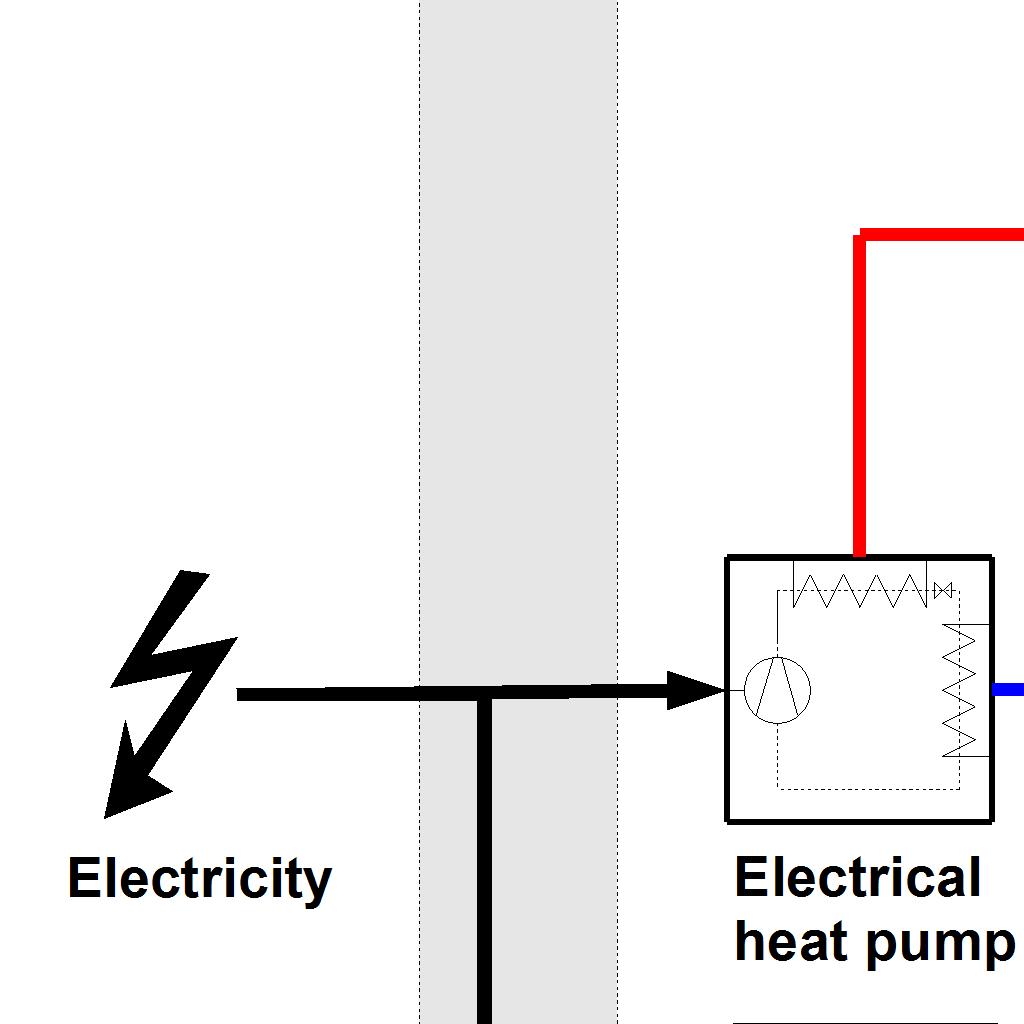
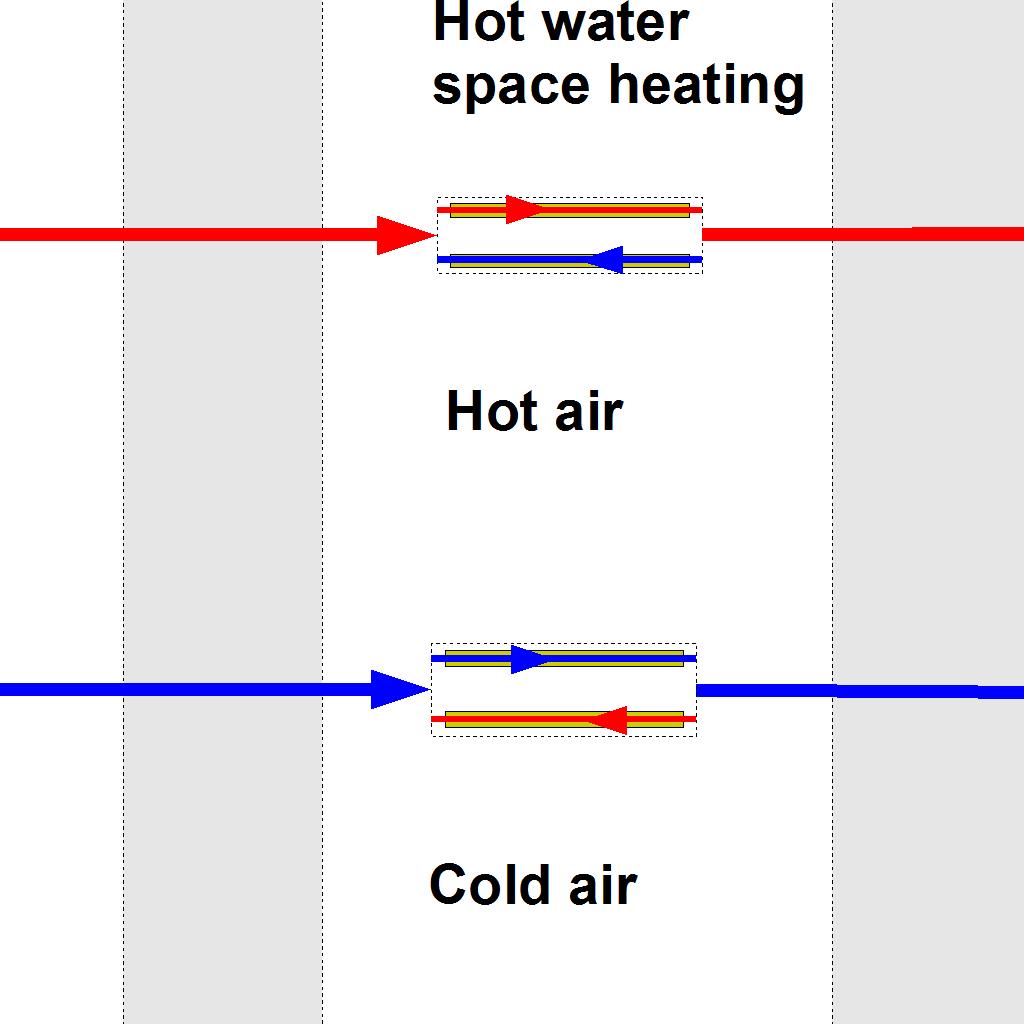
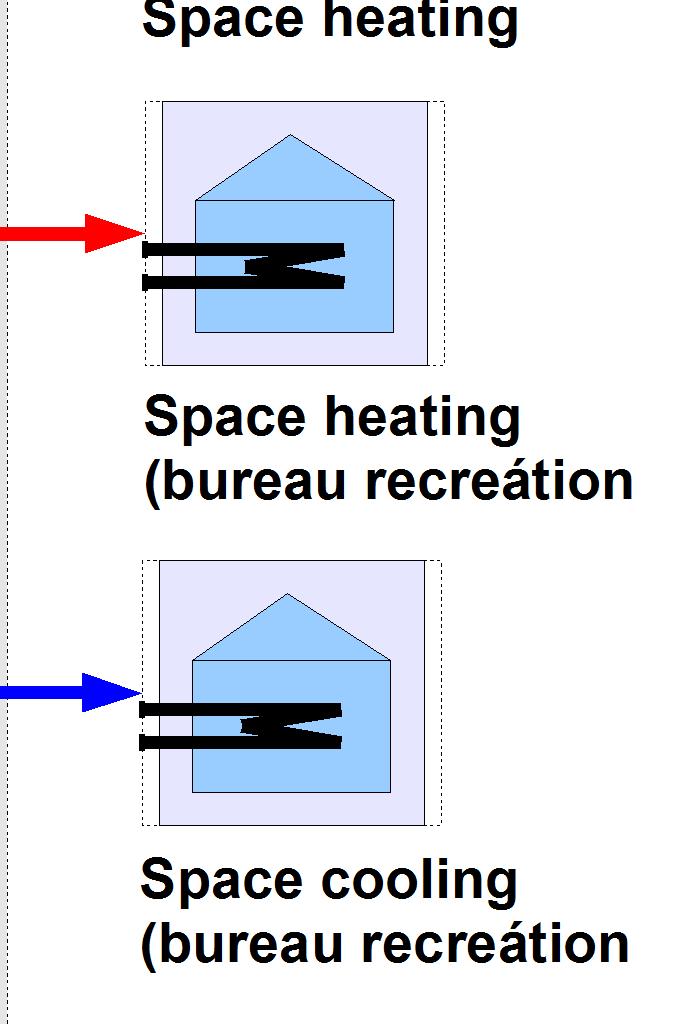
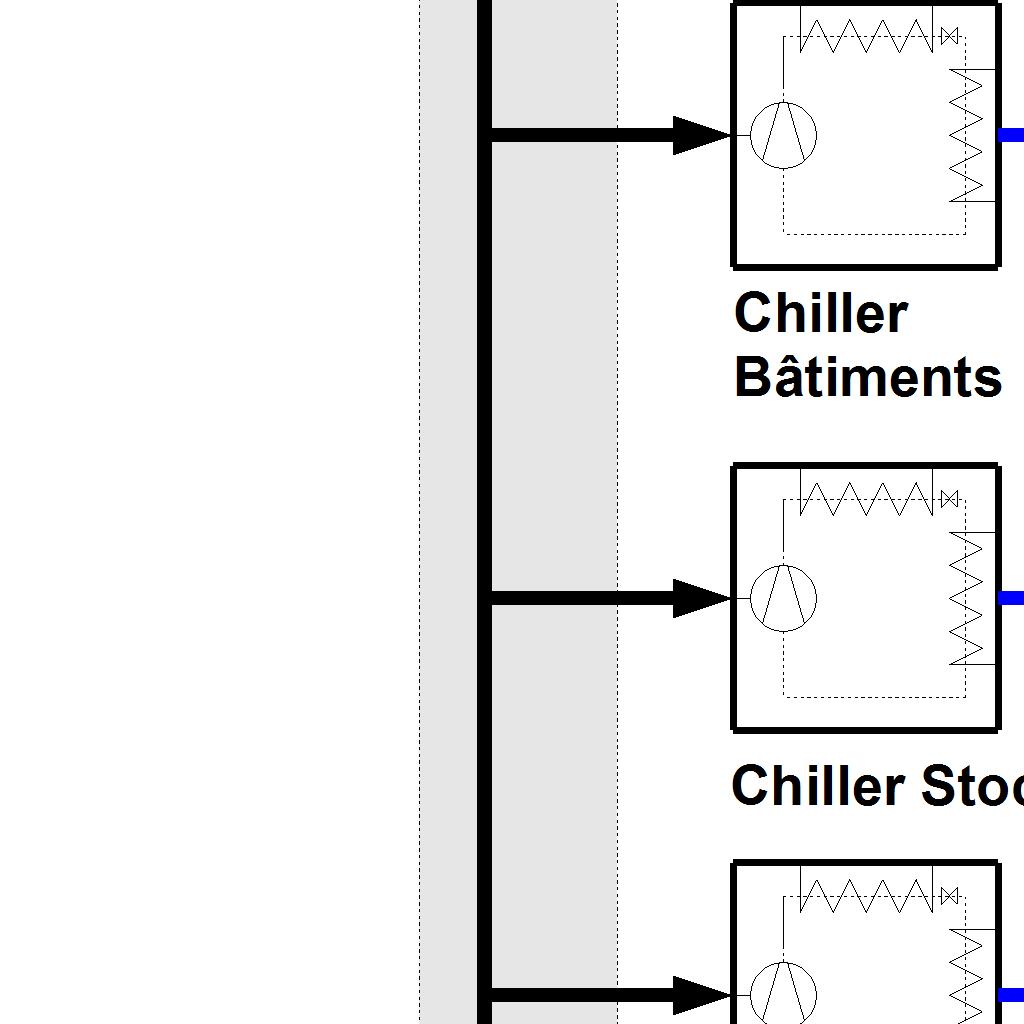
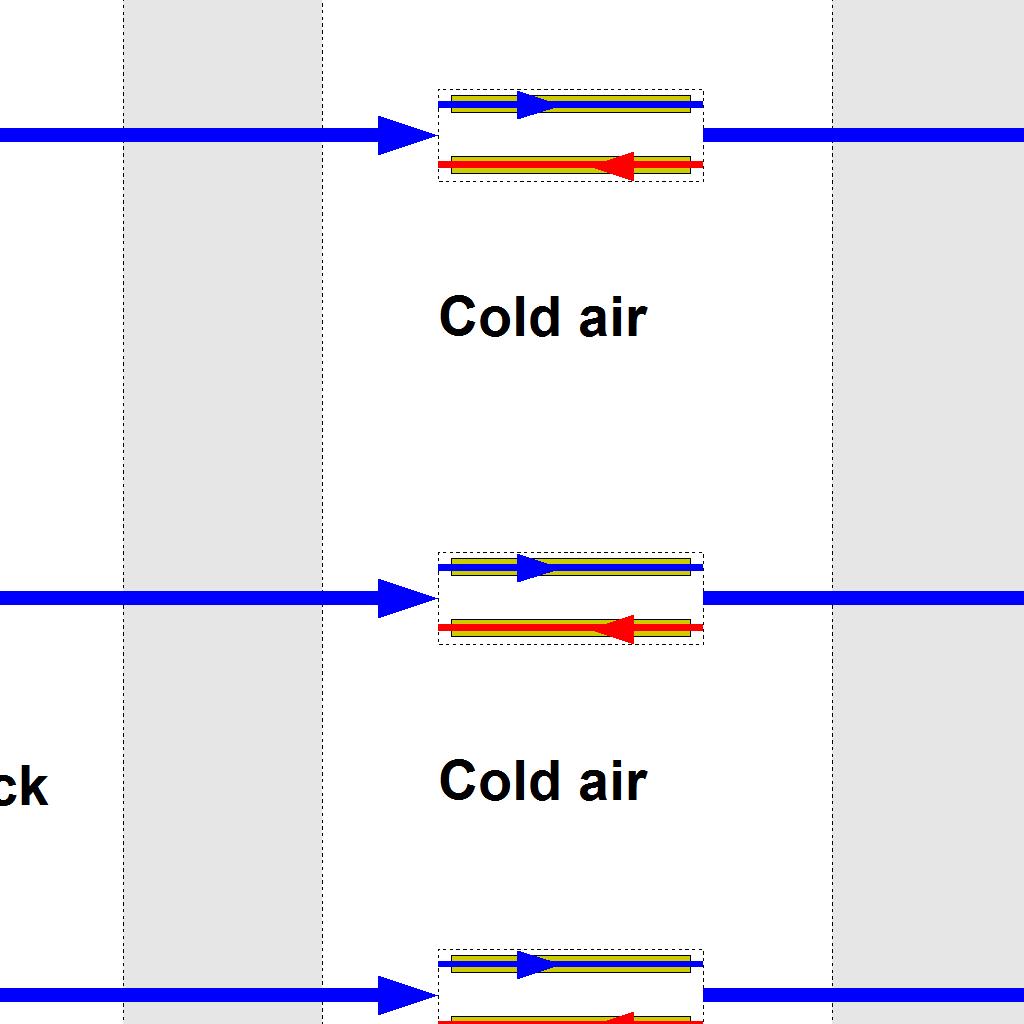
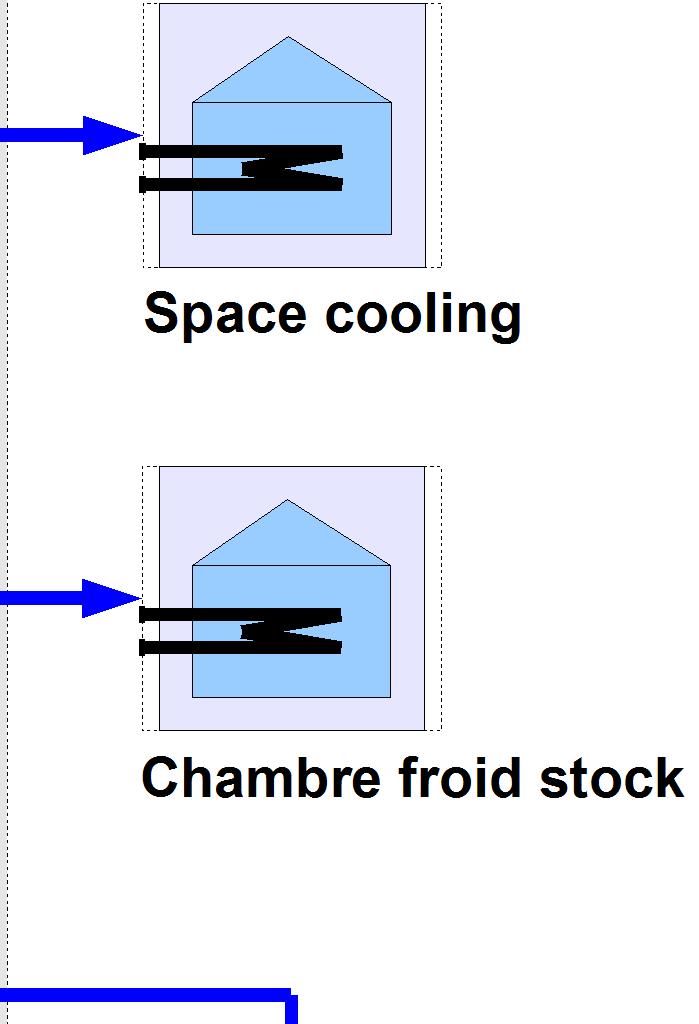
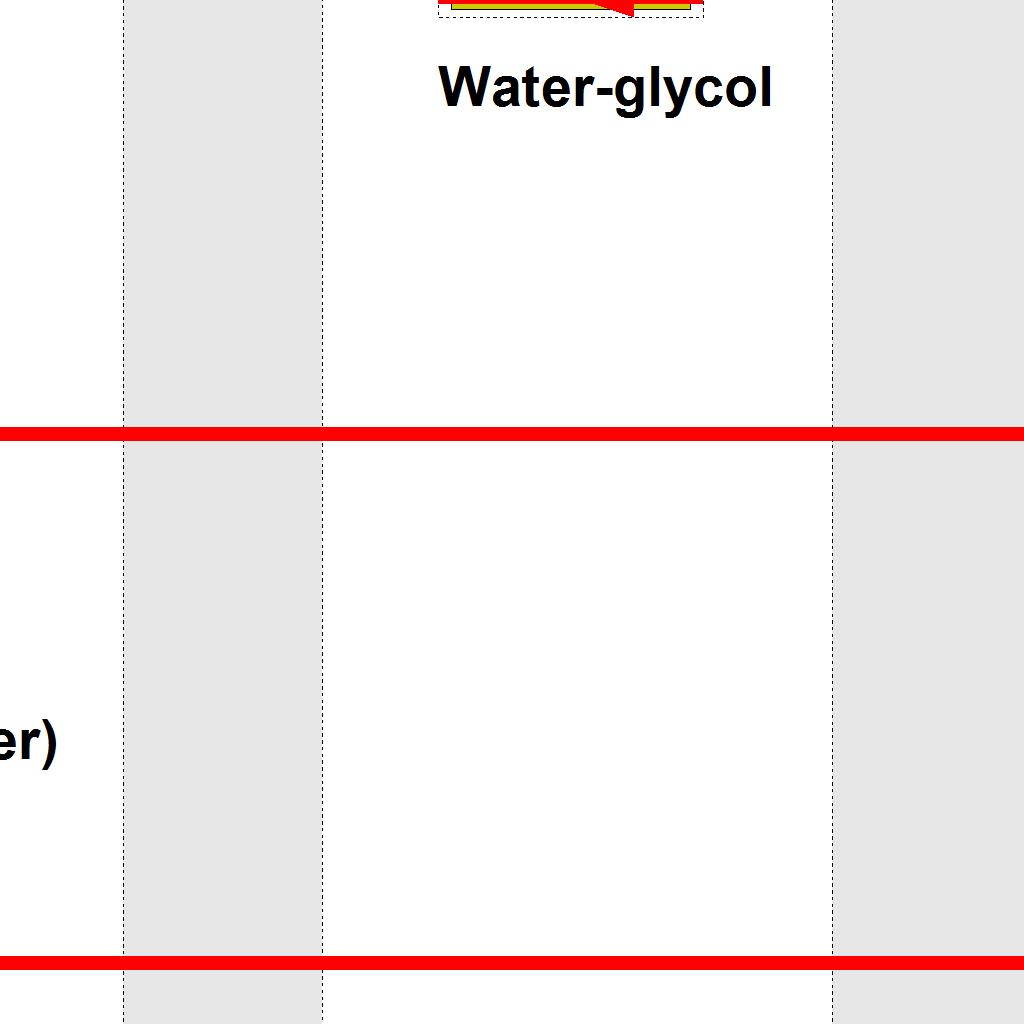
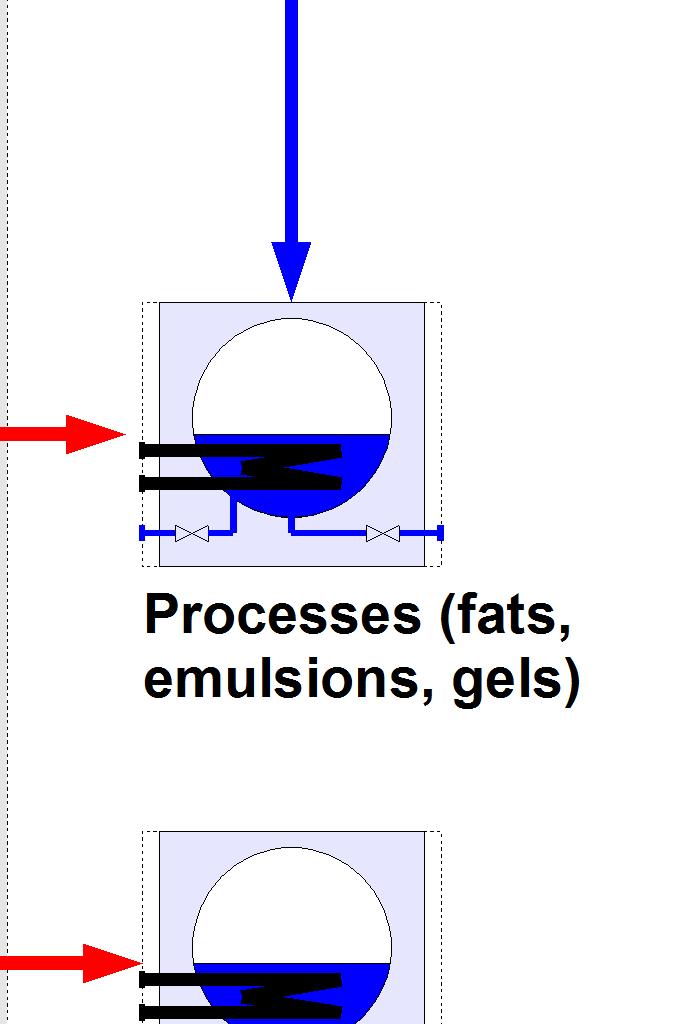
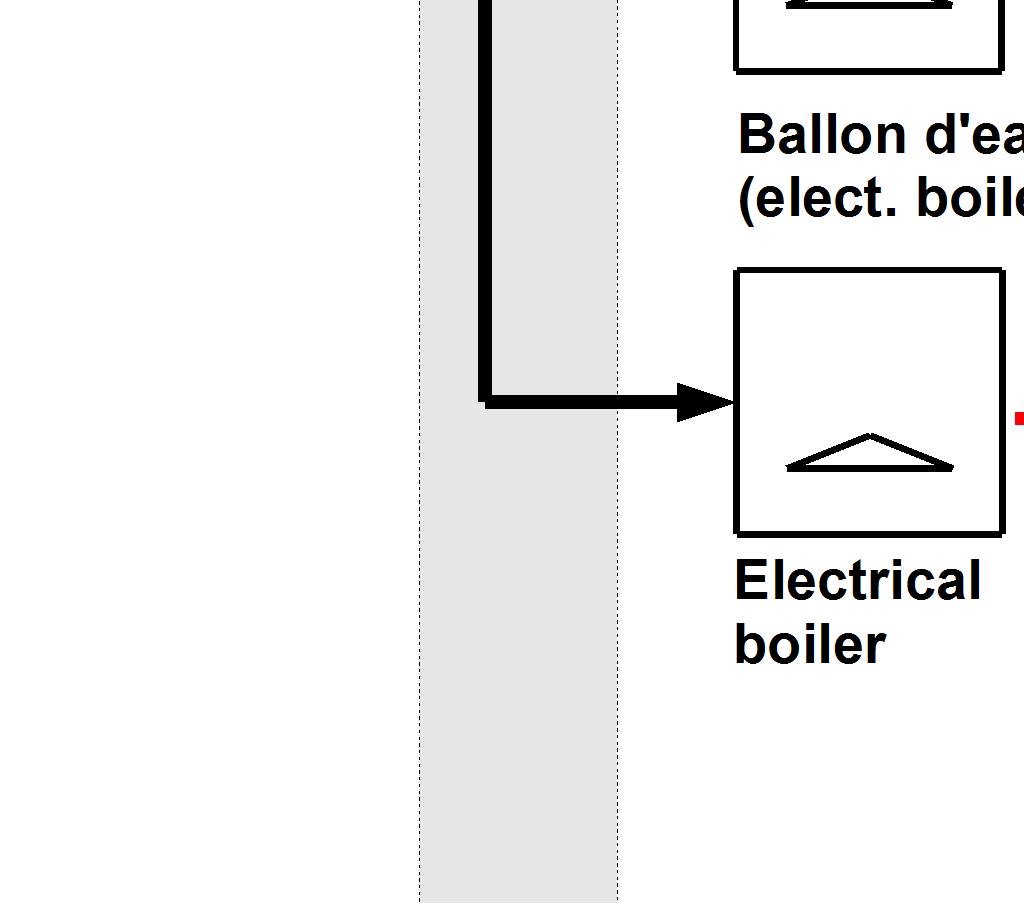

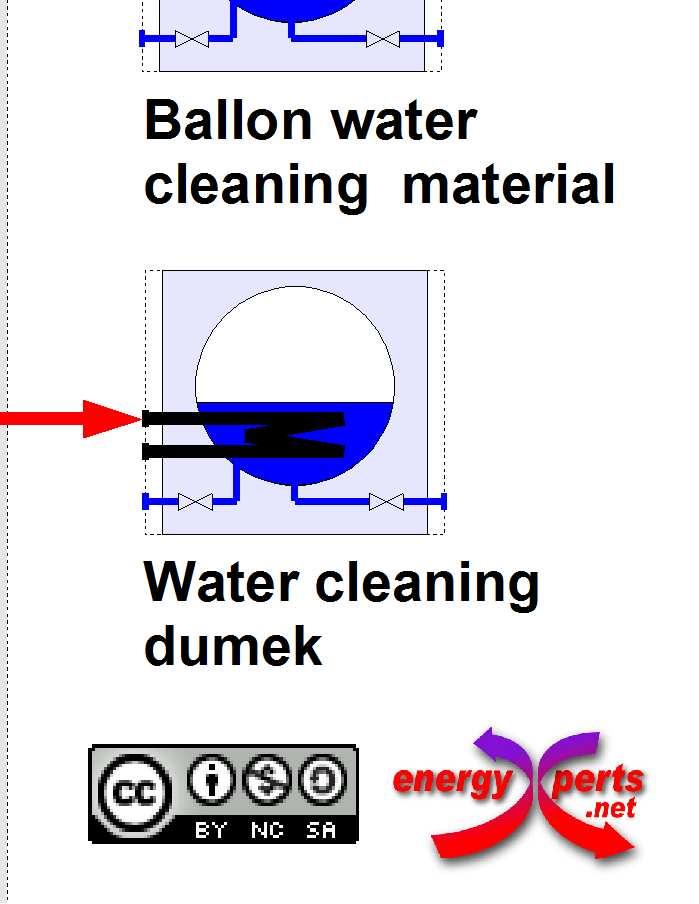
6 heat and cold supply system Figure 3. Overview of the 6
7 2.3. Additional comments Specific assumptions The results of this study are based on specific assumptions which should be further assessed in the framework of the follow-up actions for the implementation of the proposed measures. Table 1. Assumptions Description Value Justification estimate Specific heat demand of space heating 40 kwh /m2year Limited by the total gas consumption and the heat demand to generate hot water Specific cooling demand of space cooling 50 kwh /m2year Limited by the power of the chillers Temperature of return of the condensate entering in the boiler 40ºC Temperature to process/space heating is 60ºC. A T=20 K is assumed. 7
8 3. Comparative study of alternative proposals A comparative study of several technically feasible alternative proposals for energy saving has been carried out. In the following sections the alternatives are first shortly described and then the results of the comparative study are presented Proposed alternatives The technical potential alternatives that have been investigated are listed in Table 2. Table 2. Overview of the alternative proposals studied Short Name Heat recovery Cogeneration Trigeneration Solar thermal Description Heat exchanger 0,2 kw to use exhaust gas of boiler to pre-heat water Cogenerative engine 32 kw thermal /17 kw electrical for heat supply (space heating and hot water) Cogenerative engine 32 kw thermal /17 kw coupled to an absorption chiller (5kW) for heat and cold supply Solar thermal (Flat Plate Collector) 20 kw to generate hot water 8
9 3.2. Energy performance 1 Table 3. Comparative study: yearly primary energy consumption. Alternative Primary energy consumption Savings [MWh] [MWh] [%] Present state Heat recovery ,84 Cogeneration (*) ,00 Trigeneration (*) ,83 Solar thermal ,86 (*) In systems with a CHP, the excess of electricity generated in the engine, which is sold to the grid, is counted as a negative consumption. 900 Primary energy consumption (MWh) Present state Heat recovery Cogeneration Trigeneration Solar thermal Figure 4. Comparative study: yearly primary energy consumption. 1 The factors for conversion of final energy (for fuels in terms of LCV) to primary energy used in this study are 3,3 for electricity and 1,1 for natural gas. 9

10 3.3. Economic performance Table 4. Comparative study: investment costs. Assumed co-funding: 30 % for solar thermal systems and 10% for the rest of technologies. Alternative Total investment Own investment Subsidies [ ] [ ] [ ] Presen state Heat recovery Cogeneration 25,500 22,950 2,550 Trigeneration 33,500 30,150 3,350 Solar thermal 13,455 9,419 4,037 Figure 5. Comparative study: investment costs. Assumed co-funding: 30 % for solar thermal systems and 10% for the rest of technologies. 10
11 Table 5. Comparative study: annual costs including annuity of initial investment 2. The energy cost for CHP includes also the feed-in-tariff revenue for the CHP electricity. O&M costs include the O&M equipments costs and the annual costs for cooling water. Alternative Annuity Energy cost O&M [ ] [ ] [ ] Present state ,085 0 Heat recovery 58 27, Cogeneration (*) 2,626 23, Trigeneration (*) 3,449 22,873 1,211 Solar thermal 1,385 27, ,000 Annuity Energy cost O&M 30,000 Total Yearly Costs [ ] 25,000 20,000 15,000 10,000 5,000 0 Present state Heat recovery Cogeneration (*) Trigeneration (*) Solar thermal Figure 6. Comparative study: annual costs including annuity of initial investment. The energy cost for CHP includes also the feed-in-tariff revenue for the CHP electricity. O&M costs include the O&M equipments. 2 Annuity of initial investment: 10,3 % of yearly payments, calculated based on 8 % nominal interest for external financing, 2 % general inflation rate and 15 years of economic depreciation period. 11

 does not save significantly more energy than the chp by itself, so that the additional investment does not seem to be justified.")
12 4. Selected alternative and conclusions 4.1. Selected alternative The alternative proposal CHPe 32kW consisting of a cogenerative engine of 17 kw e /32 kw th has been considered the best option among the previously analysed due to the following facts: high potential of both primary energy and energy cost savings the solar thermal system (flat plate collector) of 20 kw has been discarded due to the long pay-back period the trigeneration system (chp engine of 32 kw coupled to an absorption chiller 5 kw) does not save significantly more energy than the chp by itself, so that the additional investment does not seem to be justified. In the following sections, the selected alternative is described in detail Process optimisation Since the main heat and cooling demand processes are the space heating, space cooling and hot water, no possible process optimization has been considered. (a) (b) Figure 7. (a) Natural gas fired boiler for hot water and space heating. (b) Electrical heating 12
13 Heat recovery Heat recovery has been excluded due to the low potential Heat and Cold Supply In the new system proposed a cogeneration plant (engine) is added to the heat supply system. The CHP plant can feed heat into the existing hot water network using the exhaust gas (113ºC approx) and the cooling water (95ºC approx). The technical specifications of the new CHP turbine are given in Table 6. Table 6. Technical specifications of the new CHP gas turbine. Parameter Units Technical data Type of equipment - CHP engine Nominal power (heat or cold output) kw 32,00 Fuel type - Natural gas Fuel consumption (nominal) kg/h 4,30 Electricity power input kw 17,00 Electrical power generated (CHP) - 0,32 The contribution of the new equipments to the total heat supply (173 MWh) is shown in Table 7 while the contribution to the cooling supply (108 MWh) is shown in Table 8. Equipment USH by equipment [MWh] [% of Total] Hot water boiler 28 15,88 Electrical boiler cleaning Dumek 5 2,78 Ballon 0 0,07 Dumek and fondoir 5 3,11 Heat pump 22 12,74 New CHP ,43 Total Table 7. Contribution of the different equipments to the total useful heat supply (USH) in the company. 13

 in the company.")


14 Figure 8. Contribution of the different equipments to the total useful heat supply (USH) in the company New CHP 2 Hot water boiler Electrical boiler cleaning Dumek Ballon Dumek and fondoir Heat pump 30 [MWh/month] February January March April May June July August October December September November Figure 9. Monthly distribution of the heat supply by equipment. 14


15 Table 8. Contribution of the different equipments to the total useful cooling supply (USC) in the company. Equipment USC by equipment [MWh] [% of Total] Group glacée process 3 2,63 Group froid chambre froid 0 0,42 Group glacée space cooling 95 87,54 Heat pump 10 9,41 Total Figure 10. Contribution of the different equipments to the total useful cooling supply (USC) in the company. 15
16 Group glacée process Group froid chambre froid Group glacée space cooling Heat pump [MWh/month] Jan Feb Mar Abr May Jun Jul Aug Sep Oct Nov Dec Figure 11. Monthly distribution of the cooling supply by equipment. 16
17 4.2. Summary: saving potential with respect to present state and economic performance The following measures are proposed: cogeneration (engine) for covering the base load of the heat demand This measure allows a saving of 15% of current primary energy consumption (including primary energy for non-thermal uses. Regarding primary energy for thermal uses, 17,7% is saved) and 5,26% of current energy costs (including cost of energy, operation and maintenance costs and amortization). The required investment cost is with a payback period of 6,3 years (taking into account subsidies). Table 9. Comparison of the present state and the proposed alternative: saving potential and economic performance. Total primary energy consumption (1) U.M. Present state Alternative Saving [%] - total [MWh] ,05 - fuels [MWh] ,49 - electricity [MWh] ,32 Primary energy saving due to renewable energy [MWh] CO 2 emissions [tons/a] ,9 Annual energy system cost (2) [EUR] ,26 Total investment costs (3) [EUR] Payback period (4) [years] - 6,3 - (1) including primary energy consumption for non-thermal uses (2) including energy cost (fuel and electricity bills), operation and maintenance costs and annuity of total investment. (3) total investment excluding subsidies. (4) supposing 10% of funding of total investment (subsidies or equivalent other support mechanisms) 17