Integration of trigeneration and CO2 refrigeration systems for energy conservation in the food industry AFM 251
|
|
|
- Evelyn Neil Warner
- 5 years ago
- Views:
Transcription
1 Integration of trigeneration and CO2 refrigeration systems for energy conservation in the food industry AFM 251 Savvas Tassou and INyoman Suamir On behalf of AFM251 consortium BRUNEL UNIVERSITY
2 Content of Presentation Background Aims and Objectives of Project and Partnership Test facilities and test results Test Supermarket Energy analysis Results and Conclusions
3 Greenhouse Gas Emission Challenges for Supermarkets Retail food outlets in the UK are responsible for 3% of electrical Energy Consumption and 1% of CO 2 e Emissions Energy consumption of 10 largest retail food chains (electricity and gas) responsible for 5 MtCO 2 e per year Significant pressures to reduce GHG emissions whilst maintaining or improving sales and profitability Carbon Reduction Commitment (CRC) amongst others
4 Percentage emissions from the distribution and retail phase of two food products* Fresh packed meat Frozen peas Lighting 3% Plastic shopping bags 2% HVAC 2% Food waste including transportation 2% Refrigerated warehouse 0% Transport 3% HVAC 2% Lighting 3% Plastic shopping bagsfood waste including 1% transportation 1% Refrigerated warehouse 0% Transport 1% Refrigerated display cabinets Refrigerant leakage Refrigerant leakage Refrigerated display 42% 34% 45% cabinets 57% Walk-in coolers&freezers including refrigerant leakage 1% Walk-in coolers&freezers including refrigerant leakage 1% 477 gco2e/kg 1000 gco2e/kg *Tassou et.al. (2011) Applied Thermal Engineering 31 (2011) Defra project (FO405)
5 Reduction of direct emissions per kg of temperature controlled (refrigerated) product ~ 50% of carbon footprint of refrigerated product in supermarket from direct emissions - refrigerant leakage (R404A and 15% leakage) Approaches to reduce direct emissions Reduce leakage (F-Gas regulations) Use refrigerants with low GWP Use natural refrigerants (CO 2, HCs, Ammonia in cascade arrangement)
6 Reduction of indirect emissions per kg of temperature controlled (refrigerated) product ~ 50% of carbon footprint from indirect emissions electrical energy consumption of refrigeration equipment Approaches to reduce indirect emissions Buy green electricity expensive and in short supply Efficiency improvements Local Power Generation Natural gas as the fuel Biomass (wood chips) Biofuels (biodiesel, digester gas etc)
7 AFM 251- Integration of CO 2 Refrigeration and Trigeneration Systems Why? 1. CO 2 is a natural refrigerant with negligible GWP 2. Trigeneration- Local power generation using natural gas or renewable fuels and simultaneous production of heat and cooling 3. Use cooling/refrigeration from sorption system to maximise efficiency of CO 2 refrigeration system. 4. Significantly reduce both direct and indirect emissions
8 AFM 251- Partnership Defra LINK funded programme 1. Brunel University (Academic/Research lead partner) 2. Retailers (Tesco Stores and Somerfield) 3. Consultants (CSA-Emerson; ACDP; Doug Marriott Associates; CRT) 4. Equipment manufacturers and Suppliers: Danfoss; Bock Compressors; Cogenco; Bowman Power; George Barker (Epta group); Bond Retail Services Ltd; Apex Air Conditioning; A&N Shilliday&CO;


9 Three main subsystems CHP unit Sorption refrigeration system CO2 refrigeration system The basic concept CO 2 condenser CO 2 liquid receiver Chilled fluid pump Absorption chiller Hot fluid pump MT Display cabinet LT Display cabinet Electricity Exhaust gas IHX Boiler HX Air Generator Set Fuel CO 2 Pump CO 2 Compressor Bock HGX12P/60-4 CO 2 CHP Plant


10 Test facilities Pulse vessel and plate heat exchanger Environmental test chamber for CO2 work CO2 Coil design process LT compressor and pump unit
11 Performance of CO 2 LT refrigeration system (Investigated at Tc = -7 [C] and Te = -32 [C]) Refrigeration capacity, or power (kw) Some test results LT refrigeration capacity Compressor power COP Time (20 seconds) COP COP Performance of MT CO 2 refrigeration system at different evaporating temperatures Te = -6 [C] Te = -8 [C] Te = -10 [C] T Te -6 [C] Te -8 [C] Te [C] eva = -6 o C T eva = -8 o C T eva = -10 o C T eva = -6 o C T eva = -8 o C T eva = -10 o C Circulation ratio Refrigeration Capacity (kw) Circulation ratio
12 Some test results Combined performance of MT and LT CO 2 refrigeration system COP-MT CR =1.3, T c = -7 o C and T e = -32 o C) COP-MT COP-Overall COP-LT Time (20 seconds) COP-LT or Overall.

")
 Fully automatically")
13 Case Study Application of system to a medium size supermarket 50,000 ft 2 net sales area store Timber frame and sustainable cladding Daylighting (roof lights and clerestory windows) CHP Doors on chilled food cabinets Mixed mode ventilation (wind catchers) Fully automatically dimmable lights
 200 kw.")

14 CASE STUDY STORE Energy system of the store: Electricity: supplied from National Grid and CHP/Trigeneration option Cooling for HVAC: Air cooled electric chiller installed (R-407A) 200 kw. Option for cooling to be supplied by Absorption chiller Refrigeration: Cascade transcritical CO2 refrigeration system with flash gas bypass Design refrigeration-capacity: - MT system 4 55 kw - LT 35 kw Heating: 2 gas 200 kw th., Net sales area: 51,190 ft 2 Opening date: Opening hours: 8 a.m. to midnight CHP/Trigeneration Biofuel engine based CHP 200 kw electricity 350 kw heat Water-LiBr absorption chiller 250 kw cooling capacitywith chilled water circuit
15 ACTUAL ELECTRICITY AND GAS DEMAND OF THE STORE Electricity usage: Electricity: Annual demand: 2,731 MWh Hourly annual average: kw Hourly peak demand: 463 kw Gas: Annual demand: 874 MWh
16 ELECTRICAL ENERGY CONSUMPTION OF REFRIGERATION PACKS AND CABINETS Total Refrigeration HT-Refrigeration LT Refrigeration Display cabinets Annual kwh Hourly average (kw) Hourly max (kw) Percentage (%) 1,067, , , ,
17 HOURLY COOLING DEMAND Cooling demand: Annual demand: 202,247 kwh Hourly annual average: 58 kw Hourly peak demand: 210 kw Average COP: 2.9

18 ENERGY SYSTEM ALTERNATIVES INVESTIGATED System-1: Conventional energy system with R-404A refrigeration, electric chiller and gas boiler Mix fuel η e-grid National grid E e-grid SUPERMARKET ENERGY DEMAND NG η e-sg Standby Generator E e-sg Primary Fu uel NG E e-chiller E e-r404a R-407C Chiller R-404A Refrigeration E e-others E c E r Lighting, preparation, food, services, cabinets and others Cooling demand Heating demand HVAC MT refrigeration demand Annual fuel E f-conv E f-boiler η th Gas fired boiler LT refrigeration demand Domestic hot water demand E h
19 FUEL UTILISATION RATIO OF SYSTEM 1 (CONVENTIONAL) Annual average Fuel Utilisation Ratio (FUR) Overall Refrigeration Cooling Heating Electrical % % 2.07 % 7.29 % %
20 System-2: Existing system with Cascade transcritical CO 2 refrigeration, biodiesel engine based CHP, electric chiller (R-407A), and gas boiler assuming Mix η e = 33% National grid Exported electricity 42.7 % FOOD RETAIL STORE Primary Fuel Bio-fuel Natural gas η e = 35% Biofuel Engine based CHP R-407A Chiller Absorption Chiller 57.3% 202 MWh Lighting, preparation, food, services and others Cooling demand Heating demand HVAC Annual store s fuel Cascade CO 2 Refrigeration Display Cabinets 1,328 MWh 432 MWh MT refrigeration demand LT refrigeration demand MWh η th = 80.8% Gas fired boiler Domestic hot water demand CASCADE TRANSCRITICAL CO 2 REFRIGERATION AND TRIGENERATION PLANT 706 MWh

21 EXISTING CO 2 REFRIGERATION SYSTEM IN THE STORE
22 FUEL UTILISATION RATIO OF THE INVESTIGATED ENERGY SYSTEM (SYSTEM - 2) Annual average Fuel Utilisation Ratio (FUR) Overall Electrical Cooling Heating Refrigeration 58.7% 24.1% 2.4% 9.4% 22.8%

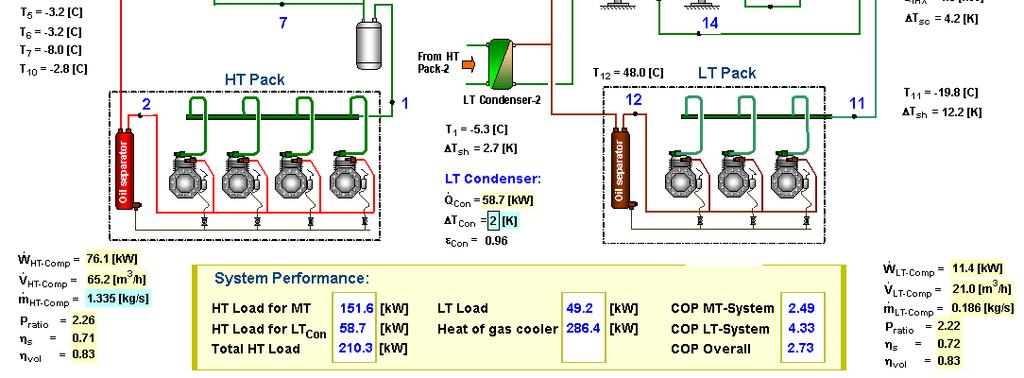
23 System-3: Modification of existing system with transcritical CO 2 refrigeration cooled by trigeneration, gas engine based CHP, electric chiller for space cooling (R-407A), and gas boiler SV ICMT Air cooled gas cooler/ condenser MT display cabinets LT display cabinets HT condenser Cooling from trigeneration ICM SV HT liquid receiver EXV EXV LT liquid receiver EXV IHX HT pack From other HT packs LT pack LT condenser
24 FUEL UTILISATION RATIO OF THE INVESTIGATED ENERGY SYSTEM (SYSTEM - 3) Annual average Fuel Utilisation Ratio (FUR) Overall Electrical Cooling Heating Refrigeration 60.7% 28.1% 2.4% 8.8% 21.5%


25 Energy Flow Diagram of the Proposed Energy System with Integrated Volatile/DX CO 2 Refrigeration (System-4) Mix η e = 33% National grid Exported electricity FOOD RETAIL STORE Primary Fuel Natural Gas Natural gas η e = 36.6% Gas Engine based CHP R-407A Chiller Absorption Chiller 202 MWh Lighting, preparation, food, services and others Cooling demand Heating demand HVAC Annual store s fuel Volatile/DX CO 2 Refrigeration Display Cabinets 1,328 MWh 432 MWh MT refrigeration demand LT refrigeration demand MWh η th = 80.8% Gas fired boiler Domestic hot water demand VOLATILE/DX CO2 REFRIGERATION AND TRIGENERATION PLANT 706 MWh th


26 *System-4. Schematic diagram of proposed system - Integrated Volatile/DX CO 2 Refrigeration (System-4) Cooling tower Cold water pump Sorption chiller Condenser Air cooled gas cooler CHP Hot water Chilled water pump IHX ICMT SV Liquid receiver RV MT display cabinets IHX Pump pack MT Pack LT Pack EXV LT display cabinets
27 FUEL UTILISATION RATIO OF THE INVESTIGATED ENERGY SYSTEM (SYSTEM - 4) Annual average Fuel Utilisation Ratio (FUR) Overall Electrical Cooling Heating Refrigeration 64.3% 29.5% 2.6% 9.2% 23.0%
28 PLANT OPTIMISATION OF THE PROPOSED ENERGY SYSTEM (SYSTEM - 4) FSR and CO 2 emission savings increase with trigeneration electrical capacity up to 340 kw FUR optimum in the range 280 to 340 kw at 65%
29 PLANT OPTIMISATION (Cont d) OF THE PROPOSED ENERGY SYSTEM (SYSTEM - 4) Optimum size of trigeneration in the range 320 to 340 kwe with absorption chiller cooling capacity 310 kw
30 VARIATION OF PAYBACK PERIOD OF THE PROPOSED ENERGY SYSTEM (SYSTEM - 4) WITH SPARK RATIO Proposed energy system payback 3.2 years Trigeneration: 340 kwe and absorption chiller of 310 kw
31 SIMULATION RESULTS Comparison of fuel consumption, CO 2 emissions and payback period Supermarket s energy systems System-1: Conventional energy system Energy consumption CO 2 emissions Payback kwh/year Saving kgco 2 /year Saving Years 9,411,406 2,187,736 System-2: Existing system based on 2009 data (absorption system 9,068, % 1,428, % No payback not in operation) System-3: Integration of cascade transcritical CO 2 refrigeration system with trigeneration System-4: Proposed energy system - Cascade subcritical (MT volatile pumped CO2) with trigeneration 7,088, % 1,327, % 4.7 6,654, % 1,246, % 3.2 2,758 MWh/year 941 tco 2 /year
32 CONCLUSIONS Integration of CO 2 refrigeration with trigeneration systems can offer energy savings of 30% and CO 2 emissions savings of the order of 43% compared to conventional approaches. System can be applied to both MT pumped systems and all CO 2 transcritical cascade systems. A wide range of fuels can be employed such as natural gas, biogas or biodiesel. System design can be adapted to suit both adsorption and absorption (LiBr-Water and R717-Water) refrigeration systems. In the event of trigeneration system failure the CO 2 refrigeration system can be arranged to operate transcritically. Good payback periods can be achieved, of the order of 3.2 years. Further overall system optimisation is possible
33 OUTPUTS AND BENEFITS FROM PROJECT Energy system design for supermarkets that can lead to significant energy and GHG emission savings. Modelling tools for design and analysis of CO2 refrigeration systems as well as complete energy systems for supermarkets Unique facilities and expertise at Brunel for test and development of CO2 refrigeration components and systems (subcritical and transcritical) as well as trigeneration systems. Exposure of participating companies to new technologies and opportunities for the improvement of existing and/or development of new products. Wide dissemination of the results to the user community through dissemination events and publications