RESULTS FROM CSLF-RECOGNIZED PROJECTS: FORT NELSON PROJECT AND ZAMA PROJECT
|
|
|
- Aubrey Lloyd
- 5 years ago
- Views:
Transcription

1 Energy & Environmental Research Center (EERC) RESULTS FROM CSLF-RECOGNIZED PROJECTS: FORT NELSON PROJECT AND ZAMA PROJECT James Sorensen, Steve Smith, John Harju, Ed Steadman, and Charles Gorecki Energy & Environmental Research Center Carbon Sequestration Leadership Forum CSLF Technical Group Meeting Venice, Italy April 23, University of North Dakota Energy & Environmental Research Center.

2 PRESENTATION OUTLINE Overview of Plains CO 2 Reduction (PCOR) Partnership Program Zama Project Background Key Lessons Learned Fort Nelson Project Background Key Lessons Learned 2

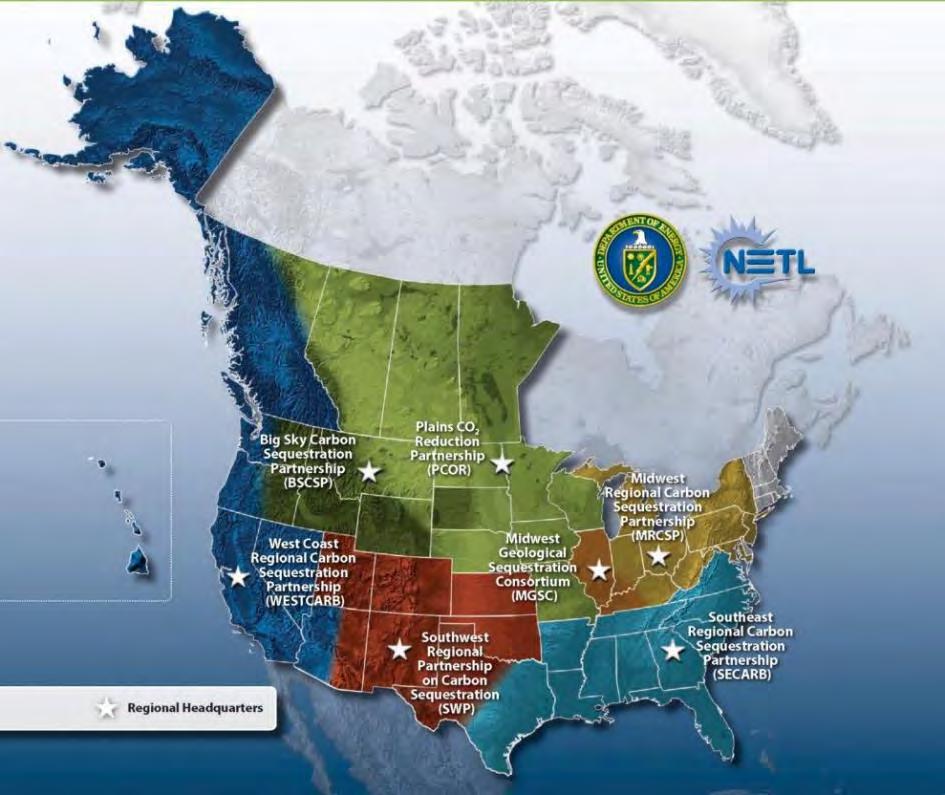
3 REGIONAL CARBON SEQUESTRATION PARTNERSHIPS 3
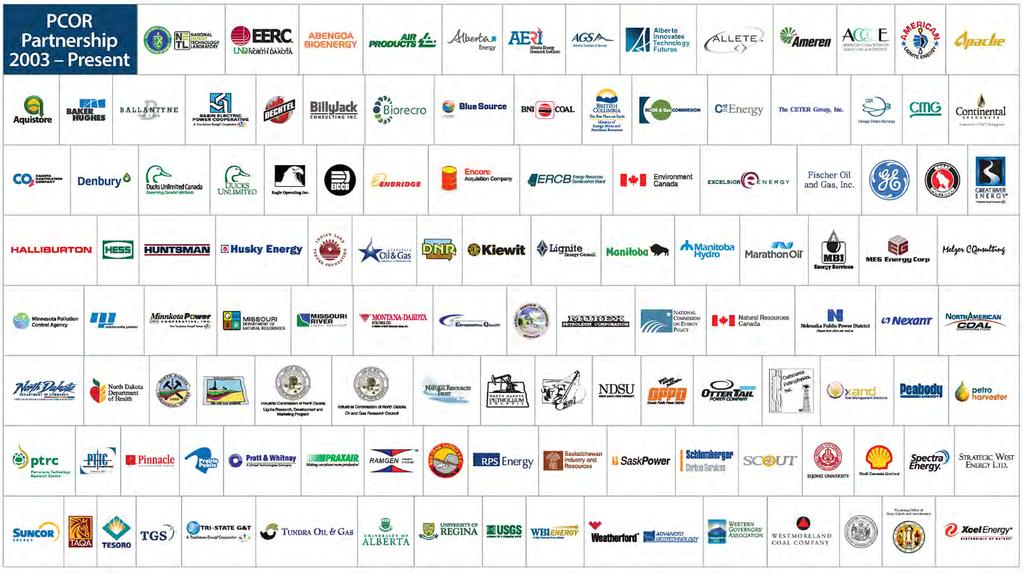
4 PCOR PARTNERSHIP 4


5 PCOR PARTNERSHIP: PROJECT COMPONENTS Bell Creek project Fort Nelson project Aquistore project Basal Cambrian project Zama project Regional characterization Public outreach Regulatory involvement Water Working Group 5

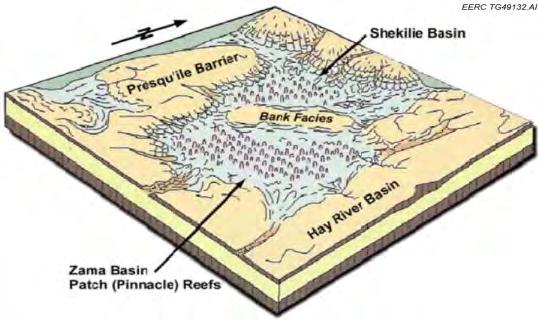


6 ZAMA BACKGROUND AND SIGNIFICANCE 6


7 ZAMA INJECTION SCHEME Injection stream 70% CO 2 and 30% H 2 S. Injection began 2006 in the F Pool pinnacle, ultimately expanded to 5 other pinnacles. 85,000 tonnes injected in the F pool as of May Project addresses the effects of impurities on CCUS. 7
8 ZAMA PVT MODELING PENG ROBINSON (PR) EQUATION OF STATE (EOS) EOS and Tuning Seven pseudo-components PR EOS Regression: differential liberation, constant volume expansion, swelling, separator, and saturation pressure Minimum Miscibility Pressure (MMP) MMP prediction of pure CO 2 Different percentage of H 2 S Key Lesson Here Presence of H 2 S lowered MMP, which lowers cost of injection. Gas-Oil Ratio, m 3 /m 3 Oil Viscosity, Pa-s Differential Liberation Test Regression Summary Pressure (kpa) Final GOR Exp. GOR Final ROV Exp. ROV Differential Liberation Calculation Regression Summary Pressure, kpa Final Oil Visc. Init. Oil Visc. Exp. Oil Visc. Relative Oil Volume, rm 3 /m 3 8


9 STRUCTURAL MODELS OF ZAMA PINNACLE REEF RESERVOIR Created models and conducted injection and production simulations on six pinnacle reefs. Keg River Zama Mb Modeling was performed to develop: CO 2 utilization factors. Estimates of CO 2 storage capacities. Keg River Surface 9

10 ZAMA PINNACLE REEF STATIC UNCERTAINTY MODEL Goals were to assess and quantify the uncertainties associated with existing data. To help CO 2 storage from operational and planning standpoints. Reef properties were allowed to vary between defined ranges for 3-D uncertainty model. To provide insight regarding the design of the CO 2 storage scheme. An improved estimate of recoverable resource (oil) and associated storage.
11 ESTIMATION OF ZAMA CO 2 UTILIZATION FACTORS AND STORAGE CAPACITIES CO 2 Utilization Factor and Recovery Contribution Based on Simulation Predictions Pool E u, Mscf/bbl E r co 2, % Pessimistic Optimistic Pessimistic Optimistic Keg River F Keg River G2G Muskeg L Average Estimates of CO 2 Storage Capacities for Three Extra Pools Pool OOIP, MMstb CO 2 Utilization (E u ), b/bbl Recovery Contributed by CO 2 (E rco2 ), % Storage Capacity G, MM tonnes Pessimistic Optimistic Pessimistic Optimistic Keg River Z3Z Keg River RRR Keg River NNN
12 KEY OBSERVATIONS AND CONCLUSIONS FROM ZAMA Results from the 6 pinnacles modeled were applied to the field as a whole (over 800 pinnacles) and suggest that more than 334 MMt of CO 2 can be stored in the Zama pinnacles as part of EOR operations. H 2 S can lower MMP, but does require modifications and specialized equipment to ensure safety and minimize corrosion. Sour CO 2 injection could yield 15% of original-oil-in-place incremental recovery at Zama. Pinnacle reefs are great candidates for CO 2 storage and sour CO 2 can be safely and economically used for CCUS. 12


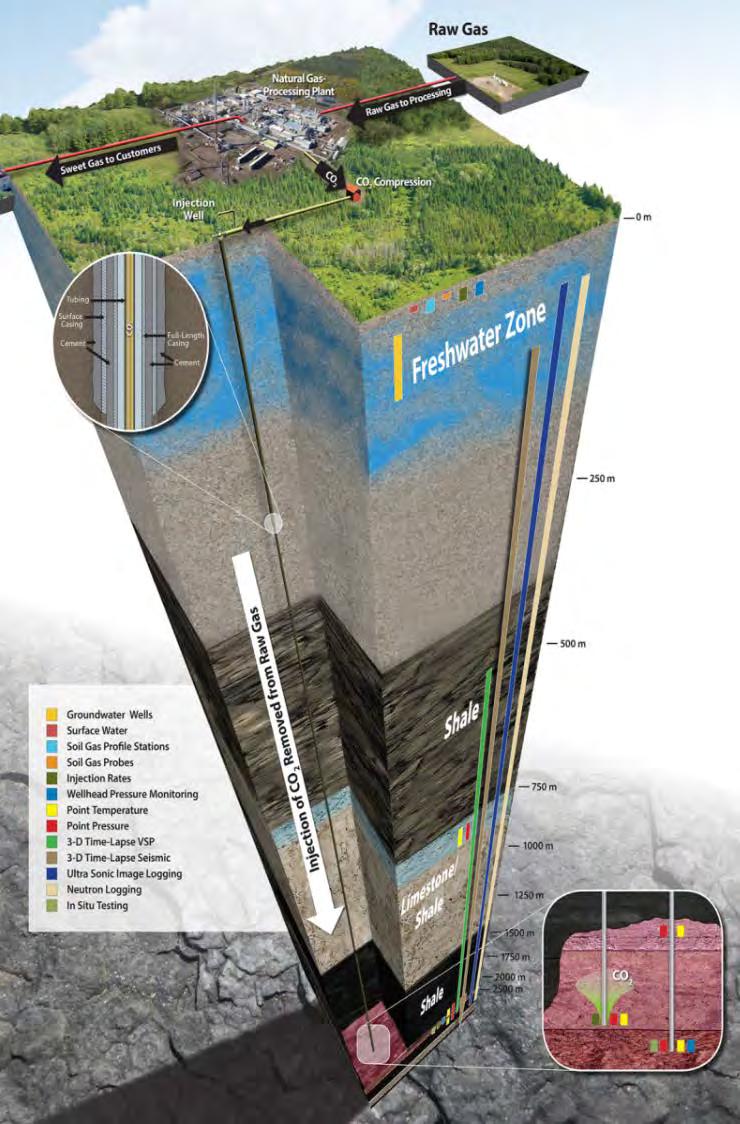
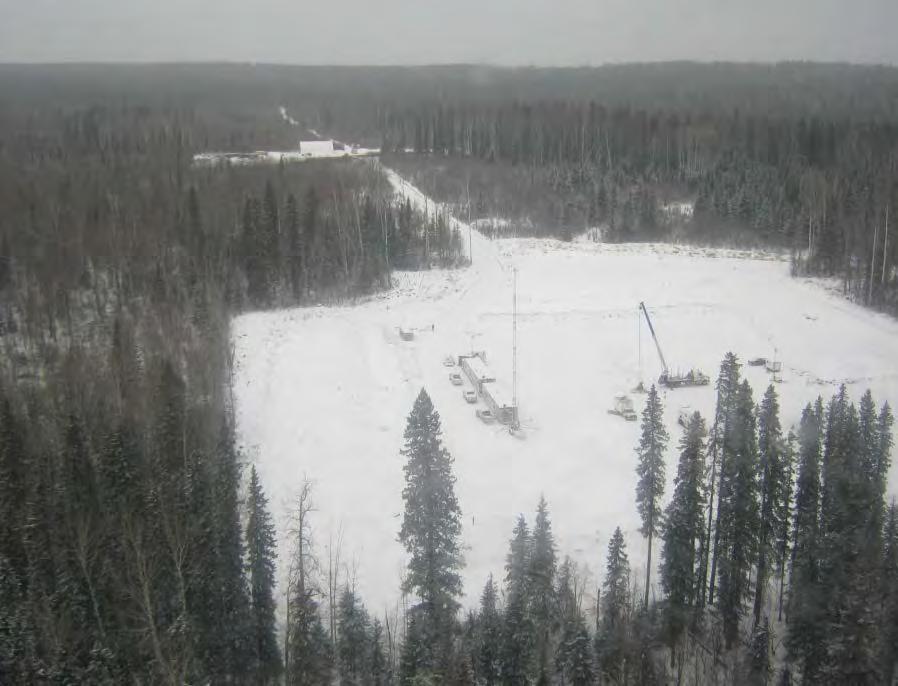
13 FORT NELSON BACKGROUND AND SIGNIFICANCE Fort Nelson CCS Project Feasibility study for CCS for a gas-processing plant in northern British Columbia: Risk-based approach to define monitoring, verification, and accounting (MVA) strategy. Site characterization. Modeling and simulation. Risk assessment. Cost-effective MVA plan. 13


14 FORT NELSON SITE CHARACTERIZATION Primary Seal Primary Sink 93 wells in study area Historical 2-D and 3-D seismic Hydrogeological studies Test Well C-61-E Core and cuttings Formation pressures Formation fluids Water injection testing Cap rock integrity testing Solubility testing Relative permeability testing Hg injection capillary pressure tests Geochemical reactivity testing
15 50-YEAR INJECTION SCENARIO Key Parameters Three injection wells Sulphur Point Formation 120 MMscf/d injection rate 2.5 MMt/year 50 years of injection

16 RECOMMENDED MVA Monitoring Elements Shallow groundwatermonitoring wells in vicinity of deep monitoring wells and injection wells Surface water sampling Lakes Rivers Soil gas monitoring in vicinity of deep monitoring wells and injection wells Four deep monitoring wells 100 m Soil Gas Shallow Monitoring Deep Monitoring

17 RECOMMENDED MVA AT FORT NELSON


18 DEEP MVA (2014 BASELINE) AT FORT NELSON
19 FORT NELSON CHARACTERIZATION AND MODELING COMPARED TO CSA GUIDELINES FOR CCS In 2012 the Canadian Standards Association established guidelines for geologic storage of CO 2 (CSA Z741-12). Fort Nelson activities were compared to those standards. Site Screening, Selection, and Characterization Site screening Site selection Site characterization and assessment Geological and hydrogeological characterization of the storage unit Characterization of confining strata Baseline geochemical characterization Baseline geomechanical characterization Well characterization Modeling for characterization Geologic static model Flow modeling Geochemical modeling Geomechanical modeling Thoroughly addressed Partially addressed SET to determine
20 FORT NELSON RISK MANAGEMENT COMPARED TO CSA GUIDELINES FOR CCS Risk Management Objectives Context Elements of concern System model Identification of context Risk management plan Risk assessment Risk identification Risk analysis Risk evaluation Planning and review of risk treatment Review and documentation Risk communication and consultation Performance metrics Scope of risk communication and consultation activities Thoroughly addressed Spectra to determine
21 FORT NELSON MVA COMPARED TO CSA GUIDELINES FOR CCS Monitoring and Verification Purpose M&V program periods Preinjection period monitoring Injection period monitoring Closure period monitoring Postclosure period monitoring M&V program objectives M&V program design Procedures and practices Required specifications Recommended specifications Contingency monitoring Thoroughly addressed Partially addressed SET to determine
22 CONCLUSIONS FROM FORT NELSON CCS at Fort Nelson is on hold until a business case can be made. An integrated approach to site characterization, modeling, and risk assessment can: Lead to an effective site-specific monitoring program. Identify data gaps in site characterization. Increase the likelihood of project success by identifying and mitigating potential project risks. The Fort Nelson site has excellent potential, but requires a business case and additional technical work to move forward.


23 ACKNOWLEDGMENT 23
24 ACKNOWLEDGMENT This material is based upon work supported by the U.S. Department of Energy National Energy Technology Laboratory under Award No. DE-FC26-08NT Disclaimer This presentation was prepared as an account of work sponsored by an agency of the United States Government. Neither the United States Government, nor any agency thereof, nor any of their employees, makes any warranty, express or implied, or assumes any legal liability or responsibility for the accuracy, completeness, or usefulness of any information, apparatus, product, or process disclosed or represents that its use would not infringe privately owned rights. Reference herein to any specific commercial product, process, or service by trade name, trademark, manufacturer, or otherwise does not necessarily constitute or imply its endorsement, recommendation, or favoring by the United States Government or any agency thereof. The views and opinions of authors expressed herein do not necessarily state or reflect those of the United States Government or any agency thereof. 24
 701.777.5181 (fax) James Sorensen Principal Geologist jsorensen@undeerc.")
25 CONTACT INFORMATION Energy & Environmental Research Center University of North Dakota 15 North 23rd Street, Stop 9018 Grand Forks, ND (phone) (fax) James Sorensen Principal Geologist 25