Public Information Meeting Wastewater Master Plan Facilities Plan Update June 23, 2010
|
|
|
- August Cooper
- 5 years ago
- Views:
Transcription


1 Public Information Meeting Wastewater Master Plan Facilities Plan Update June 23, 2010
2 Agenda Introduction Wastewater Master Plan Background Completed Projects Projects Concurrent with the WMP Master Planning Process Preferred Alternative Plan of Action Variables Moving Forward Proposed Numeric Nitrogen Criteria for Great Bay Estuary


3 The Portsmouth Wastewater System Overview Two WWTF ~ 115 miles of Collection System Urban area is Combined Stormwater and Sanitary Flow 20 pumping Stations 3 Combined Sewer Overflows (CSOs)

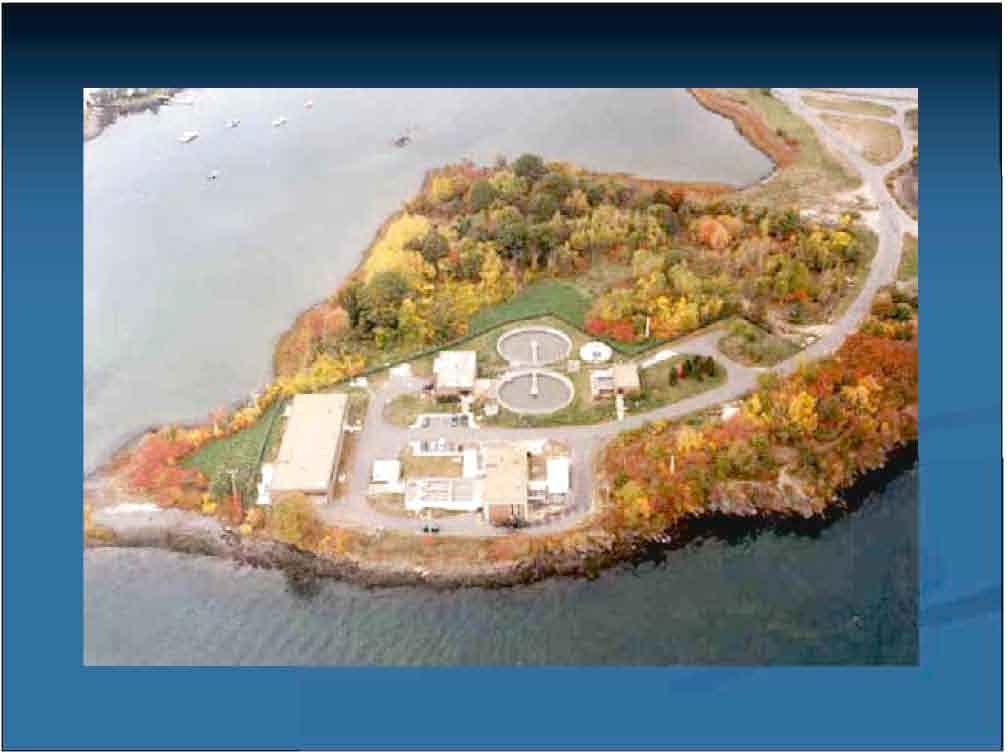
4
5 Commitment to Environmental Protection LEED Facilities Recent updates of City Ordinances Ongoing green infrastructure projects visible throughout the City


6 City LEED Buildings
7 Commitment to Environmental Protection LEED Facilities Recent updates of City Ordinances Ongoing green infrastructure projects visible throughout the City


8 City Ordinances
9 Commitment to Environmental Protection LEED Facilities Recent updates of City Ordinances Ongoing green infrastructure projects visible throughout the City


10 Green Infrastructure
11 Projects Completed Since 1997 (over $25M) Peirce Island Bridge Forcemain Essex Sheffield Separation Thaxter Fells Separation Pannaway Manor Separation Brickbox Cleaning Brackett Road Sewer Extension Peirce Island WWTP Improvements Mechanic Street Pumping Station Upgrade Route One Sewer Improvements Upper Court Street (LTCP) South Mill Pond Area - Contract 1 (LTCP)
12 Projects Completed Since 1997 (con t) South Street Sewer Separation Pease Interceptor Upgrade Lafayette Road Pumping Station Upgrade SCADA System Upgrade Gosling Road Pumping Station Upgrade Dennett Street Sewer Separation Pleasant Point Sewer Extension Lower Court Street (LTCP) Deer Street Pumping Station (LTCP) Borthwick Avenue Sewer (LTCP)

13


14 Pumps nearly half of City s wastewater Deer Street Pumping Station Upgrade


15 Estimated Typical Year CSO Volumes Discharged
16 Projects Concurrent with Master Plan (over $15M) Bartlett Street Under Construction State Street Under Construction Lincoln Area 3A Construction Starts Summer 2010 Cass Street Area Under Design Evaluating interim measures to control nitrogen and total suspended solids which can be implemented within the current NPDES Permit cycle On-going
17 WASTEWATER MASTER PLAN


18 Master Planning Complex Decision Making Process

19 EPA Approved WMP Scope of Work Define Study Parameters TM1 Regulatory Requirements Review TM2 Flow and Load Forecasting TM3 Completed Collection System Evaluation TM4 Alternatives Evaluation TM5 Develop Funding Strategies WMP Report Develop Implementation Schedule Draft Submitted Prepare the WMP Document Revisions Update Wastewater Treatment Facilities Plan On-going Update CSO LTCP Develop Public / Regulatory Participation Program On-going Project Management Completed Supplemental Work Plan-Interim Measures
20 Master Planning Process 201 Facilities Plan Iterative planning process reduces complexity Start at the 30,000 foot level and work down as information becomes available Findings evolve as the planning process progresses Value Engineering by Third Party Public and regulatory input throughout process intended to reduce re-evaluations and re-work
 system to an Membrane Biological Reactor (MBR) secondary process with nutrient")
21 Final Alternatives Phased Expansion of Pease WWTF Redirection of all the City s sanitary flow over time to an incremental expansion of the existing SBR secondary process at Pease Peirce Island WWTF Upgrade - Upgrade of the existing Peirce Island chemically enhanced primary treatment (CEPT) system to an Membrane Biological Reactor (MBR) secondary process with nutrient removal
22 Final Alternatives Evaluation The Master Plan Alternatives Considered Impact the City s collection system CSO abatement program Impact to the environment Economic impacts Cultural impacts

23 Life Cycle Cost Comparison Scenario Capital ($M) Present Value O&M (5%, 20 yrs, $M) Life Cycle Cost ($M) Peirce Island $78.6 $59.3 $137.9 Pease $66.2 $56.7 $122.9 Peirce Island $86.2 $68.7 $154.9 Pease $86.4 $57.4 $143.8 TN 8 TN 3
24 Preferred Alternative Selection Process The WMP team used a decision matrix evaluation to select a preferred alternative Evaluation criteria were developed based on the environmental, cultural and economic goals for the WMP A ranking scale was used to determine how well each alternative satisfied the evaluation criteria
25 Preferred Alternative Upgrade Pease WWTF Phased expansion Use the existing Pease WWTF outfall location


26 Expansion of Pease to a 7.9 mgd WWTF Disinfection System SBR Addition New SBR Pump Building Sludge Storage Tank Lab/Office (Expand Existing) Equipment Building Garage Primary Clarifiers Headworks Flow Splitting Structure
27 Plan of Action 2010 Complete VE Final Review by Council Submit Final Report to EPA Consent Decree Negotiations Complete targeted sewer separation Wastewater Characterization Permitting WWTF Conceptual Design Pilot Emerging Technology
28 Plan of Action cont Post construction monitoring plan for sewer separation Design of phased program Final design of first phase Preliminary design of additional phases Deer Street Modifications New Force Main to Pease Reroute a portion of Peirce Island flow to existing Pease capacity Add 3rd SBR basin Reroute additional Peirce Island flow to Pease
29 Plan of Action cont Add 4th SBR basin Reroute additional Peirce Island flow to Pease Add 5th and 6th SBR basins Reroute additional flow to Pease Build Mechanic Street dry weather pump station Marcy Street Area Debottlenecking Add final SBR basins (if necessary) Reroute all Peirce Island sanitary flow to Pease Retrofit Peirce Island as wet-weather only facility
30 Variables Moving Forward Final Value Engineering Review Affordability Analysis Ability to Phase Construction Potential Restriction of the Pease WWTF Outfall Nutrient Permit Limit Unknown
31 Variables Moving Forward Final Value Engineering Review Affordability Analysis Ability to Phase Construction Potential Restriction of the Pease WWTF Outfall Nutrient Permit Limit Unknown
32 Value Engineering Opportunity for review draft recommendations prior to submission of final report Potential cost savings
33 Variables Moving Forward Final Value Engineering Review Affordability Analysis Ability to Phase Construction Potential Restriction of the Pease WWTF Outfall Nutrient Permit Limit Unknown


34 User Rate Impact Comparison at TN Limits of 3 and 8 mg/l
35 Variables Moving Forward Final Value Engineering Review Affordability Analysis Ability to Phase Construction Potential Restriction of the Pease WWTF Outfall Nutrient Permit Limit Unknown
36 Benefits of Phased Construction Approach Allows City to continue with sewer separation program (LTCP) and measure its affect on wastewater flows Allows for continued evaluation of emerging technologies which may reduce project costs Construction period is spread over time reducing the magnitude of rate increases
37 Variables Moving Forward Final Value Engineering Review Affordability Analysis Ability to Phase Construction Potential Restriction of the Pease WWTF Outfall Nutrient Permit Limit Unknown


38 Effluent Pumping to Peirce Island WWTF Existing Pease Outfall Pease WWTF New Pease Outfall Pease Effluent Forcemain Peirce Island WWTF
39 Variables Moving Forward Final Value Engineering Review Affordability Analysis Ability to Phase Construction Potential Restriction of the Pease WWTF Outfall Nutrient Permit Limit Unknown


40 Proposed Numeric Nitrogen Criteria for Great Bay Estuary


41 Why are Nutrients Important Phosphorus and Nitrogen Phosphorus is the limiting nutrient in freshwater systems. Nitrogen is the limiting nutrient in tidal systems. Excess nutrients can lead to Eutrophication Algae blooms deplete oxygen, which can stress marine life.
42 Nutrients Regulatory Framework State Develops Water Quality Standards State Develops Numeric Nutrient Criteria State Determines if Water Body meets Water Quality Standards (303d list) EPA issues NPDES permits that regulate WWTFs
43 Nutrient Regulation National Issue EPA Initiatives Chesapeake Bay / Long Island Sound Other State Issues Massachusetts Pennsylvania Florida Colorado Kansas
44 Ass n of State and Interstate Water Pollution Control Administrators Letter to EPA (July 18, 2007) Many States are failing to find a strong linkage between the EPA recommended cause variables (N and P) and response variables... These problems can only lead to miscues in impairment identification and misdirection of scarce management and implementation resources.
45 Focus of State Program State Believes Nutrients causing excessive plant growth in the Bay and Tidal Rivers Believes light penetration is limiting eelgrass growth due to turbidity State believes controlling TN will reduce turbidity and allow eelgrass restoration
46 Proposed Numeric Nitrogen Criteria for Great Bay Estuary Primary Contact, Algae Aquatic Life Support, Dissolved Oxygen Aquatic Life Eelgrass Macro Algae
47 Concerns With State Proposed Approach
48 Technical Deficiencies Stringent TN Regulation without cause and effect demonstration (SAB Report) Available data indicate TN control likely ineffective in protecting bay resources High social and economic cost of compliance with little likelihood of success Alternative programs likely to be more effective
49 Science Advisory Board Conclusions In order to be scientifically defensible, empirical methods must take into consideration the influence of other variables. The statistical methods in the Guidance require careful consideration of confounding variables before being used as predictive tools. Without such information, nutrient criteria may be highly inaccurate. Without a mechanistic understanding and a clear causative link between nutrient levels and impairment, there is no assurance that managing for particular nutrient levels will lead to the desired outcome.


50 Overview of Water Quality Model Kinetics
51 Factors Affecting Water Column Light Extinction (Kd) Background Water Phytoplankton + Detritus (chla) Non-Algal Solids (NAS) Color (CDOM) Therefore: Kd = a + b*chla + c*nas + d*cdom
")


52 Contributions to Kd (PAR) measured at the Great Bay Buoy (From Morriston et al, 2008)
 Estimated Estimated inorganic inorganic matter matter")
xTSS (Morriston et al, 2008) Estimated Estimated organic organic matter matter turbidity")
53 Measured Daily Average Turbidity vs. Particulate Organic Carbon ( ) Estimated Estimated inorganic inorganic matter matter turbidity turbidity Turbidity ~ (0.30 to 0.51)xTSS (Morriston et al, 2008) Estimated Estimated organic organic matter matter turbidity turbidity (0) (2) 2nd (4) (6) (8) AXIS (red) represents organic matter TSS (mg/l)* * Assuming Assuming POM=50% POM=50% Carbon Carbon
54 Factors Influencing Water Column Dissolved Oxygen Reaeration BOD5 Water column stratification Algal photosynthesis and respiration DO P&R NH4 Nitrogen Phosphorus SOD Omitted Considered

55 Factors Influencing Eelgrass Survival Omitted Qualitative Evaluation Only -Wave Energy -Currents -Disease -Top Down Control Light TSS/ Turbidity NPS Color NPS SAV Algae/ Epiphytes NPS & PS Nutrients Sediment Grain Size Sediment Organic Content

 2009) Reference sites_")
56 NHPA Eelgrass Monitoring Sites within the Piscataqua River and Little Bay (Nora (Nora T. T. Beem Beem & & Frederick Frederick T. T. Short, Short, 2009) 2009) Reference sites_ Transplant sites


57 NHPA Eelgrass Monitoring Sites within the Piscataqua River and Little Bay (Nora (Nora T. T. Beem Beem & & Frederick Frederick T. T. Short, Short, 2009) 2009)

58 Missing Analyses Confirm TN concentrations control phytoplankton growth Demonstrate that a reduction in median phytoplankton concentration will occur and improve light penetration Demonstrate TN reduction is required to address nonalgal turbidity Assessment of other factors that may explain or control the available light for submerged aquatic vegetation Confirm that eelgrass losses are tied to TN increases Show that the Chl a levels in the estuary arms is cause of low DO Confirm that sediment oxygen demand was not the cause of DO depletion occurring in the estuary arms. Show that increased Chl a levels in estuary arms resulted from growth in the saline and not fresh water sections of the watershed.


59 Source: DES June 2009 Numeric Nutrient Criteria

60
61 Reality of Situation Complex System does not lend itself to simple analysis (LIS, Chesapeake Bay) Numerous factors Impact eelgrass population Nitrogen not primary factor affecting eelgrass losses Hard thinking, additional data collection and more diverse restoration efforts will be necessary
62 Regulatory Initiative April 9th Letter to EPA and DES from Dover, Durham, Exeter, Newmarket, Portsmouth, and Rochester Open Peer Review of Nutrient Criteria Formal Rule Making prior to adoption of Nutrient Criteria Demonstrate cause and effect for nitrogen limits May 17th DES Response Letter EPA s review is adequate no further effort needed Communities will have opportunity to comment before adoption

63 Long-term Great Bay Restoration Strategy Utilize Existing Infrastructure to Maximum Promote Regional Cooperation Plan for Necessary WWTF and Stormwater Upgrades Concurrently Perform Additional Science Coalition of Wastewater Communities Southeast Watershed Alliance Leverage Financial Resources Hydrodynamic Modeling Sampling to Improve Data Sets Investigate Supplemental Environmental Projects UNH Shellfish Bioextraction Pilot Eelgrass Replanting

64 Conclusion Proven commitment to and experience with environmental protection Completed and ongoing wastewater infrastructure improvements totaling $40M Committed to scientifically based, cost effective, community minded solutions City continues to move forward to meet its water quality commitments Actively engaged in regional environmental programs
65