2008 Water Measurement Workshop
|
|
|
- Griffin Jordan
- 5 years ago
- Views:
Transcription
1 2008 Water Measurement Workshop Federal Perspective On Water Measurement And Data Availability Lethbridge, Alberta July 16, 2008
2 Whiskey s for drinking, and Water s for fighting!
3 USGS Mission The USGS serves the Nation by providing reliable scientific information to describe and understand the Earth; minimize loss of life and property from natural disasters; manage water, biological, energy, and mineral resources; and enhance and protect our quality of life.

4 Streamflow Monitoring and the USGS How high? How much? When? How Frequent? Trends?
5 Expanding Uses of Streamflow Information Resource appraisal and allocation Design of Nation s water infrastructure Flood hazard planning and forecasting Reservoir operations Water-quality management In-stream flows for habitat assessment Understanding changes of streamflow Recreational safety
6 Streamflow Data Collection and Processing Data Collection Measurement of stage Measurement of discharge Data Processing Define stage-discharge relationship (rating) Use rating to convert continuous stage record into a record of discharge Data Dissemination Provide final product to multitude of users
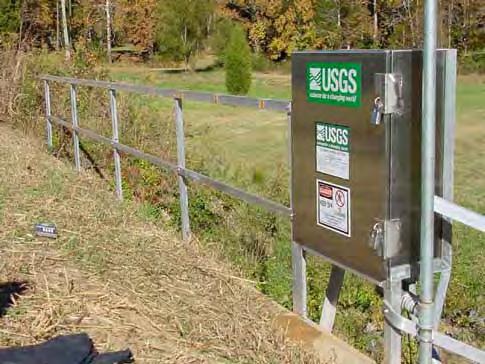
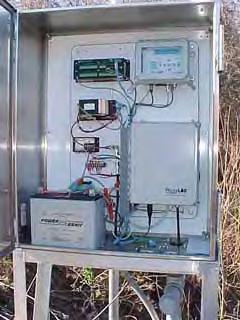
7 USGS Streamgage Stage-Discharge Gage: Continuously measure stage and estimate discharge through a stage-discharge relationship Velocity-Index Gage: Continuously measure velocity and stage; estimate discharge by combining continuous record of velocity with Area from Stage-Area relationship No typical building structure all shapes and sizes Stage measuring device float, pressure sensor, radar Recording device data logger, strip chart Telemetry GOES satellite, telephone, radio Velocity mechanical, hydroacoustic sensor, radar sensor


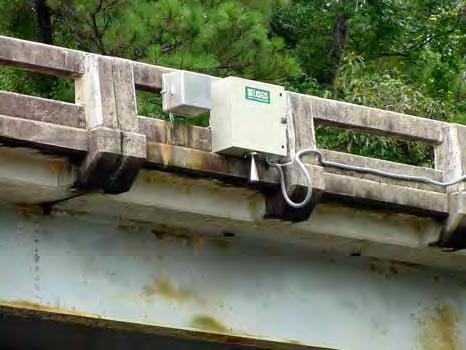
8 Stage Measurement Float Sensor Non-Contact Sensor
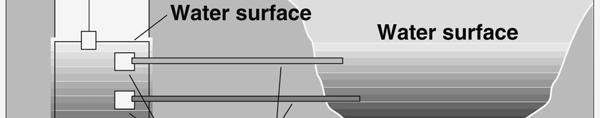
9 Stage Measurement Pressure Transducer Sensor
10


11 Streamgaging Satellite Telemetry Converting from 4hr to 1hr transmissions 1x per 4 hours 1x per 1 hour Currently, about out of 7000 streamgages transmit hourly.

12 Emergency Data Acquisition and Dissemination project complete Sioux Falls, SD as backup to Wallops Island, VA

13 Backup Up and running at Sioux Falls, SD
14 Conventional Discharge Measurement Velocity Width Depth Q = A * V
15 Flow Measurement Mostly wading measurements with mechanical meters (Price AA, Pygmy) using midsection method High flow measurements from bridges, cableways, boats In recent years, increased use of hydroacoustic measurements for wading, bridge, cableway, and boat measurements
16 Flow Measurement Quality Assurance Procedures used for current meter measurements are described in various USGS Techniques of Water-Resources Investigations (TWRI) All exceptions to standards must be reviewed and approved by the WSC Surface-Water Specialist Velocity meters are routinely spin-tested by hydrographers and tests are entered into a log

17 Discharge Measurement Wading measurement using Price AA velocity meter

18 Discharge Measurement Cableway measurement

19 Discharge Measurement Boat Measurement

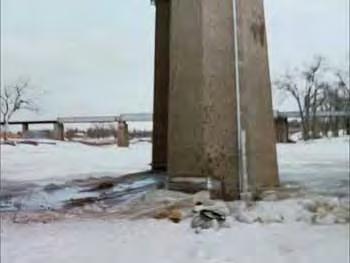
20 Discharge Measurement Ice measurement

21 Discharge Measurement Flume/weir/volumetric measurements

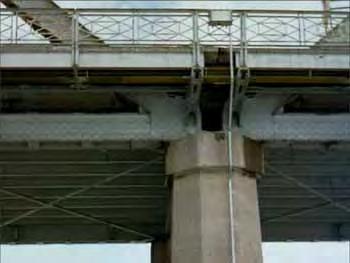
22 Discharge Measurement Indirect measurements


23 Until recently the method of streamflow measurement has not altered much in 100 years Circa 1890 Today


24 Measurement Method Improvements Traditional method: mechanical meters are still in use Paradigm shift to Hydroacoustic Methods
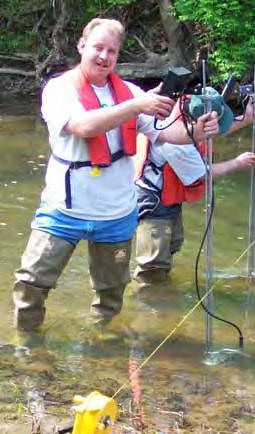
25 Discharge Measurement ADV measurement

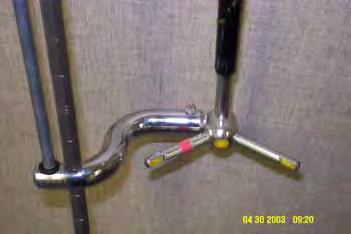
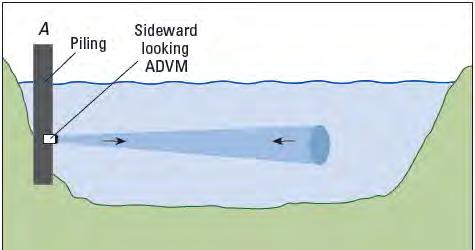
26 Index-Velocity ADVMs Side Looker ADVM
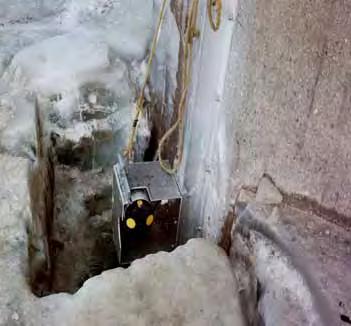
27 Index-Velocity Stations
28 Discharge Measurement ADCP measurements
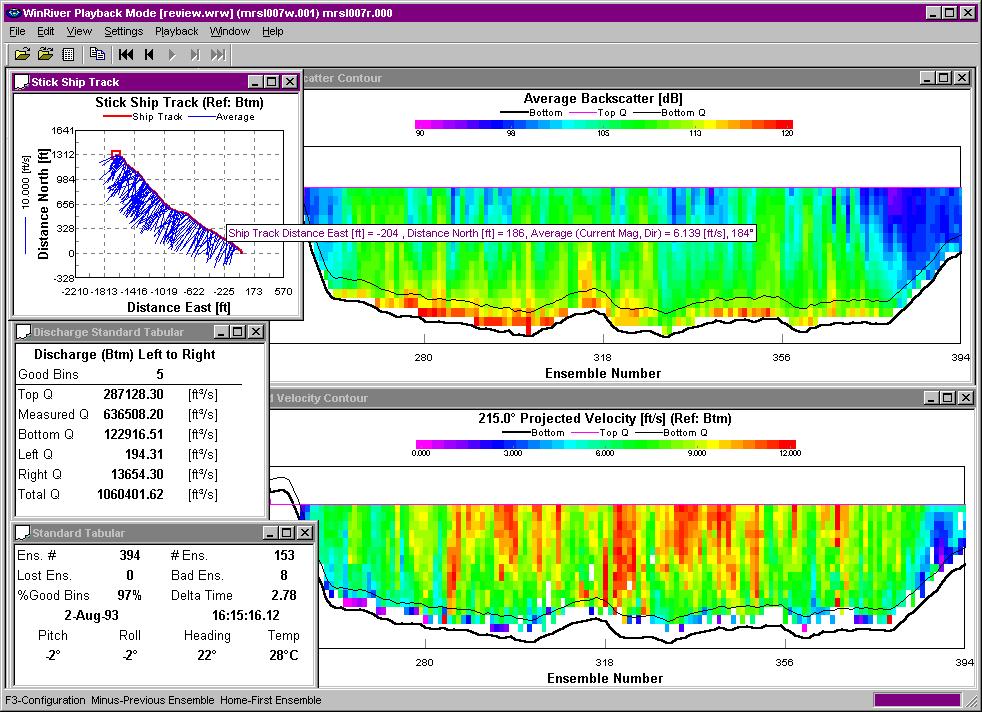


29 Profiler Measurements
30 Flood Measurements Using ADCPs January 1991 flood (Current Meters) 52 Discharge Measurements in 10 days Average Qm time minutes 11 hydrographers July 2003 flood (ADCPs) 62 Discharge Measurements in 10 days Average Qm time minutes 6 hydrographers
31 33% of Qm s made with Hydroacoustics in 2006 These data are provisional and have not been reviewed or edited. As such, they are not citeable until reviewed and approved by the U.S. Geological Survey Wading Flowtracker ADCP Bridge/Cableway Ice Boat
")
32 27% of all wading discharge measurements >40 Percent of WADING discharge measurements made with a Flowtracker in each WSC (NWIS DB)


33 57% of non-wading open water Qm s made with ADCPs! >40 Percent of BRIDGE/CABLEWAY/ADCP discharge measurements made with an ADCP in each WSC (NWIS DB)


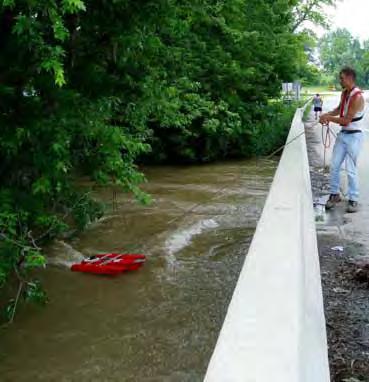
34 Why do people want to use ADCP s? Do you really want to be doing this???? When you have things like this in the water
35 OSW Technical Memos Policy on ADCP Qm s Discharges computed using SonTek RiverSurveyor Guidance on use of RDI StreamPro Archiving ADCP Discharge Measurement Data Quality Assurance Plan for ADCP Qm s Guidance on the use of the Loop Method SonTek/YSI FlowTracker firmware and software upgrades and policy

36 ADCP Qm QA Plan New information: Criteria for moving bed tests Temperature measurement Detailed procedures for Qm s

37 Future Measurement Technology Satellite telemetry Velocity Flow direction Sounding Stage

")
38 Microwave Radar Ground Penetrating Radar (GPR) Operational System

39 Radar GPR suspended from a helicopter

40 Safety, Safety, Safety The PFD policy is of the utmost importance!!! Alternatives to cableways Annual cableway and station safety inspections Bridge safety (including traffic control plans) Safety First, Every Time

41 To reduce accidents: Reduce exposure to risks and hazards

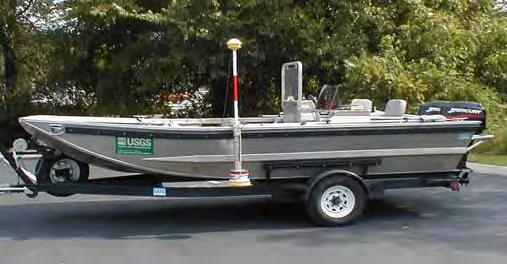
42 Technologies that may enhance safety Bank-operated cableways ADCP & Remote Controlled Boat ADCP & Tethered Boat GPR and Doppler surface velocity meter
43 Field Safety Mandatory two-person field trips during winter and highwater periods General rule-of-thumb: If you feel unsafe you shouldn t be doing what your doing. Communications
44 Streamflow Records Processing Data Entry Most stage data are entered into the National Water Information System (NWIS) Automated Data Acquisition and Processing System (ADAPS) automatically using satellite telemetry Field site visit data are manually entered by hydrographer (this will change in a few weeks)
45 Streamflow Records Processing Three step record computation process: Computed, In-review and Approved Step One: Computed Field data are processed and streamflow data computed by field person responsible for site Step Two: In-review Processed data are independently checked for completeness and accuracy. Step Three: Approved Record is reviewed to ensure hydrologic data meet WRD standards as outlined in Techniques of Water-Resources Investigations (TWRI s) and is considered final.
46 Streamflow Records Processing Other QA tools used: Threshold screening Daily value and unit value flags Swreview a script which graphically shows daily values, unit values, shift and data corrections, and discharge measurement data on a monthly basis.
47 Continuous Records Processing Improves the USGS product As water wars step up, demand for finalized (or approved) data will increase Real-time data and new rating development tool (GRSAT) now make it much easier to speed up the process of working and approving records
48 Data Availability Who would have thought it in 1889? Data Availability
49 USGS NWISWeb Database Total monitoring sites Real-time sites Real-time ground water Daily values Ground-water levels Water quality samples Water quality analyses Peak discharges (floods) 1.5 million 10,681 1, million 8.2 million 4.7 million 84.4 million 684,000 April 15, 2008
50 USGS NWISWeb Daily Values Discharge Stage Water Levels in Wells ph Temperatures Specific Conductance Other million 29.5 million 15.8 million 2.0 million 13.8 million 6.0 million 27.0 million April 15, 2008
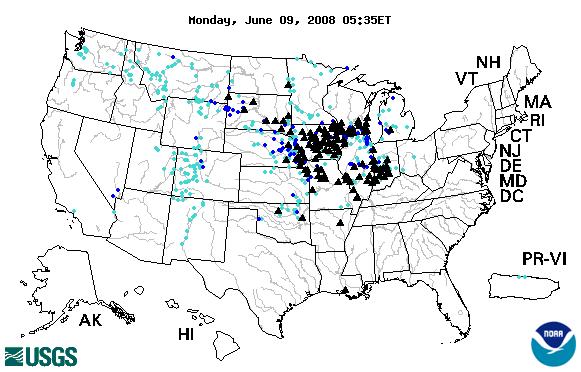
51 USGS Real Time Water Monitoring Number of sites Name ,315 Gage height 7,460 Discharge 3,339 Precipitation 1,790 Water temperature 901 Ground-water Level 882 Specific conductance 815 Lake/Res elevation 492 Stream velocity 469 Dissolved oxygen 466 Air temperature 337 ph 323 Turbidity 179 Wind speed 159 Salinity 144 Wind direction Number of sites Name Reservoir storage 60 Soil temperature 52 Air pressure 50 Relative humidity 39 Soil moisture 25 Chlorophyll 19 Pressure, diss gases 15 Barometric pressure 14 Solar radiation 10 Sodium adsorption ratio 13 Tide elevation 7 Redox potential 5 NO2+NO3 5 Cyanobacteria
52 History of NWISWeb use, in millions of successful page requests per month 4/7/

53 How do we help people find the rich data sets in NWISWeb? Water Data Explorer
54 Instantaneous Data Archive (IDA) Currently data from 7500 sites Already has 1.9 billion unit values Improves access to our data Saves work for Water Science Center Staff
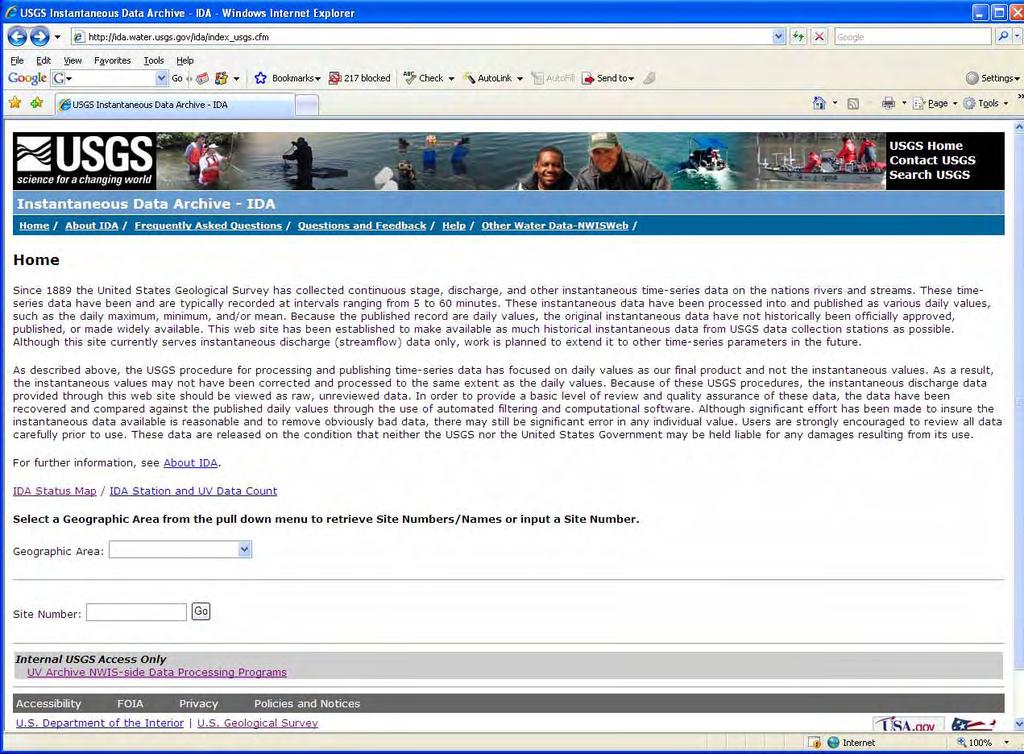
55
56 USGS Rating Depot Latest expanded, shift-adjusted rating retrieved from all stage-discharge sites at 8pm local time Available on web by site Tab delimited (rdb) format Detailed information on current shift included
57 Rating Depot Enhancements August 2008 Release Identify when rating changes occur Provide base rating in addition to shifted rating Serve data corrections
58 StreamStats Web-based tool used to obtain streamflow statistics, drainage-basin characteristics Allows user to select any site on stream Interactive map

59 StreamStats Primary Capabilities Regression equations take the form: Q100 = A * E where: A is drainage area, in square miles E is mean basin elevation, in feet Provides estimates of streamflow statistics, basin and climatic characteristics, and other information for user-selected points on ungaged streams Automatically measures basin and climatic characteristics for ungaged sites using GIS Provides published streamflow statistics, basin and climatic characteristics, and other information for data-collection stations
60
61
62 Innovative activity Homegrown /text message alert program queries our NWIS database regularly. At EST the gage height at Wabash River at Lafayette ( ) reached 11.0 ft Sends /text messages to emergency managers based on preset thresholds.
63 Future Products The new SiteVisit project will eventually allow us to store and retrieve crosssectional data so eventually a plotting program may be implemented.
64 Future of Data Collection Program Our greatest challenge? Funding Adaptability to ever changing technology
65 Questions? Norm Midtlyng

66 Old Hydrographers Never Die They just float away!
67