What does climate change mean for Indiana?
|
|
|
- Della Brittney Ferguson
- 5 years ago
- Views:
Transcription

1 What does climate change mean for Indiana? Indiana Recycling Coalition Conference June 12, 2018 Indianapolis, IN Melissa Widhalm Purdue Climate Change Research Center


2


3 Image by Adam Nieman
4 Human activities are adding heattrapping gases to the atmosphere Today 1960 For 800,000 years, CO 2 had never been above this line...until no 771k years ago 570k years ago 370k years ago 170k years ago 1880


5 Human activities are adding heattrapping gases to the atmosphere Today 1960 For 800,000 years, CO 2 had never been above this line...until no 771k years ago 570k years ago 370k years ago 170k years ago 1880
6 + 1.5 ºF +1 ºF ºF 20 th Century Average ºF - 1 ºF JAN FEB MAR APR MAY JUN JUL AUG SEP OCT NOV DEC Global Average Temperature
7 1.78 ºF ºF 1.56 ºF ºF ºF 20 th Century Average 2017 ranked 3 rd warmest on record at 1.5 ºF above average ºF - 1 ºF JAN FEB MAR APR MAY JUN JUL AUG SEP OCT NOV DEC Global Average Temperature
8 What s the chance 41 aboveaverage years in row? 1 in a trillion


9 Arctic Sea Ice Extent

10 South Bend, IN Feb Photo Credit: Santiago Flores, South Columbus, IN - June 2008


11 What will climate change mean in INDIANA?


12 PURDUE CLIMATE CHANGE RESEARCH CENTER Exploring the causes and impacts of climate change, improving predictive models to project future climate conditions, and pursuing novel ideas for mitigation and adaptation. ESTABLISHED IN 2004 Broad-based support from academic and administrative units at Purdue INTERDISCIPLINARY 80+ faculty representing 22 departments NON-PARTISAN Objective, science-based information COLLABORATIVE Partnerships with schools, NGOs, businesses, government agencies, farmers
13


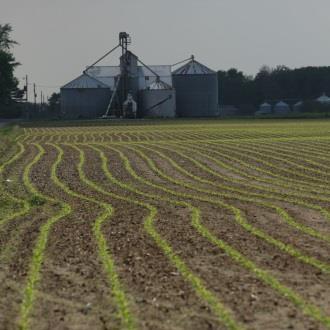
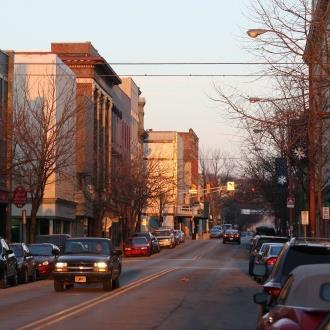

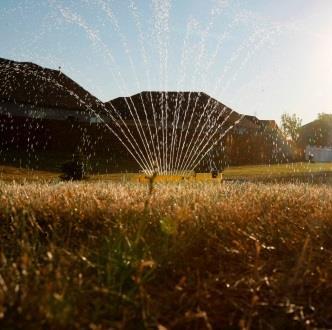


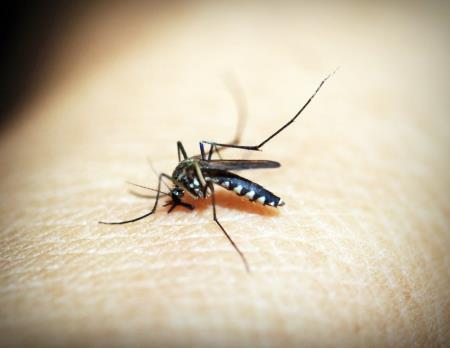
14 IN CCIA Reports Putting global change into local perspective July 31 Climate Health Forest EcosystemsUrban Green Agriculture Infrastructure Aquatic Ecosystems Tourism & Water Resources Energy Recreation Infrastructure
15 Annual Statewide Average Temperature INDIANA
16 Annual Statewide Average Temperature INDIANA
 More")


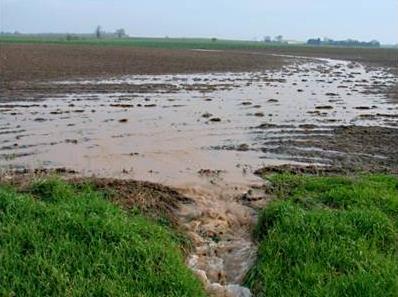
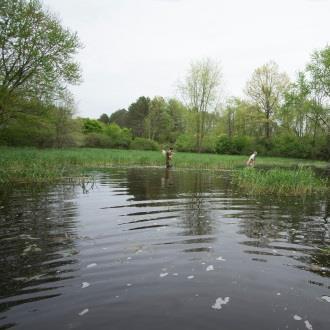
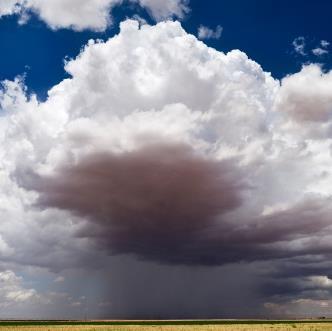
17 2050s (2041 to 2070) More frequent extreme heat More rainfall & flooding Longer warm season Based on seasonal average temperature and precipitation

18 Days Above 90 ºF Annual Count 14 PAST Where we end up depends on the choices we make! FUTURE 2050s FUTURE 2080s Future data based on high emissions scenario 2050s represents 30-year period 2041 to 2070 Elkhart County, Indiana
19 Annual Statewide Average Temperature Reducing emissions matters! INDIANA
20 How does waste fit into this? Emissions from landfills Methane Carbon dioxide Nitrous oxide Landfills are the 3 rd largest sources of human-related methane emissions


21 How does waste fit into this? Emissions from landfills Methane Carbon dioxide Nitrous oxide U.S. EPA, 2009 U.S. Emissions by sector (2006)


22 of U.S. GHG emissions are associated with the energy used to produce, process, transport, and dispose of the food we eat and the goods we use. Systems-based assessment of U.S. emissions (2006) U.S. EPA, 2009

23 Opportunities for emissions reductions Source reduction General Motors LFG Generation Plant Fort Wayne Assembly Reuse, recycle Energy recovery


24 Annual Statewide Average Temperature Reducing emissions matters! INDIANA


25 Stay informed, stay connected Jeffrey Dukes PCCRC Melissa Widhalm IN CCIA